Macroeconomic Report: US Economic Events and Policies (2000-2010)

Verified

Added on  2023/04/11

|20
|1391
|487
Report
AI Summary
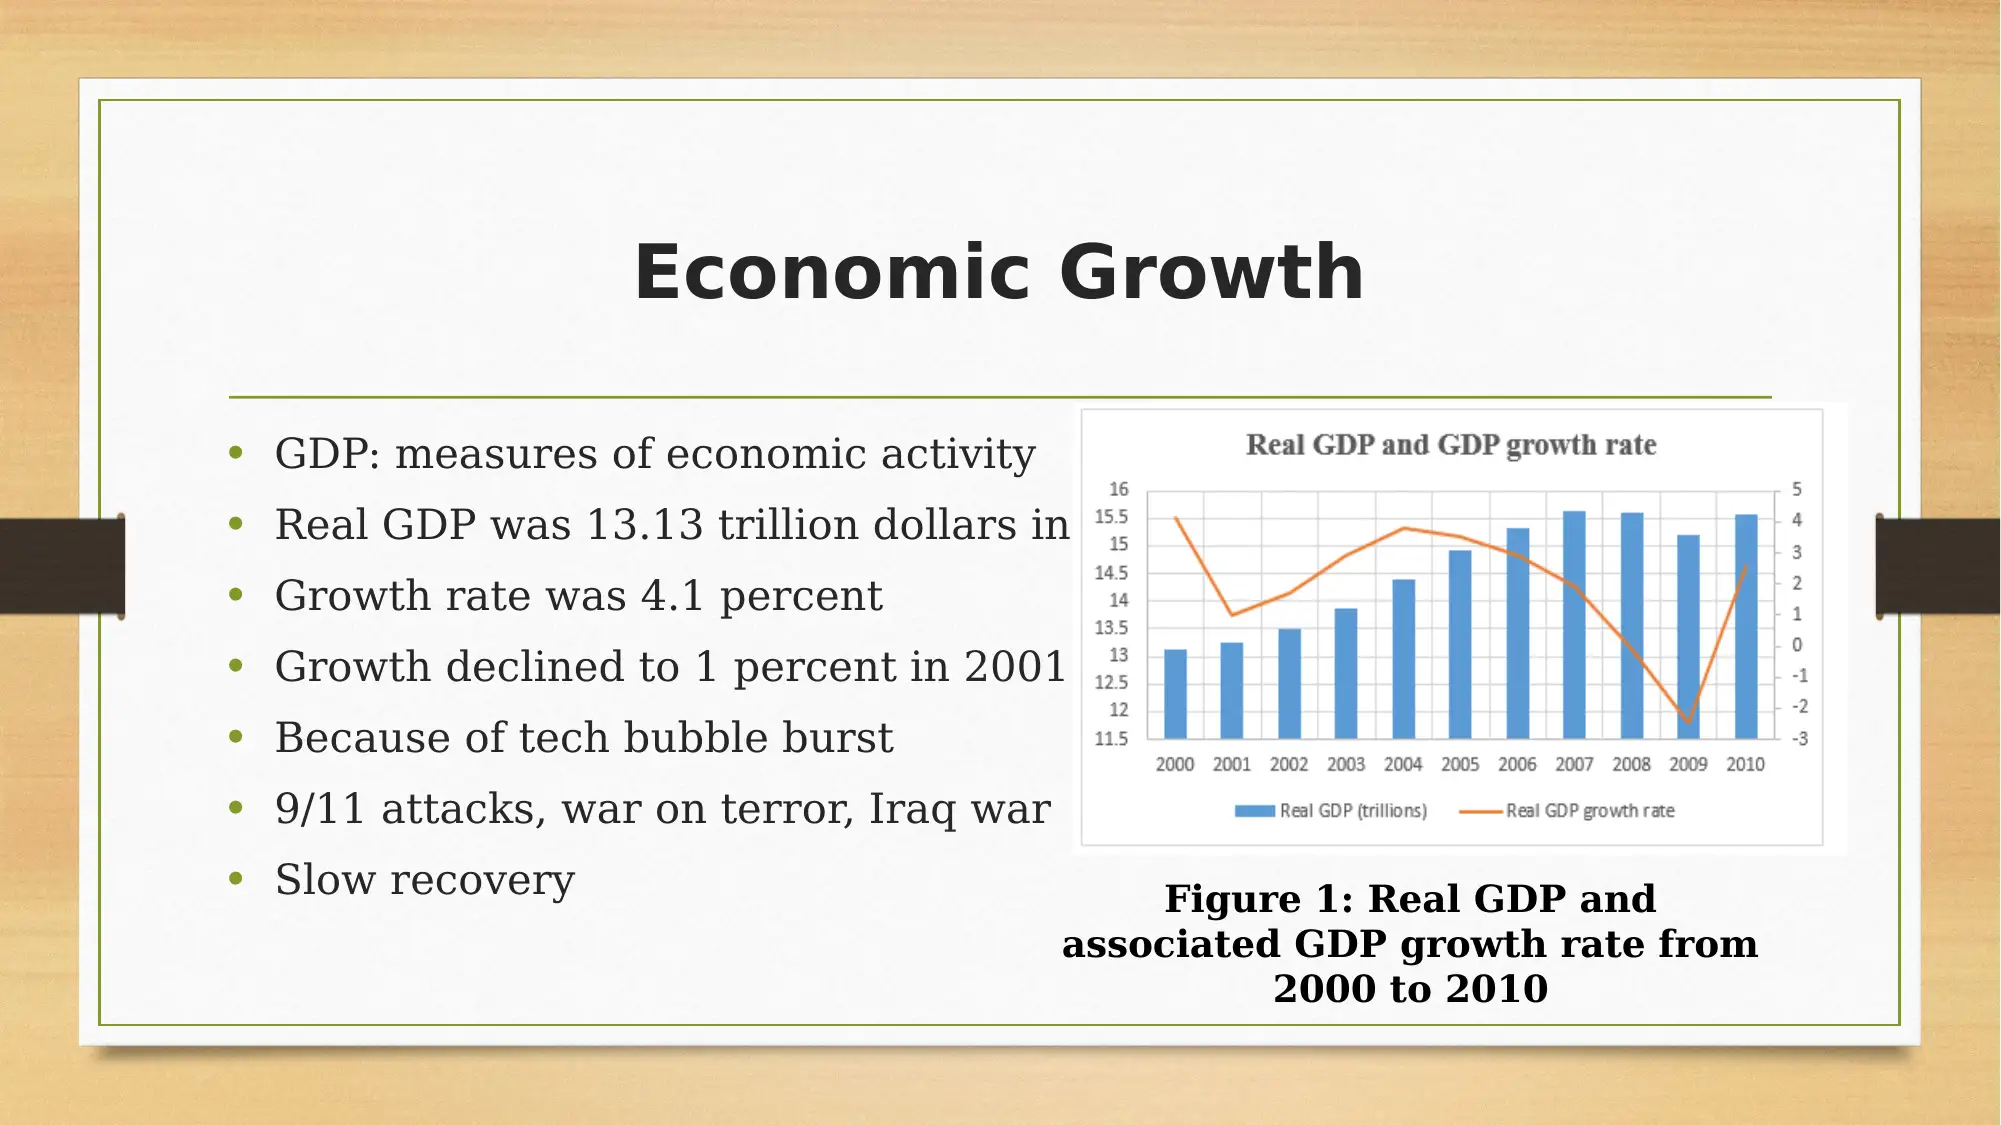
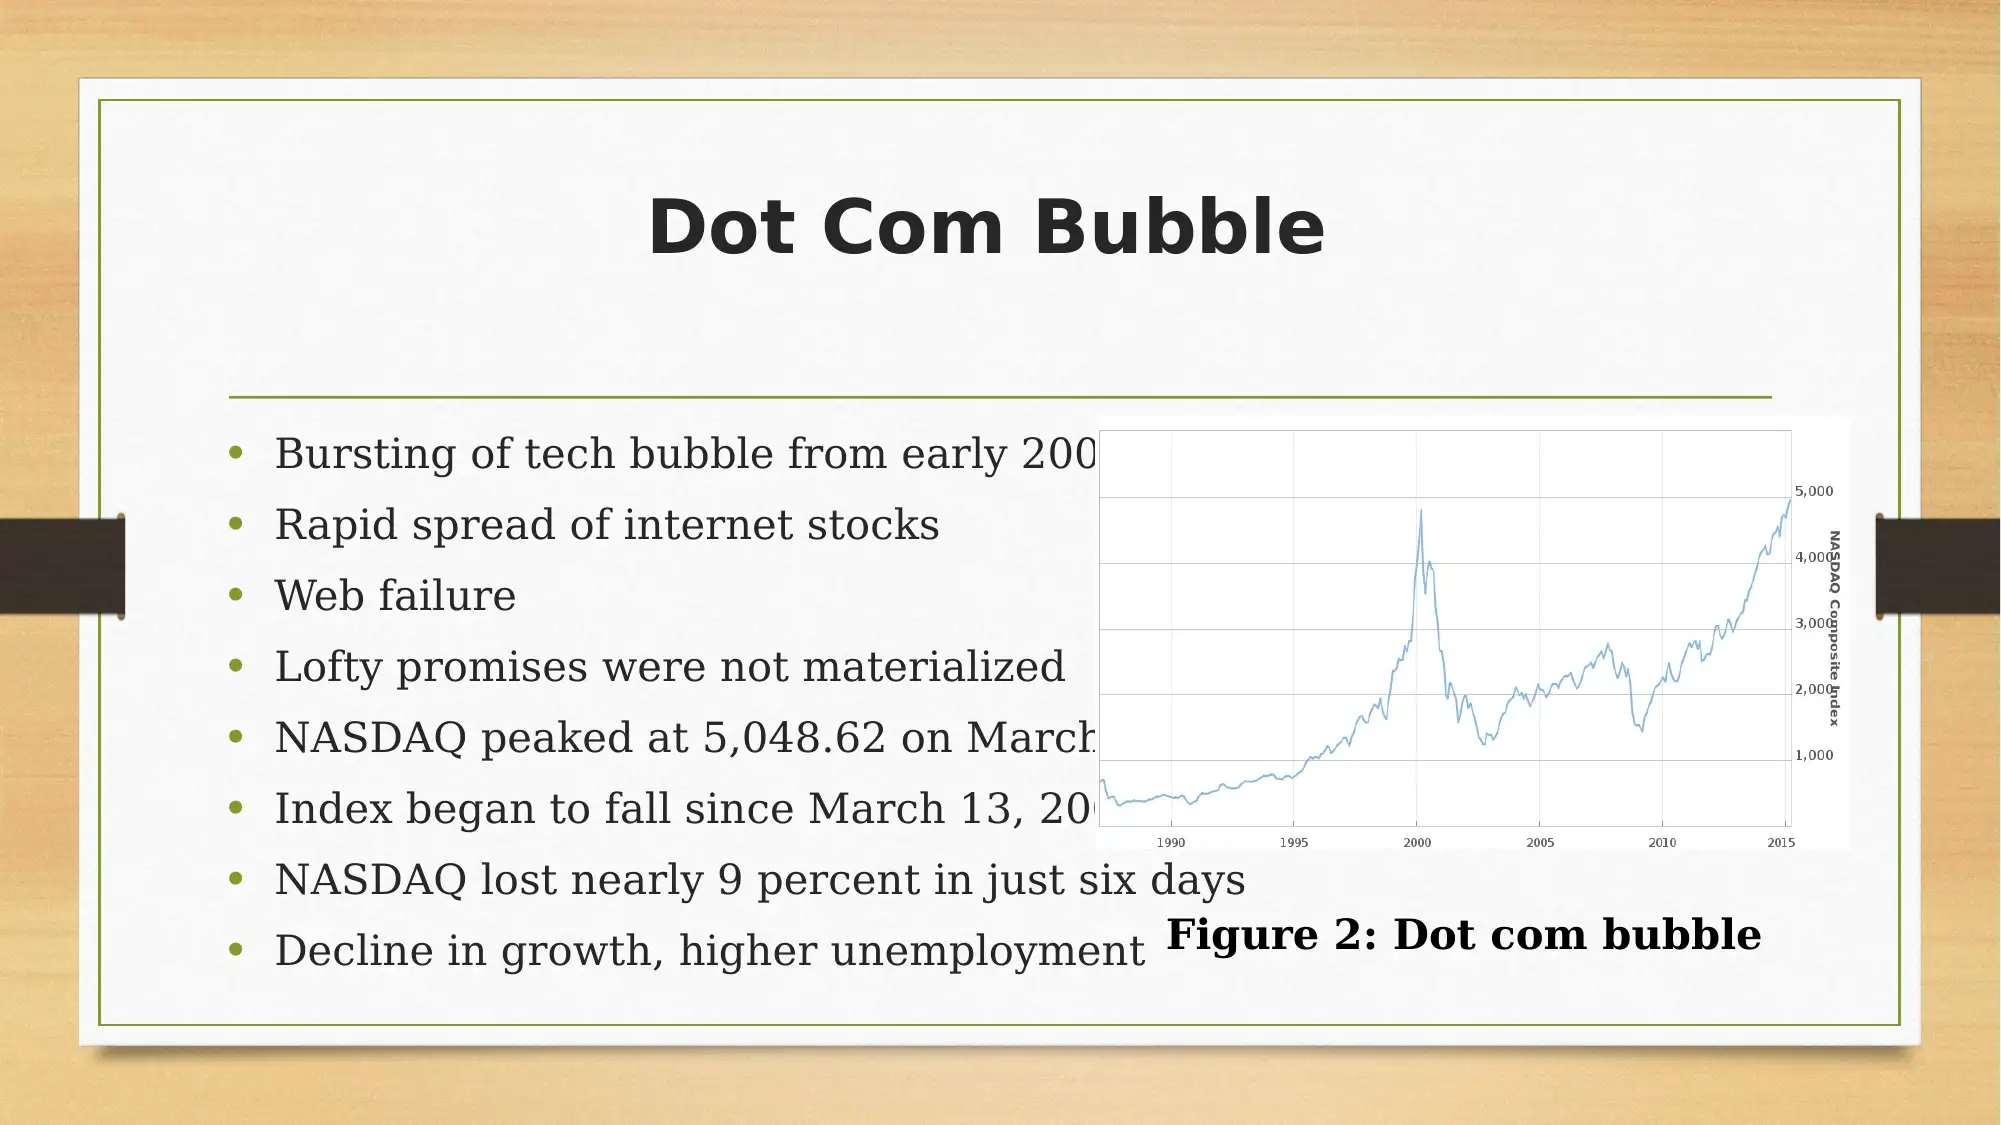
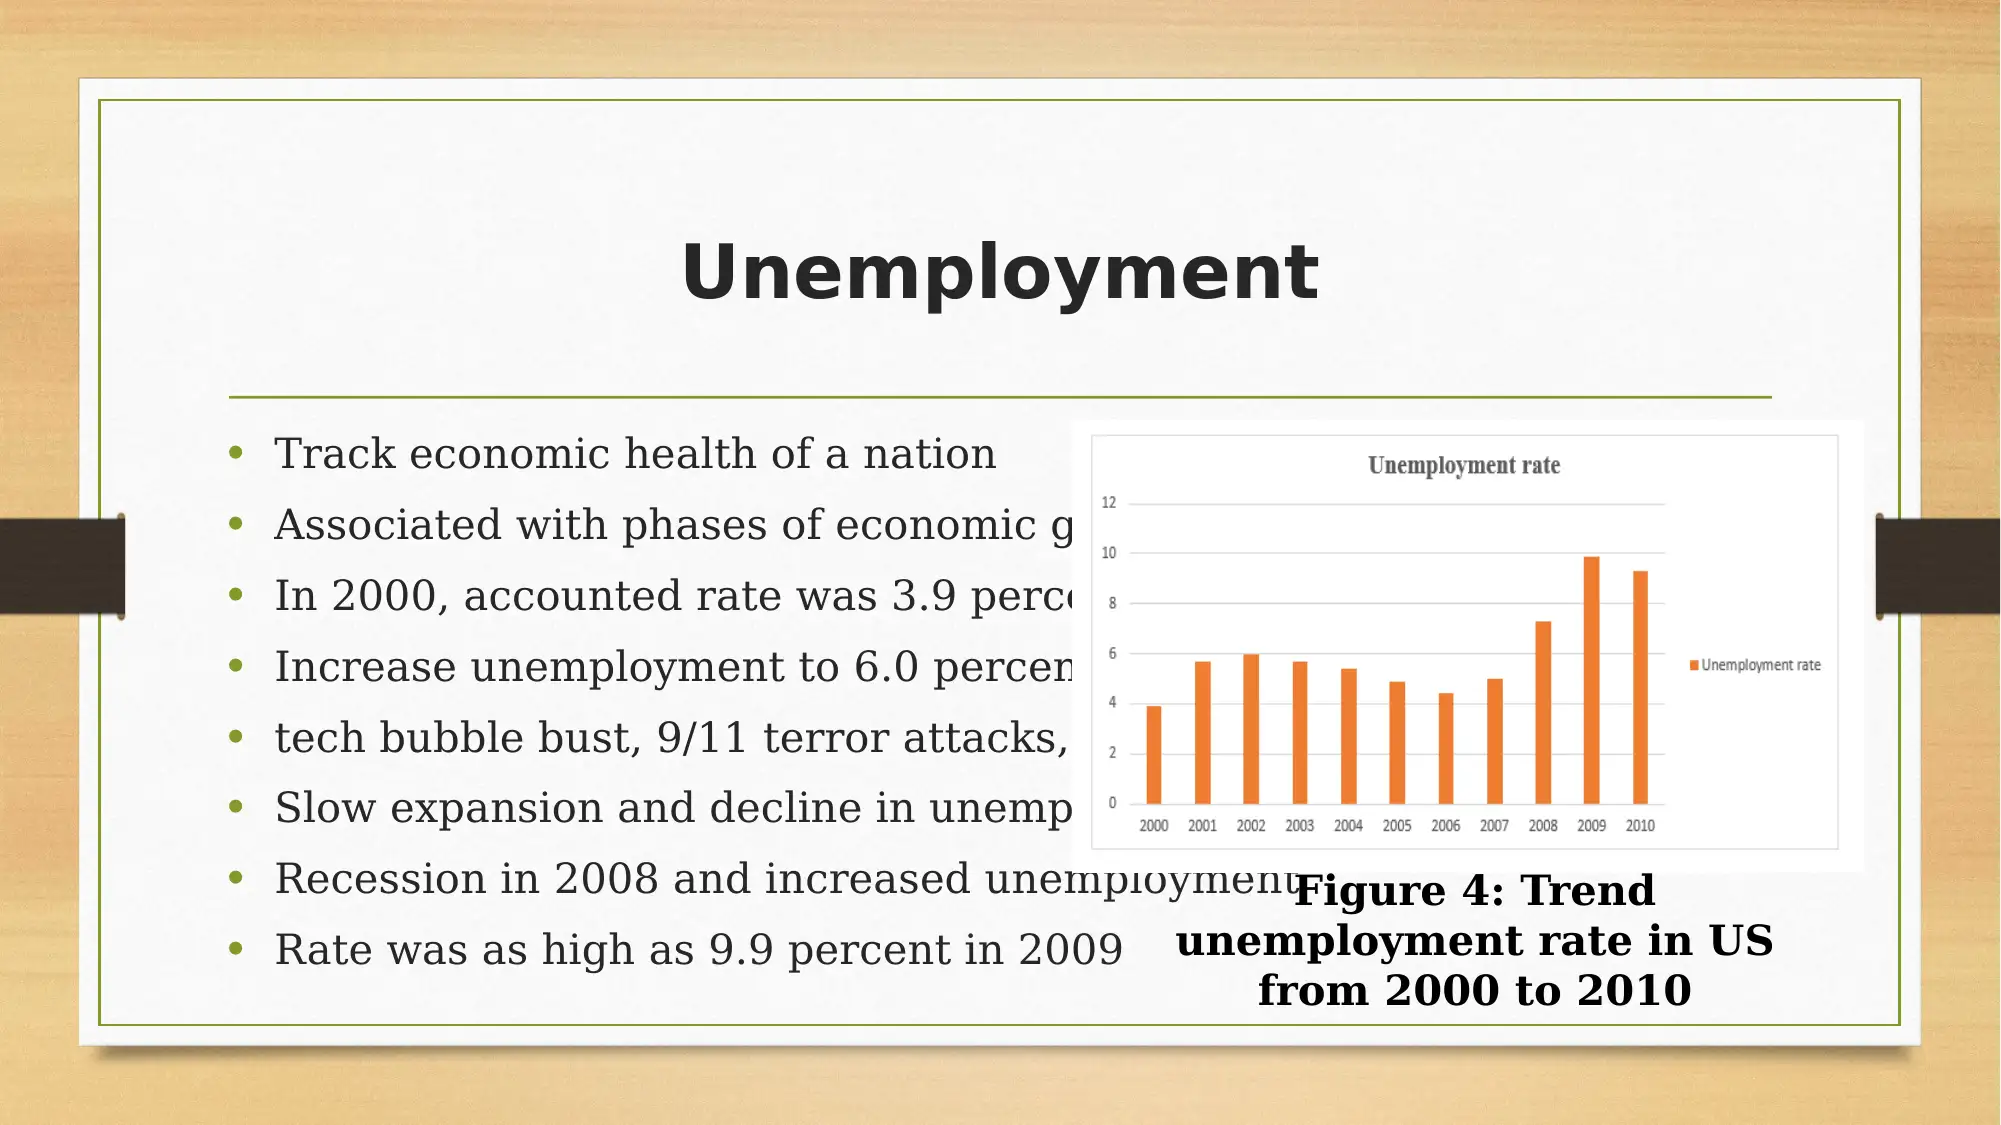
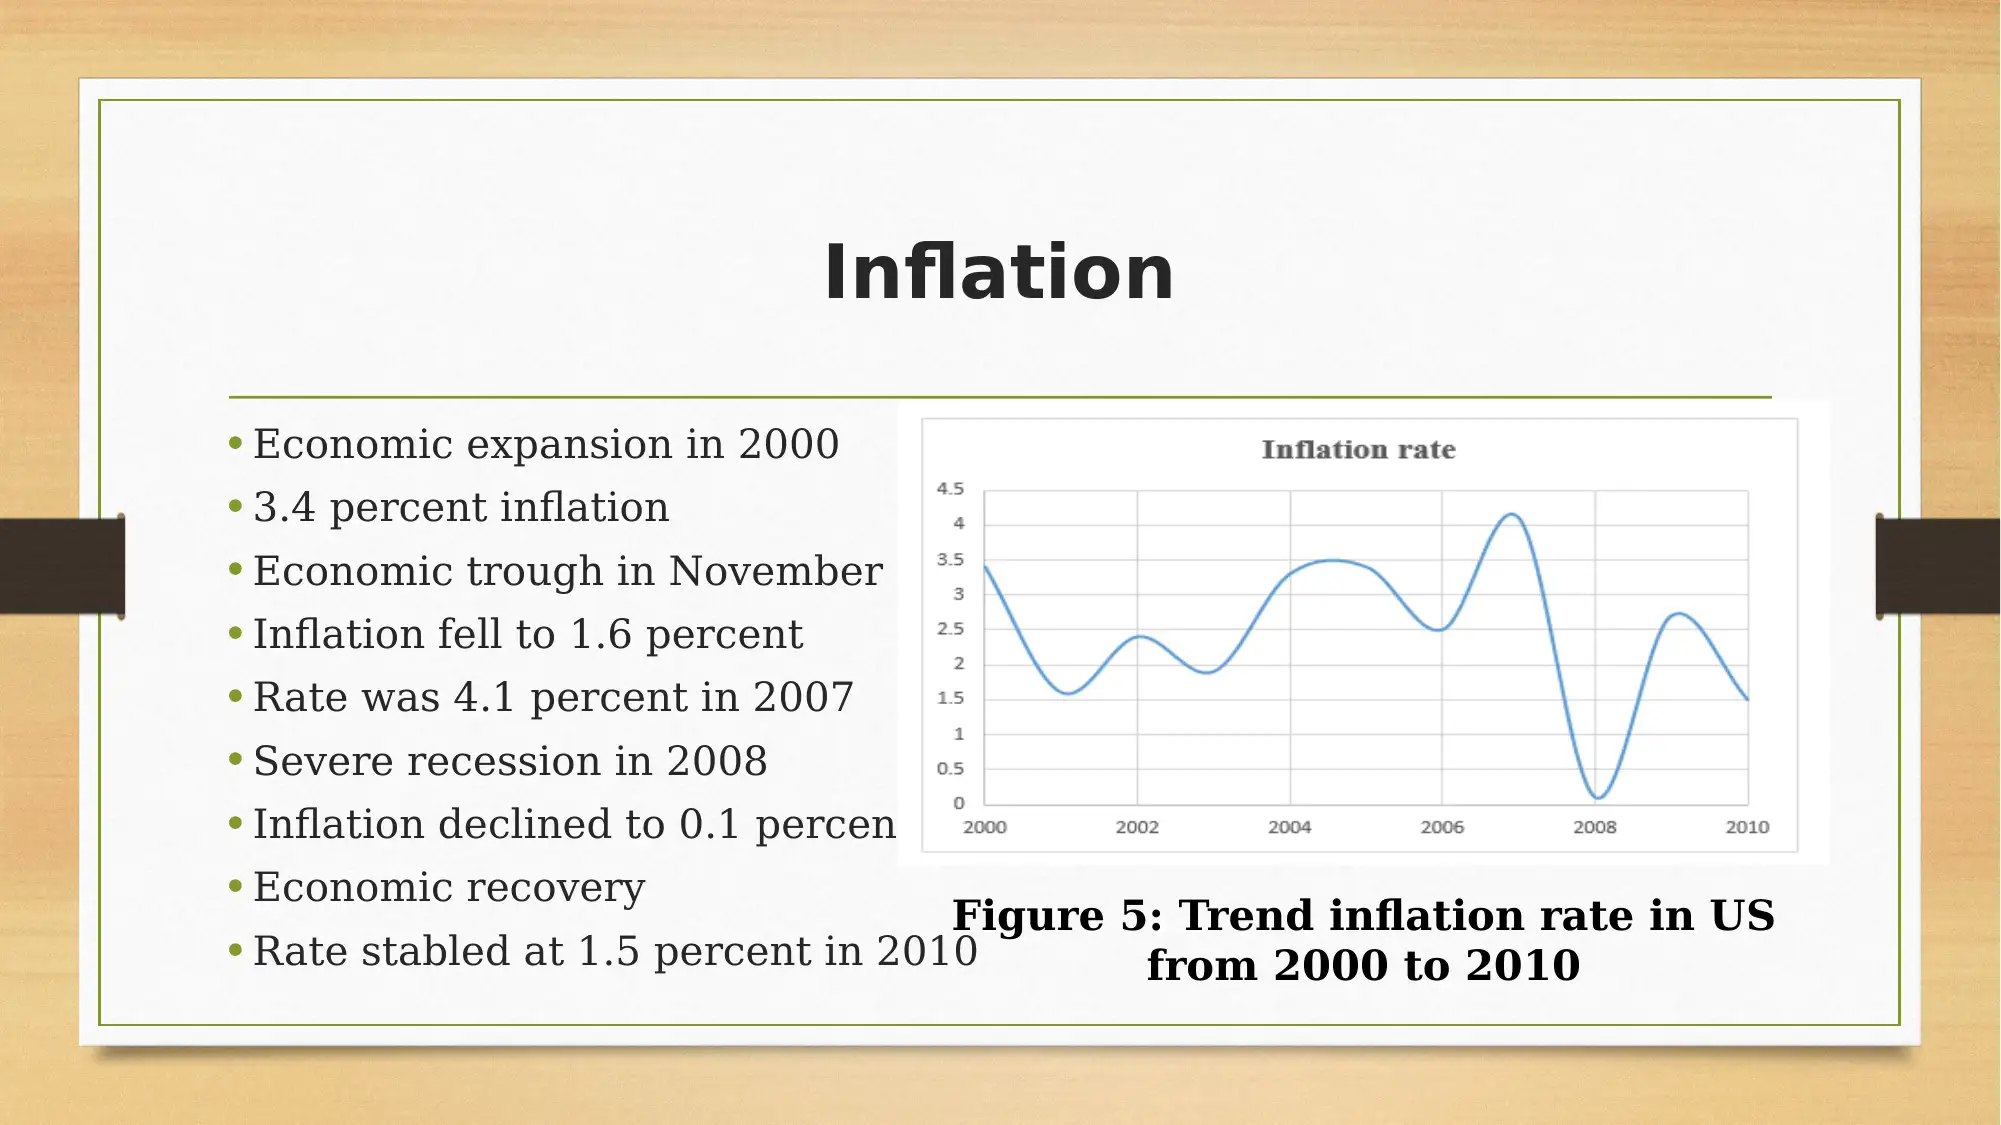
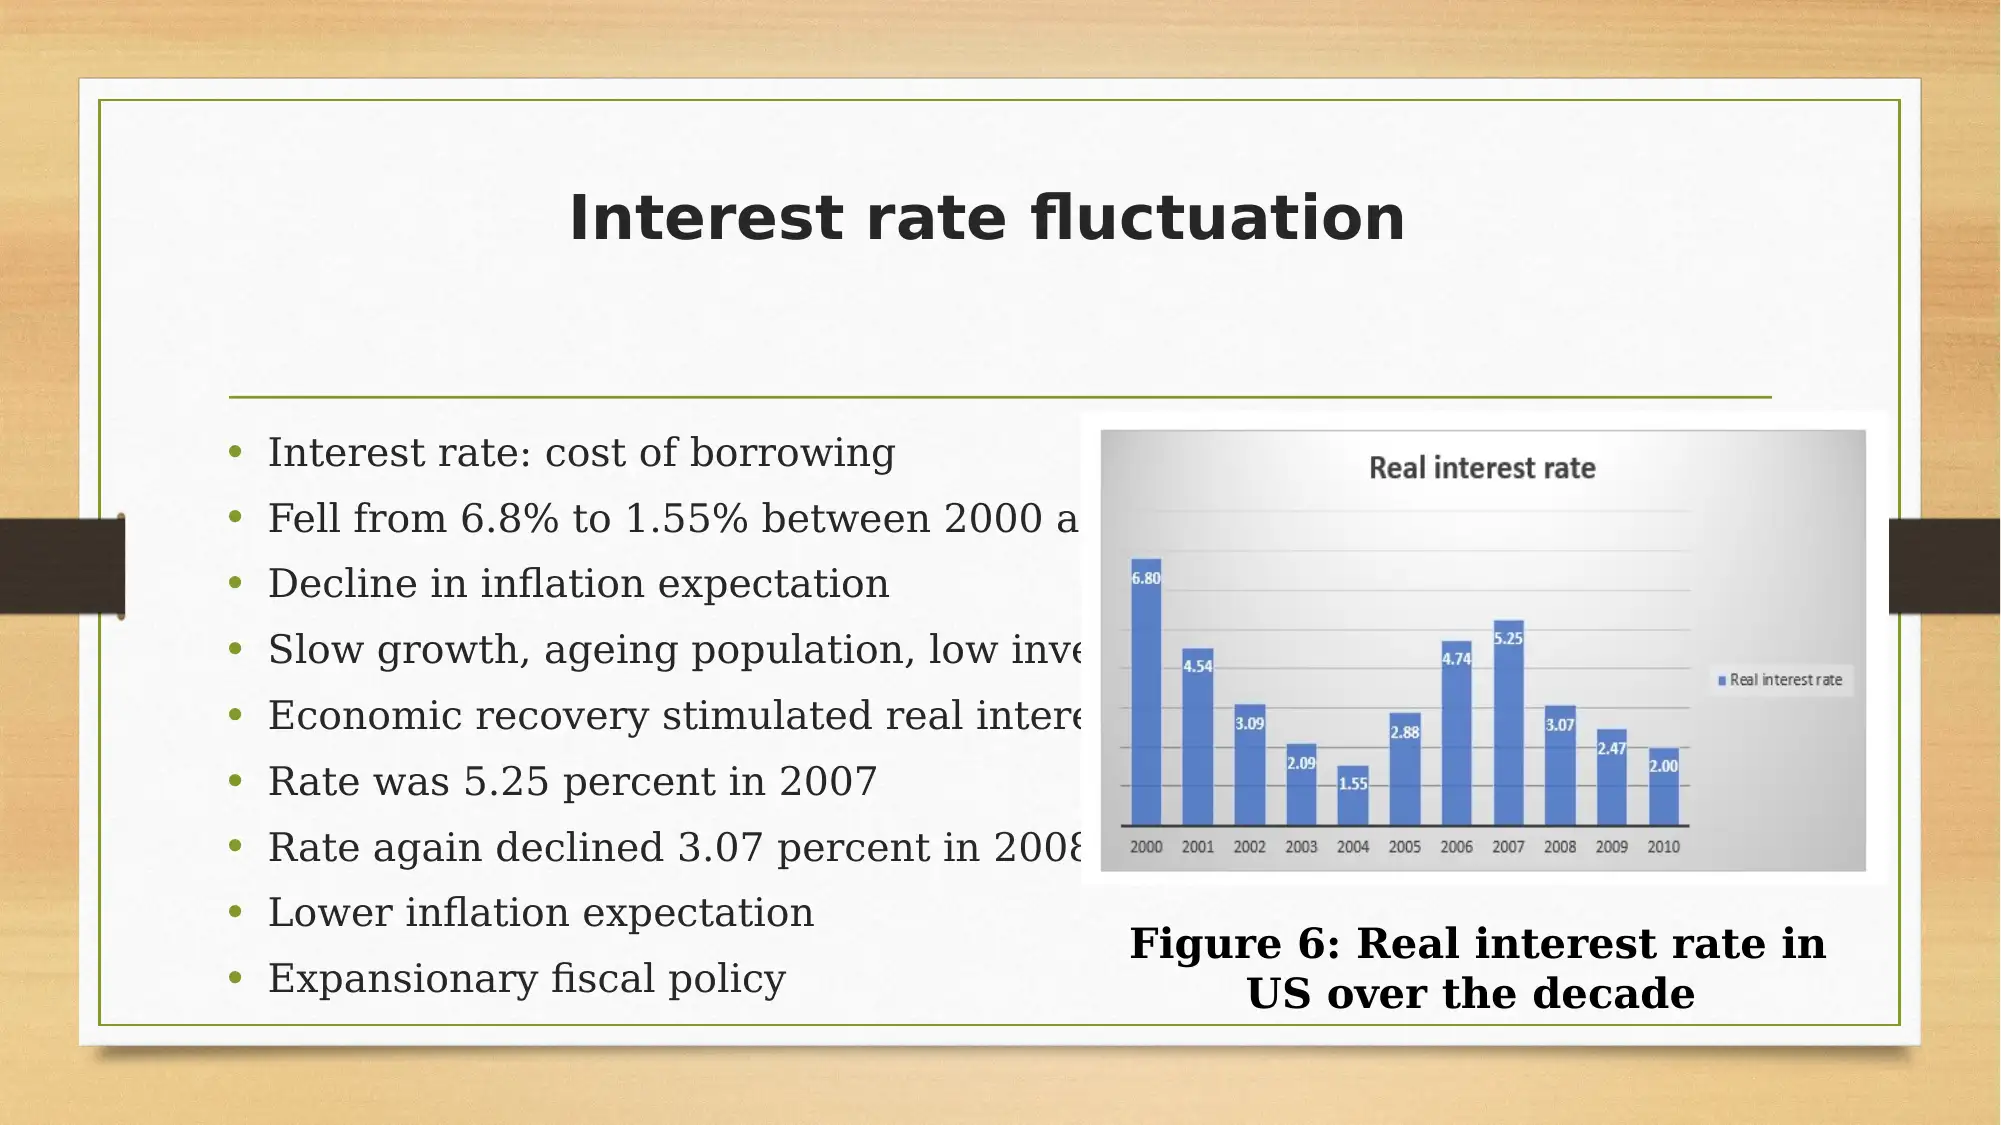
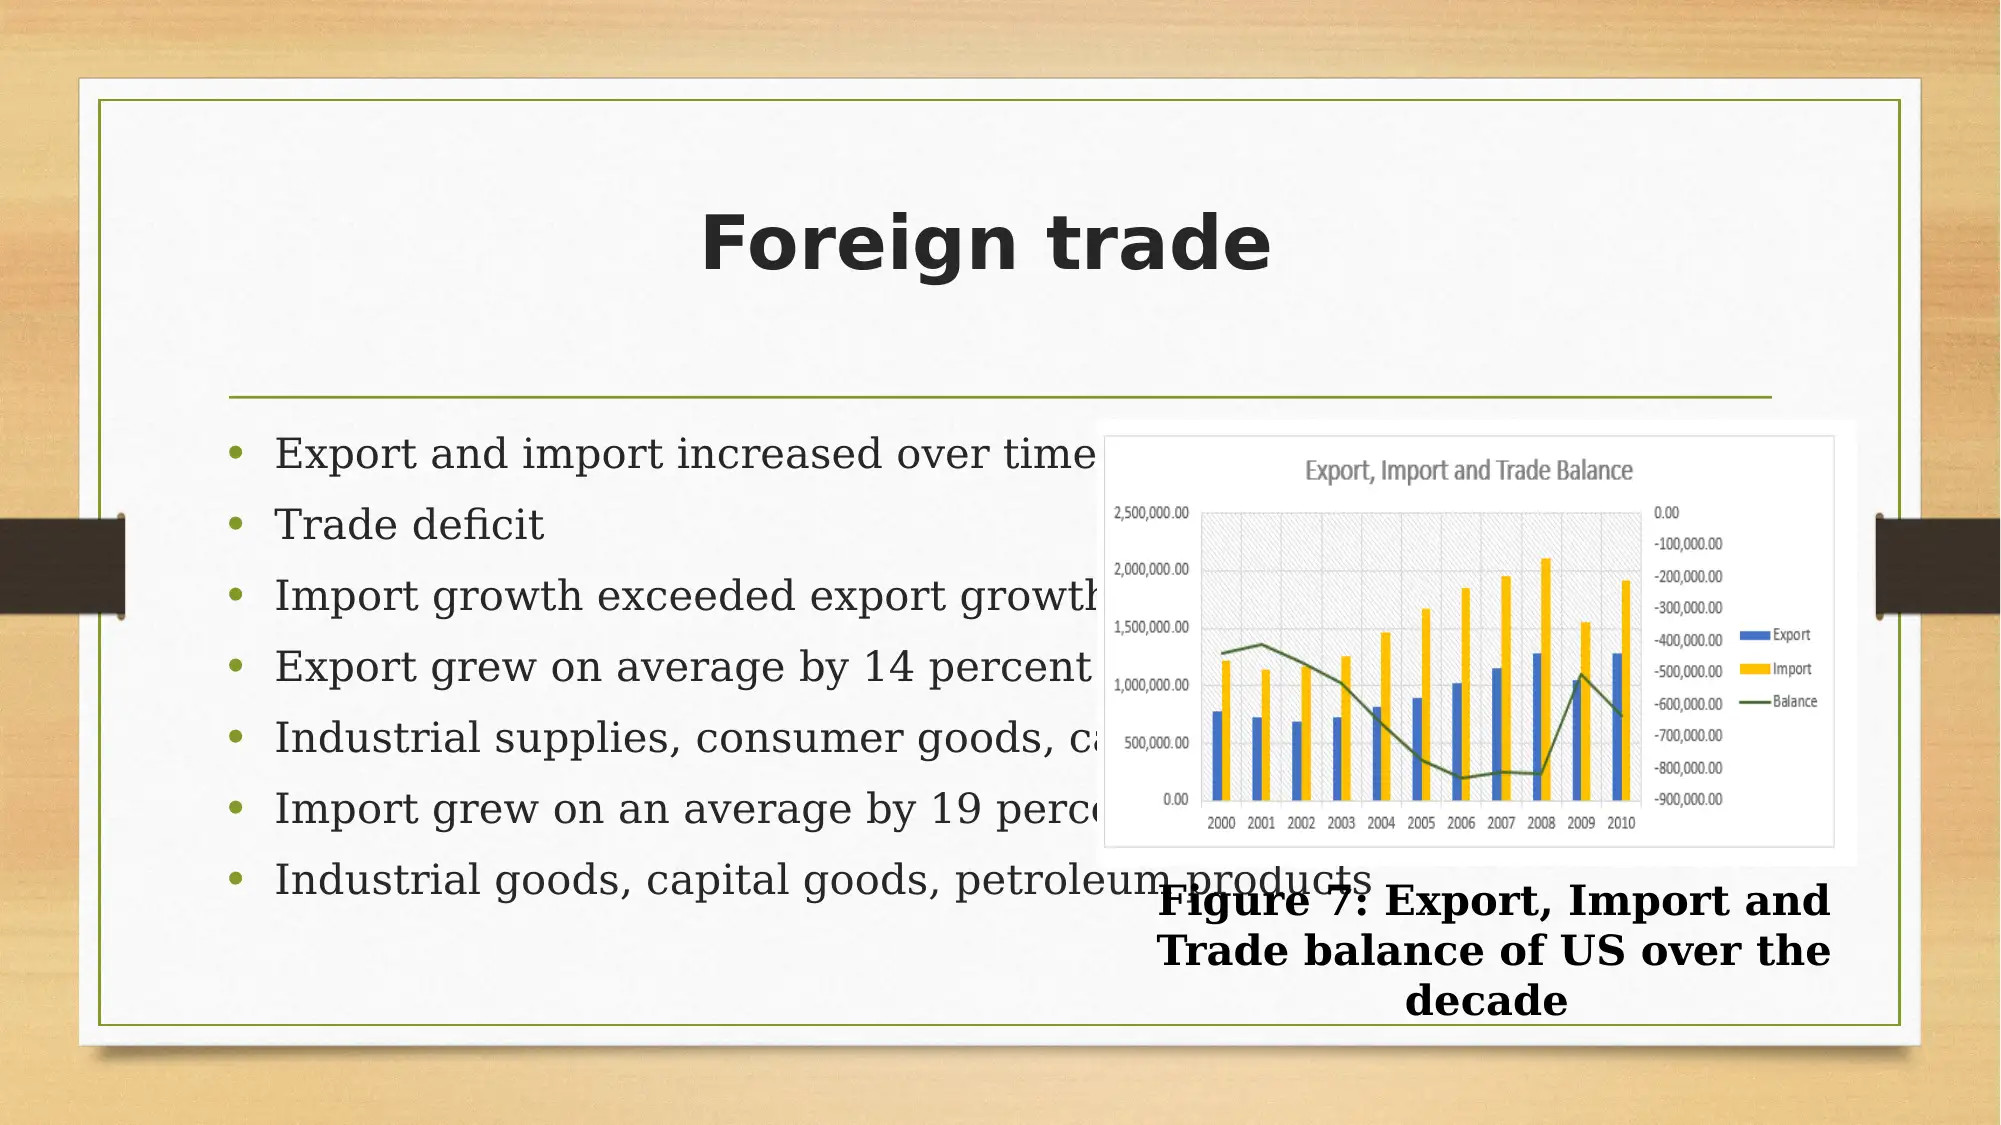
This report provides a comprehensive macroeconomic analysis of the US economy from 2000 to 2010. It examines significant economic events, including the tech bubble burst in 2001 and the housing crisis in 2008, and their impact on economic growth. The analysis covers key indicators such as GDP, unemployment, and inflation, illustrating their trends over the decade. It also explores the fluctuations in interest rates and foreign trade, highlighting the US trade deficit. Furthermore, the report delves into the government's fiscal and monetary policies, detailing measures taken during recessions, such as fiscal stimulus packages and adjustments to interest rates by the Federal Open Market Committee (FOMC). The conclusion summarizes the decade's economic challenges and the resilience demonstrated through policy interventions.
Document Page
Macroeconomics
Name of the Student
Name of the University
Course ID
tabler-icon-diamond-filled.svg

Paraphrase This Document

Need a fresh take? Get an instant paraphrase of this document with our AI Paraphraser
Document Page
Introduction
Series of economic events from 2000 to 2010
Two significant events
Tech bubble bust in 2001
Housing crisis in 2008
Recessions damage the economic growth.
More severe impact than the great depression
Fiscal and monetary policy actions
Document Page
Economic Growth
GDP: measures of economic activity
Real GDP was 13.13 trillion dollars in 2000
Growth rate was 4.1 percent
Growth declined to 1 percent in 2001
Because of tech bubble burst
9/11 attacks, war on terror, Iraq war
Slow recovery Figure 1: Real GDP and
associated GDP growth rate from
2000 to 2010
Document Page
Economic Growth
Growth slightly declined to 3.5 percent in 2005
Hit of Katrine and introduction of Bankruptcy act
Growth further declined to 2.9 percent
Tight monetary policy
Increase in interest rate
Economic downturn since the end of 2007
Financial crisis that fully occurred in 2008
tabler-icon-diamond-filled.svg

Paraphrase This Document

Need a fresh take? Get an instant paraphrase of this document with our AI Paraphraser
Document Page
Dot Com Bubble
Bursting of tech bubble from early 2000 to 2001
Rapid spread of internet stocks
Web failure
Lofty promises were not materialized
NASDAQ peaked at 5,048.62 on March 10, 2000
Index began to fall since March 13, 2000
NASDAQ lost nearly 9 percent in just six days
Decline in growth, higher unemployment Figure 2: Dot com bubble
Document Page
Housing Bubble
Housing bubble was related to real estate market
Housing price peaked in 2006
Then started to decline
Case-Shiller home price index recorded the largest drop
Severe recession from 2007 to 2009
Economy wide impact
Decline in growth and investment
Millions of people to lost their jobs Figure 3: Case Shiller Index
and housing market crisis
Document Page
Unemployment
Track economic health of a nation
Associated with phases of economic growth
In 2000, accounted rate was 3.9 percent
Increase unemployment to 6.0 percent in 2002
tech bubble bust, 9/11 terror attacks, war on terror
Slow expansion and decline in unemployment
Recession in 2008 and increased unemployment
Rate was as high as 9.9 percent in 2009
Figure 4: Trend
unemployment rate in US
from 2000 to 2010
tabler-icon-diamond-filled.svg

Paraphrase This Document

Need a fresh take? Get an instant paraphrase of this document with our AI Paraphraser
Document Page
Inflation
Economic expansion in 2000
3.4 percent inflation
Economic trough in November 2001
Inflation fell to 1.6 percent
Rate was 4.1 percent in 2007
Severe recession in 2008
Inflation declined to 0.1 percent
Economic recovery
Rate stabled at 1.5 percent in 2010
Figure 5: Trend inflation rate in US
from 2000 to 2010
Document Page
Interest rate fluctuation
Interest rate: cost of borrowing
Fell from 6.8% to 1.55% between 2000 and 2004
Decline in inflation expectation
Slow growth, ageing population, low investment
Economic recovery stimulated real interest rate
Rate was 5.25 percent in 2007
Rate again declined 3.07 percent in 2008
Lower inflation expectation
Expansionary fiscal policy Figure 6: Real interest rate in
US over the decade
Document Page
Foreign trade
Export and import increased over time
Trade deficit
Import growth exceeded export growth
Export grew on average by 14 percent
Industrial supplies, consumer goods, capital goods
Import grew on an average by 19 percent
Industrial goods, capital goods, petroleum productsFigure 7: Export, Import and
Trade balance of US over the
decade
tabler-icon-diamond-filled.svg

Paraphrase This Document

Need a fresh take? Get an instant paraphrase of this document with our AI Paraphraser
Document Page
Government Policies
Government plays a crucial role in the economy
Two main policy instruments
Fiscal policy and Monetary policy ‘
Fiscal policy: Adjustment through government spending and tax
Monetary Policy: Adjustment through money supply and interest
Federal Open Market Committee (FOMC): acting committee that
control Fed’s open market transaction
FOMC takes decision related to money supply and interest rate.
Document Page
Fiscal Policy
Active fiscal policy measures during recession in 2001
Accounted half of the budgetary spending
Bursting of tech bubble
Attack on September 11 and ongoing war on terrorism
Spending on the defense and homeland security
Economic Growth and Tax Relief Reconciliation Act of 2001
Introduced Job Creation and Worker Assistance Act (JCWAA) of 2002
chevron_up_icon
1 out of 20
circle_padding
hide_on_mobile
zoom_out_icon
[object Object]