University Name: ITECH1103 US Health Department Data Analysis Report

Verified

Added on  2022/11/07

|22
|3364
|247
Report
AI Summary
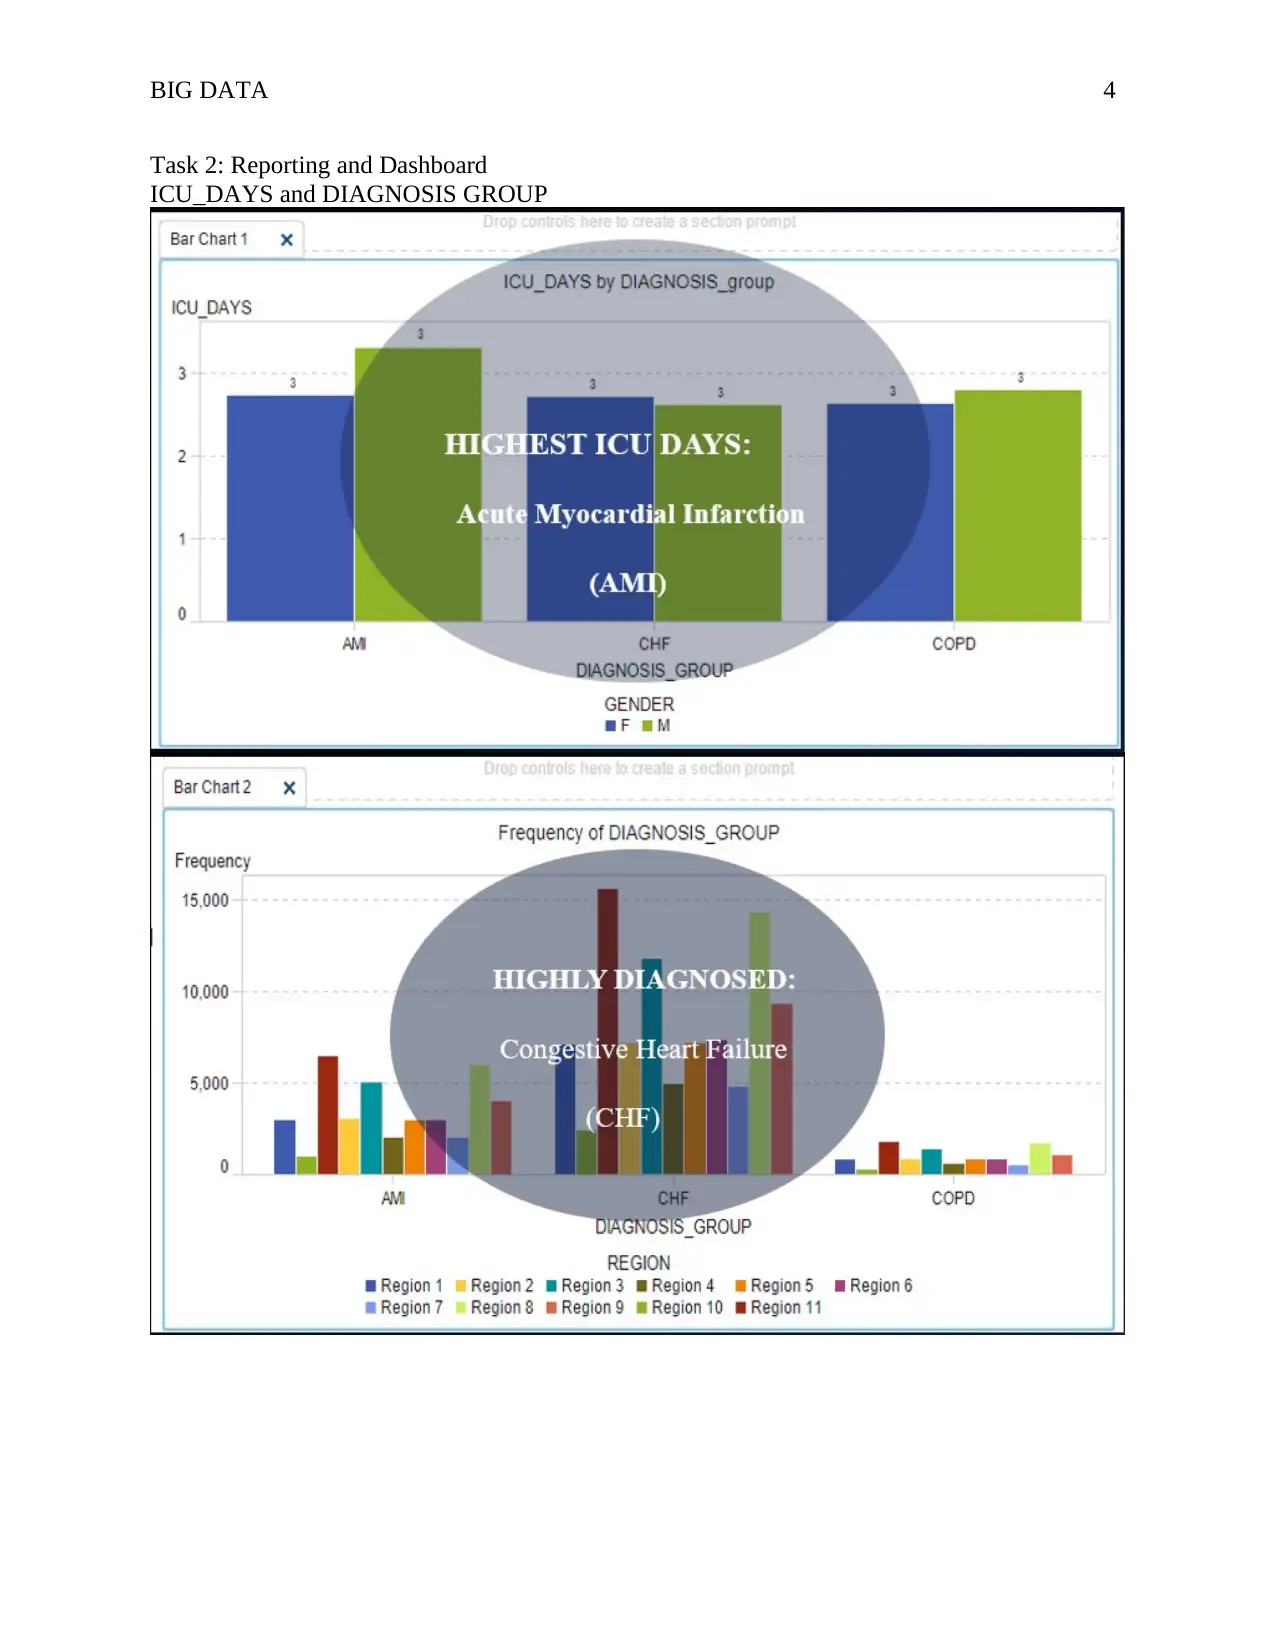
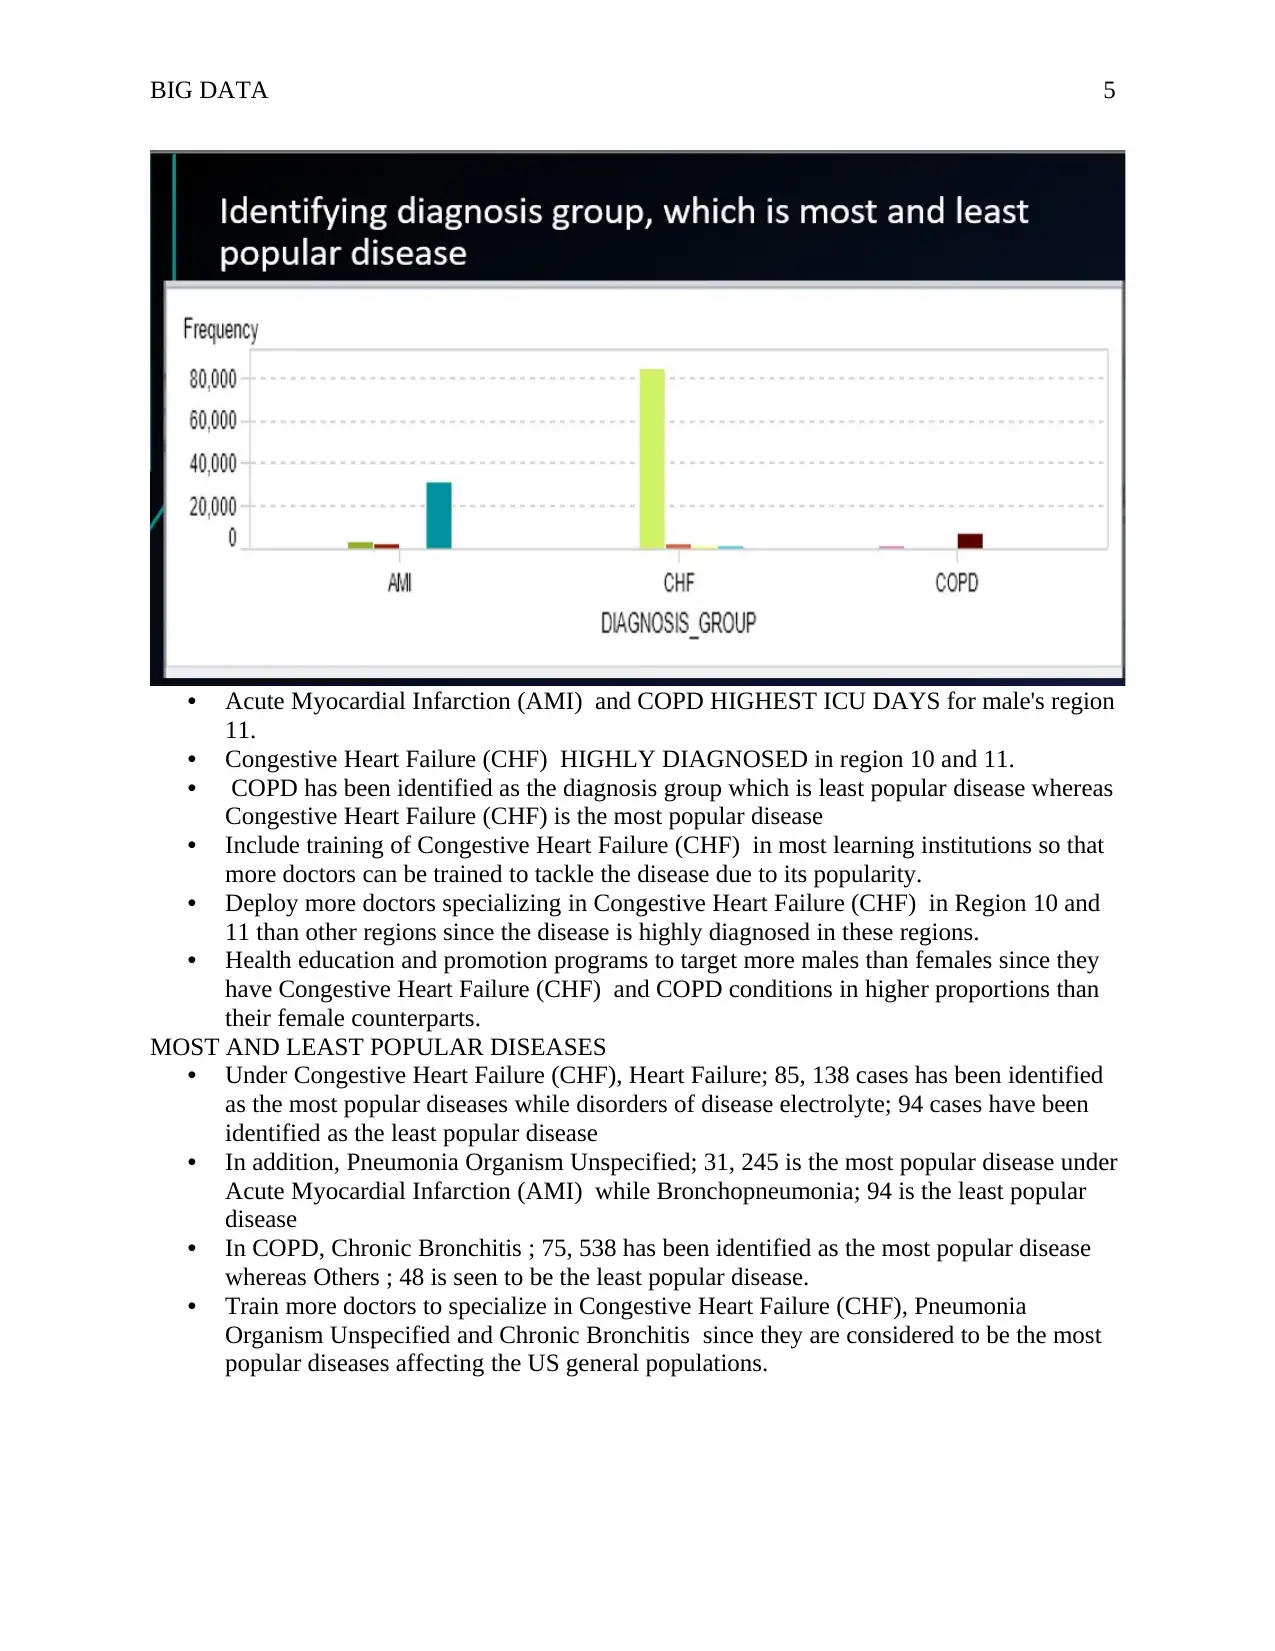
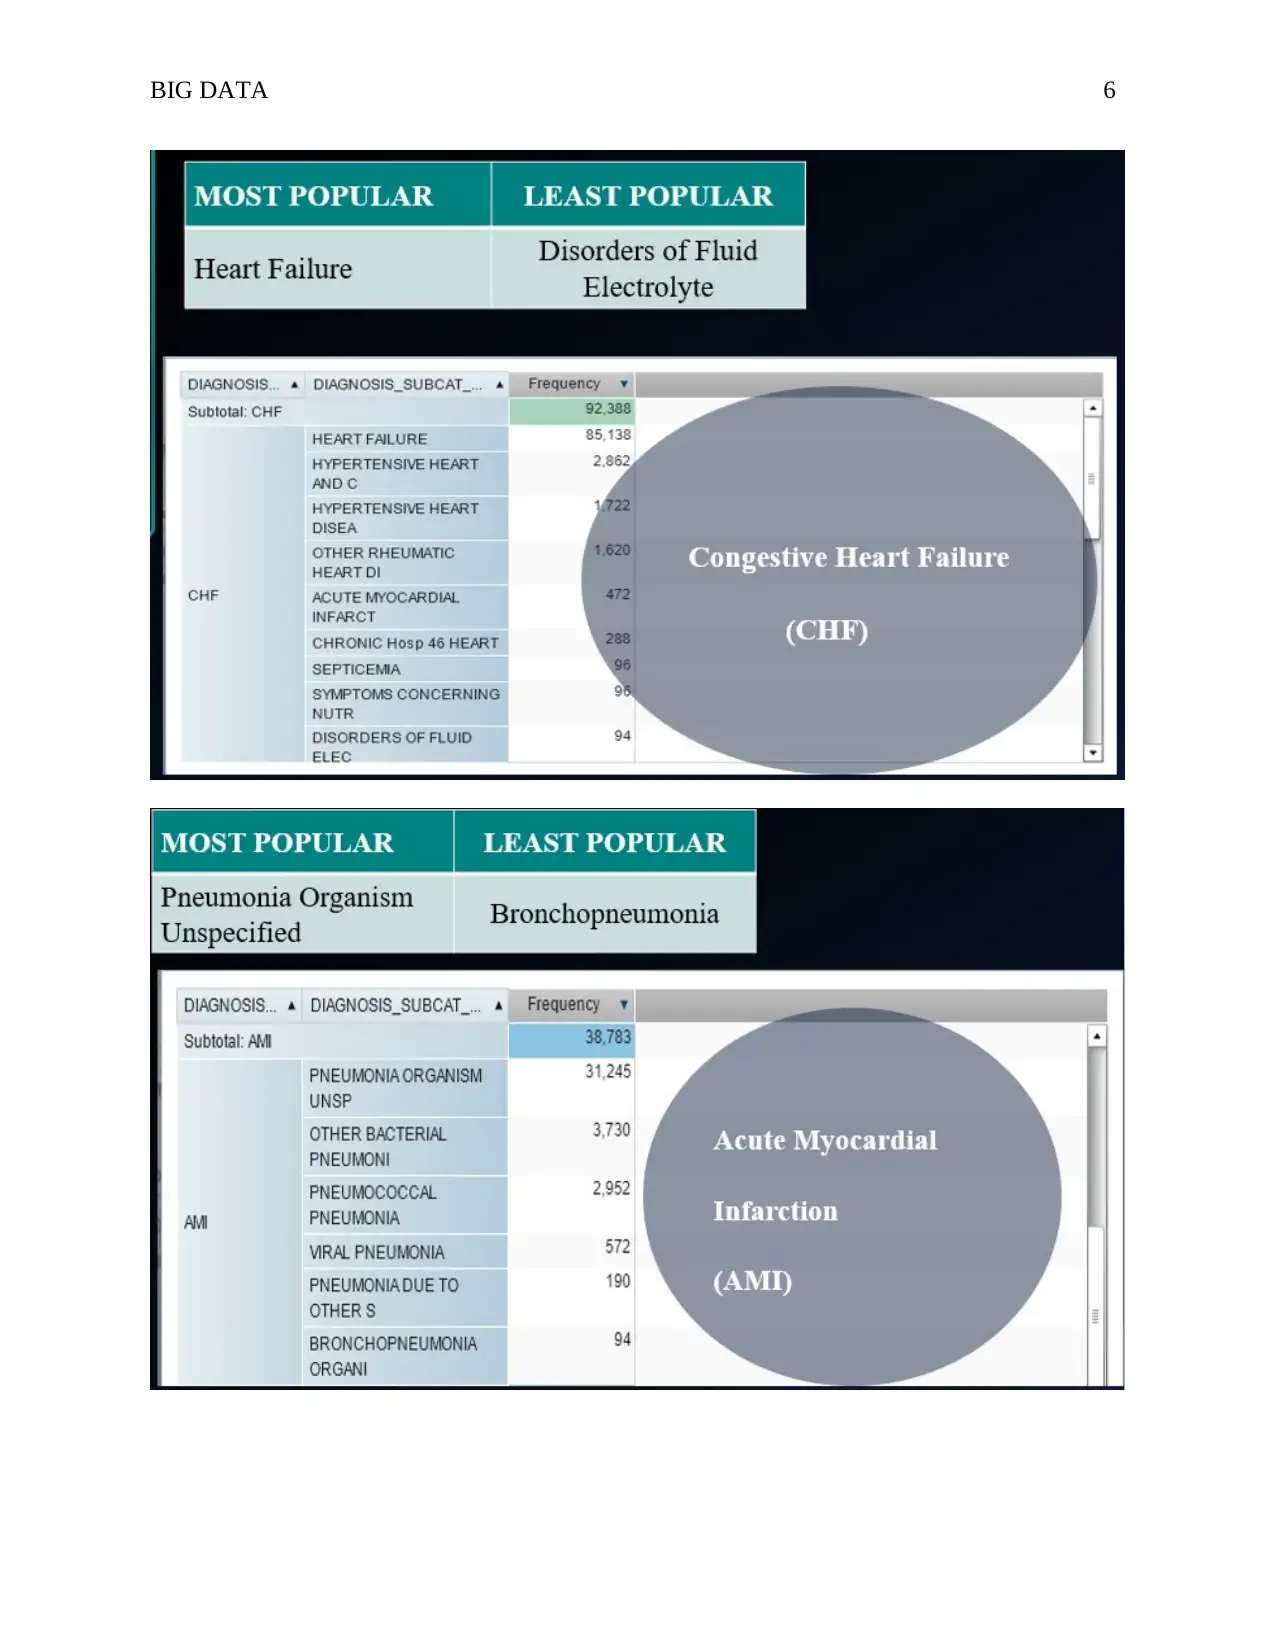
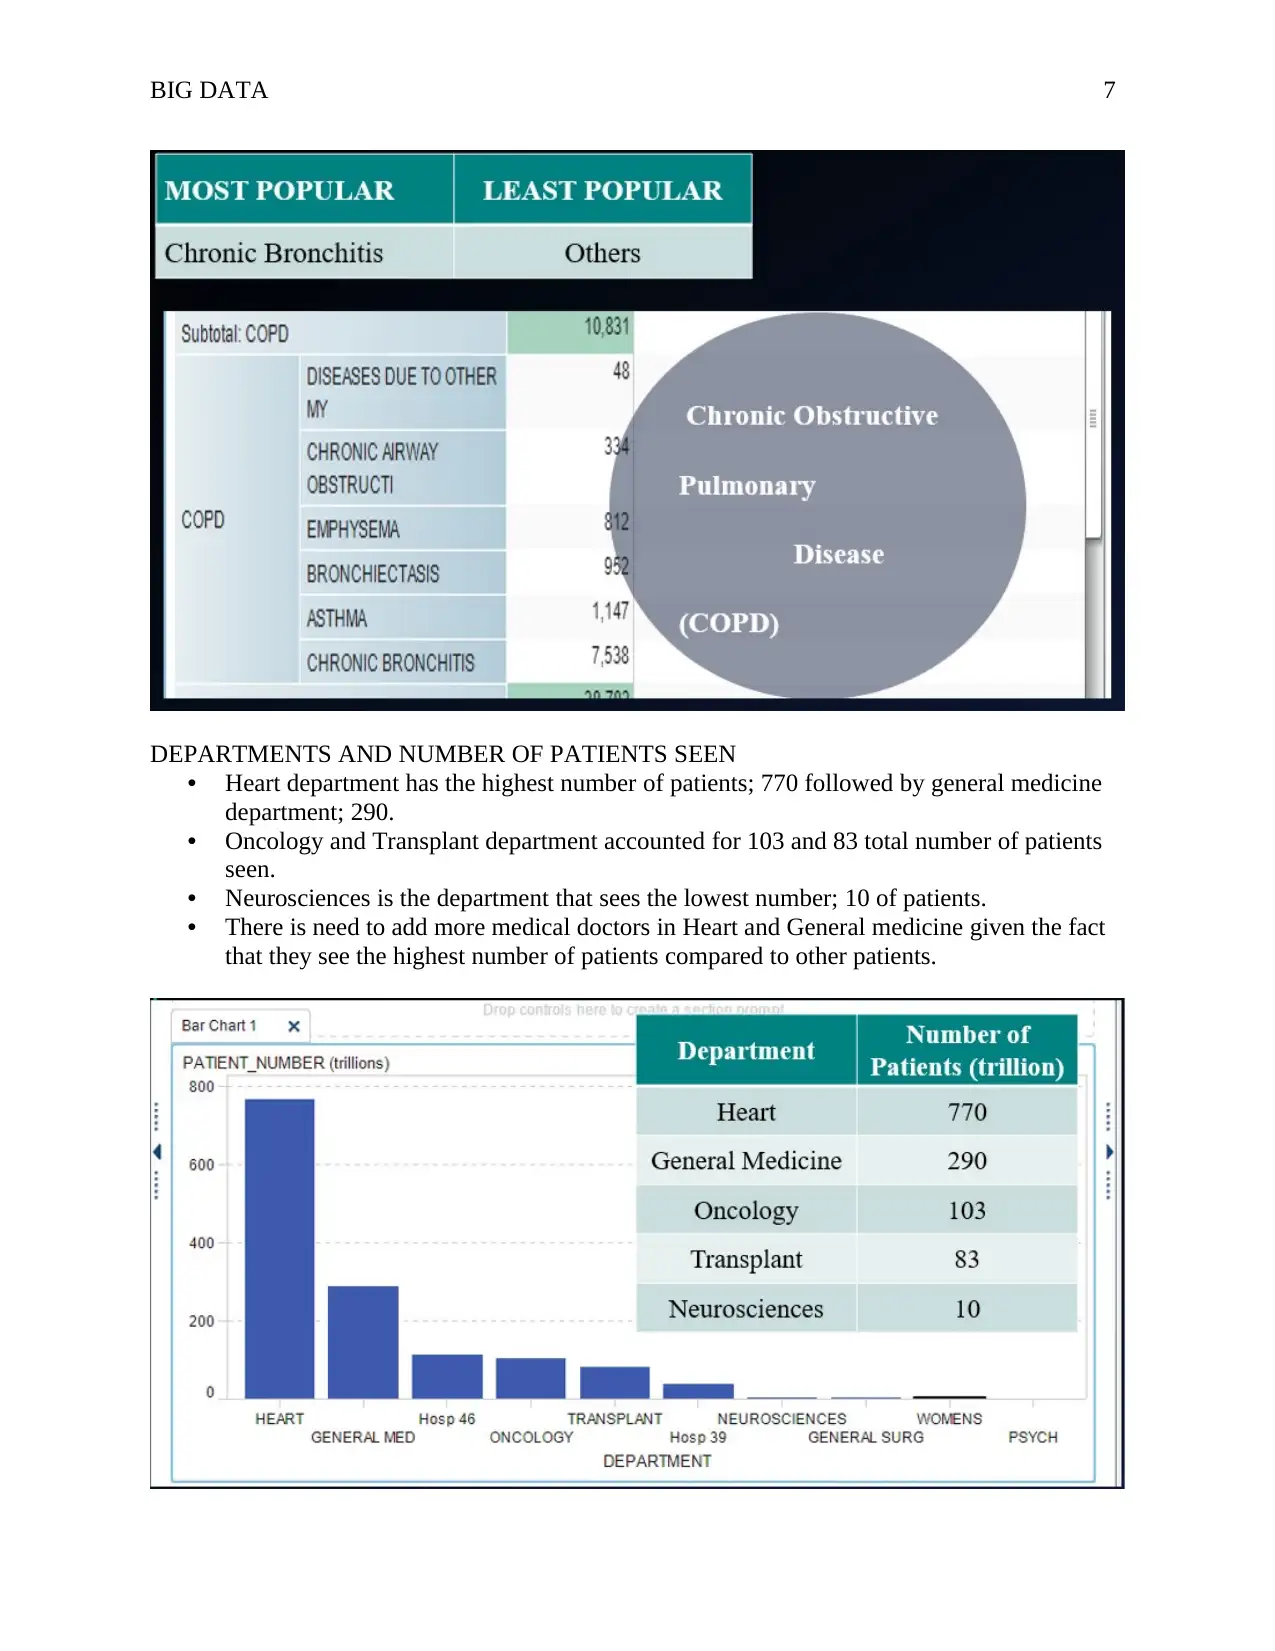
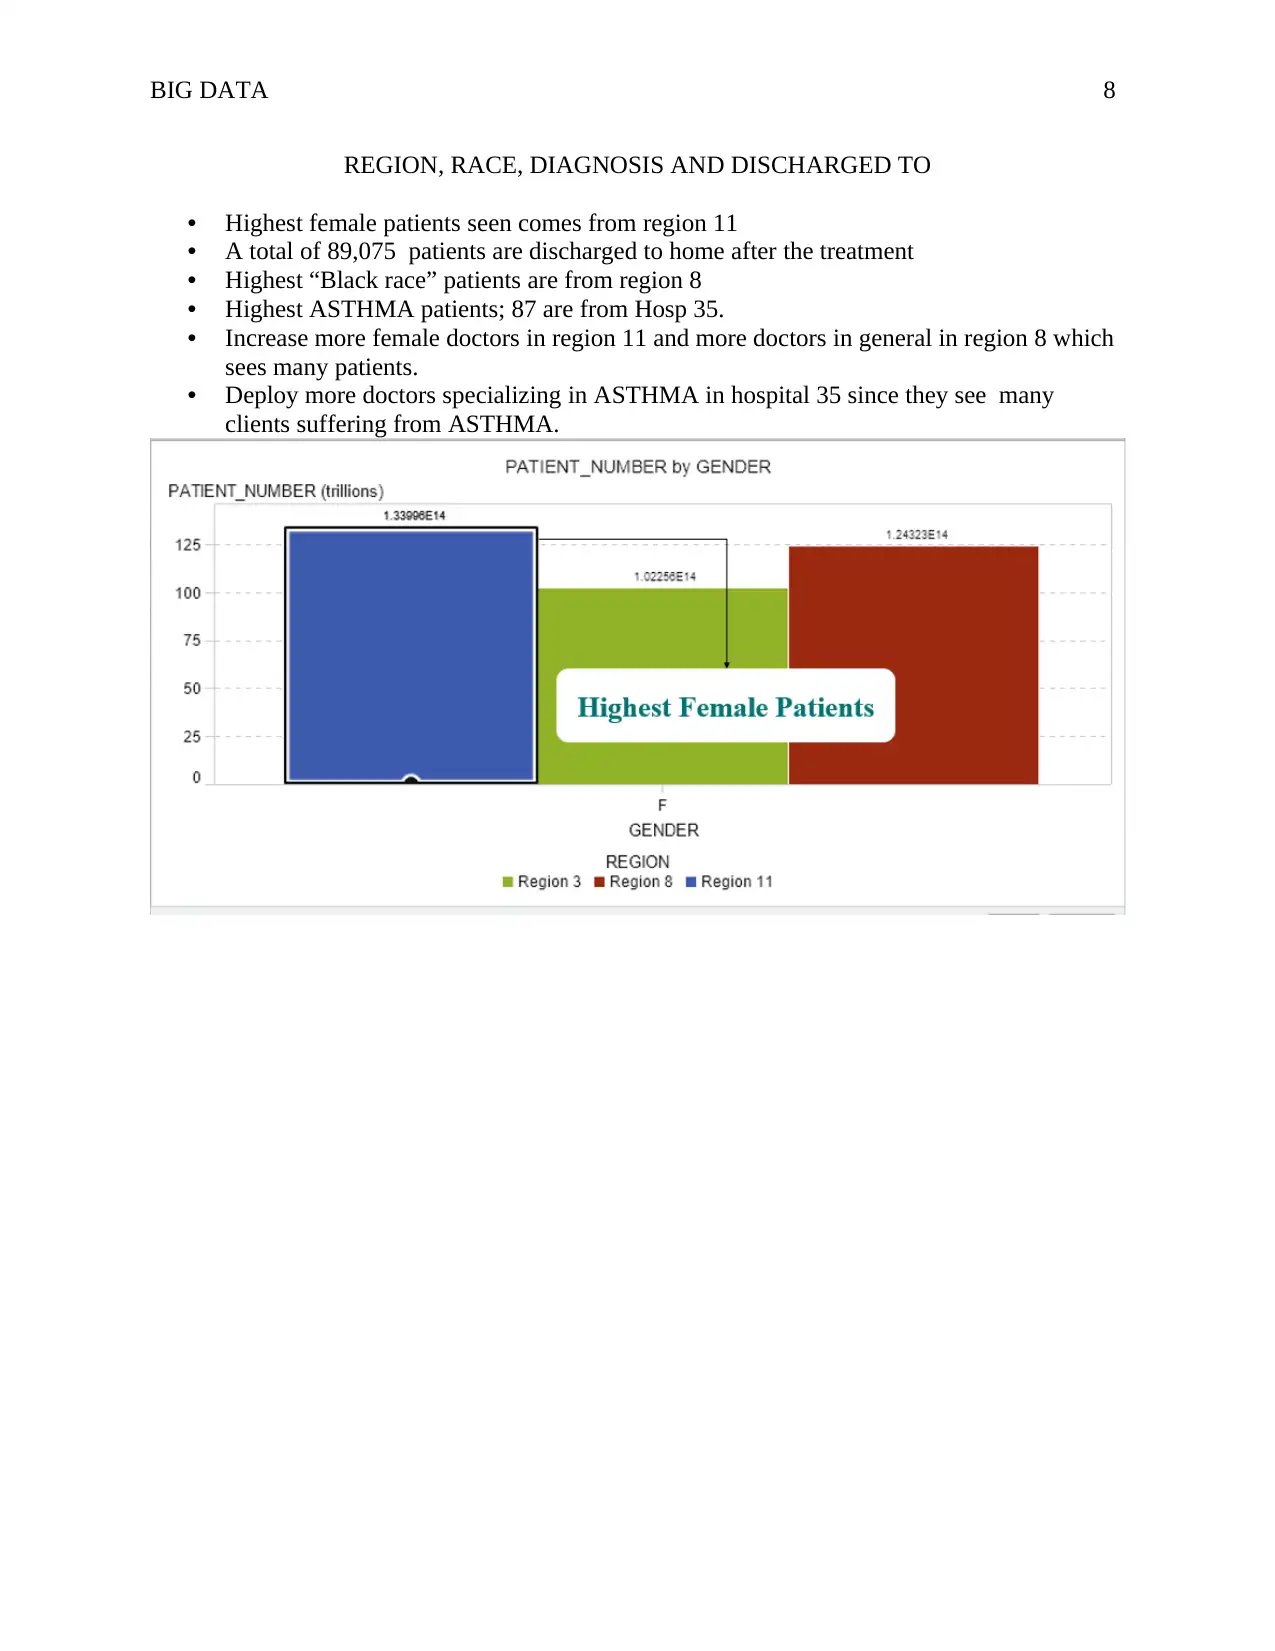
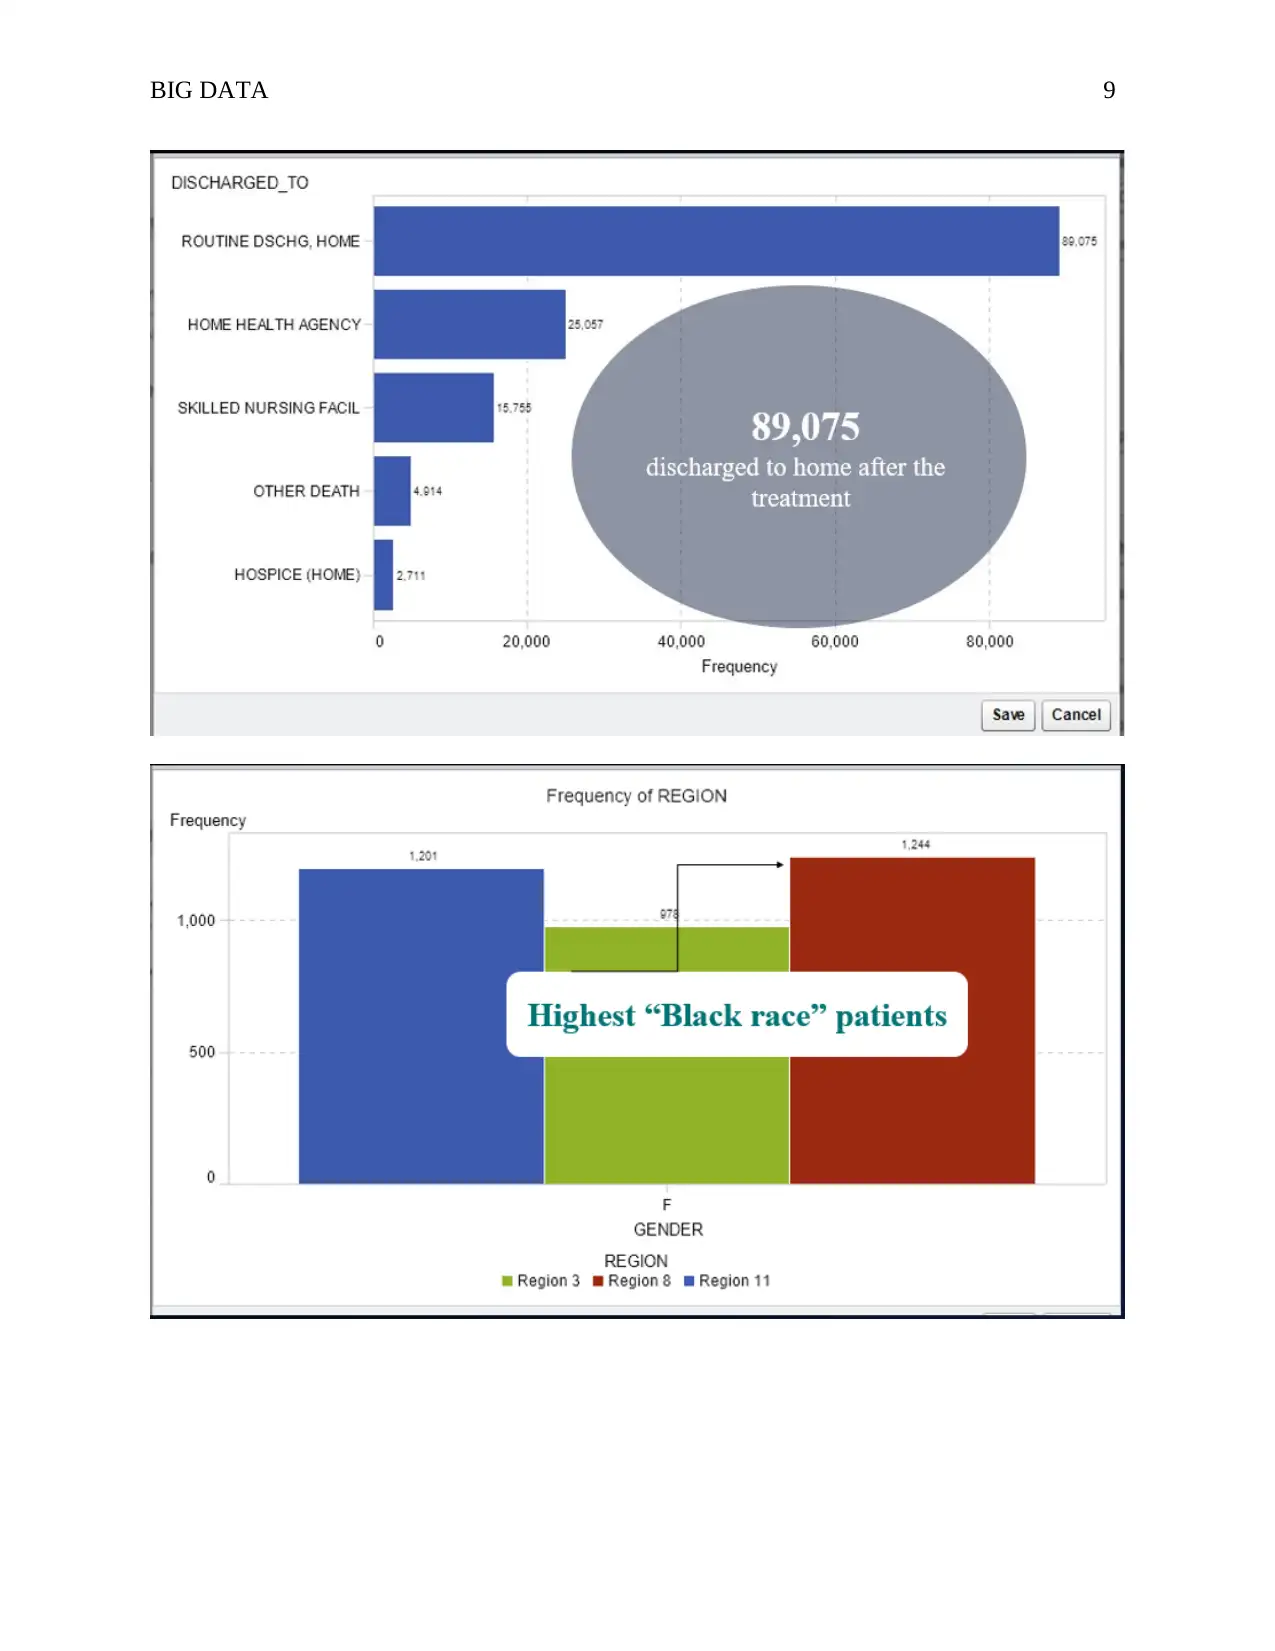
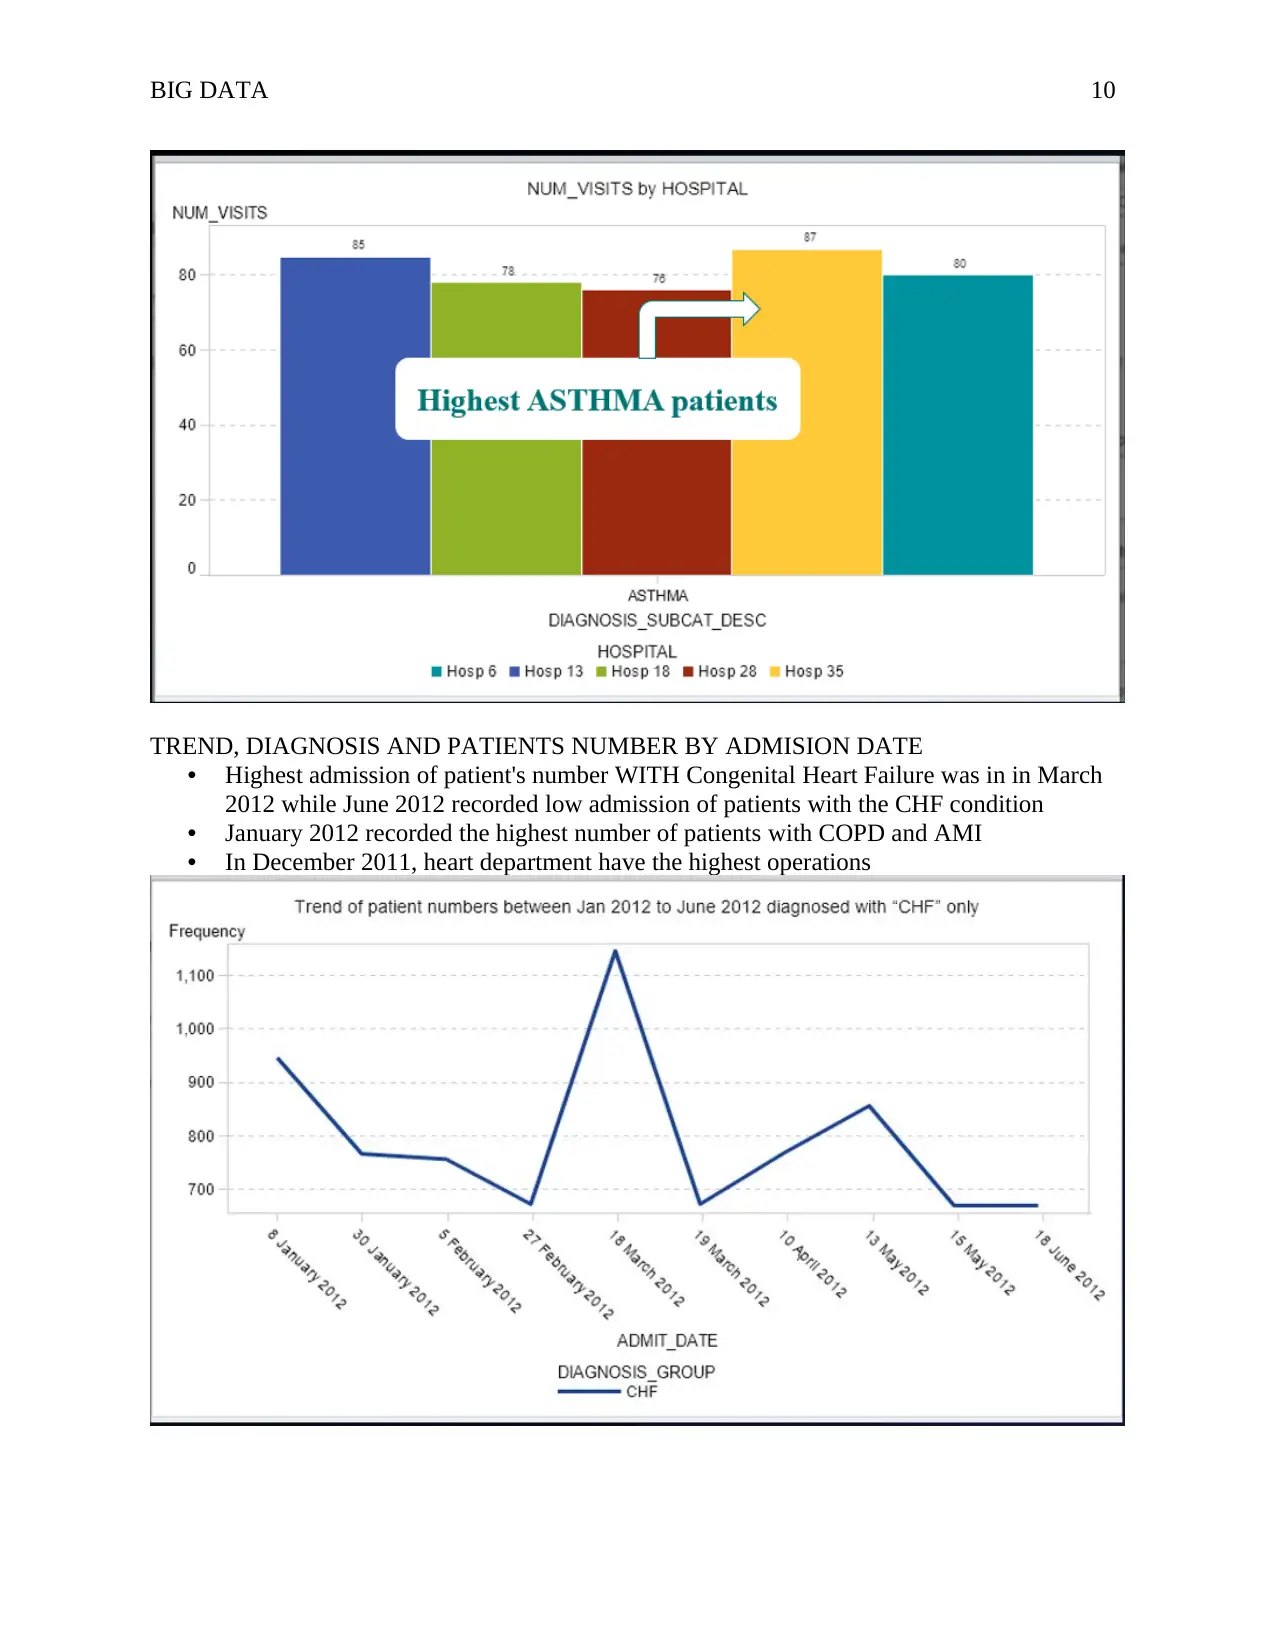
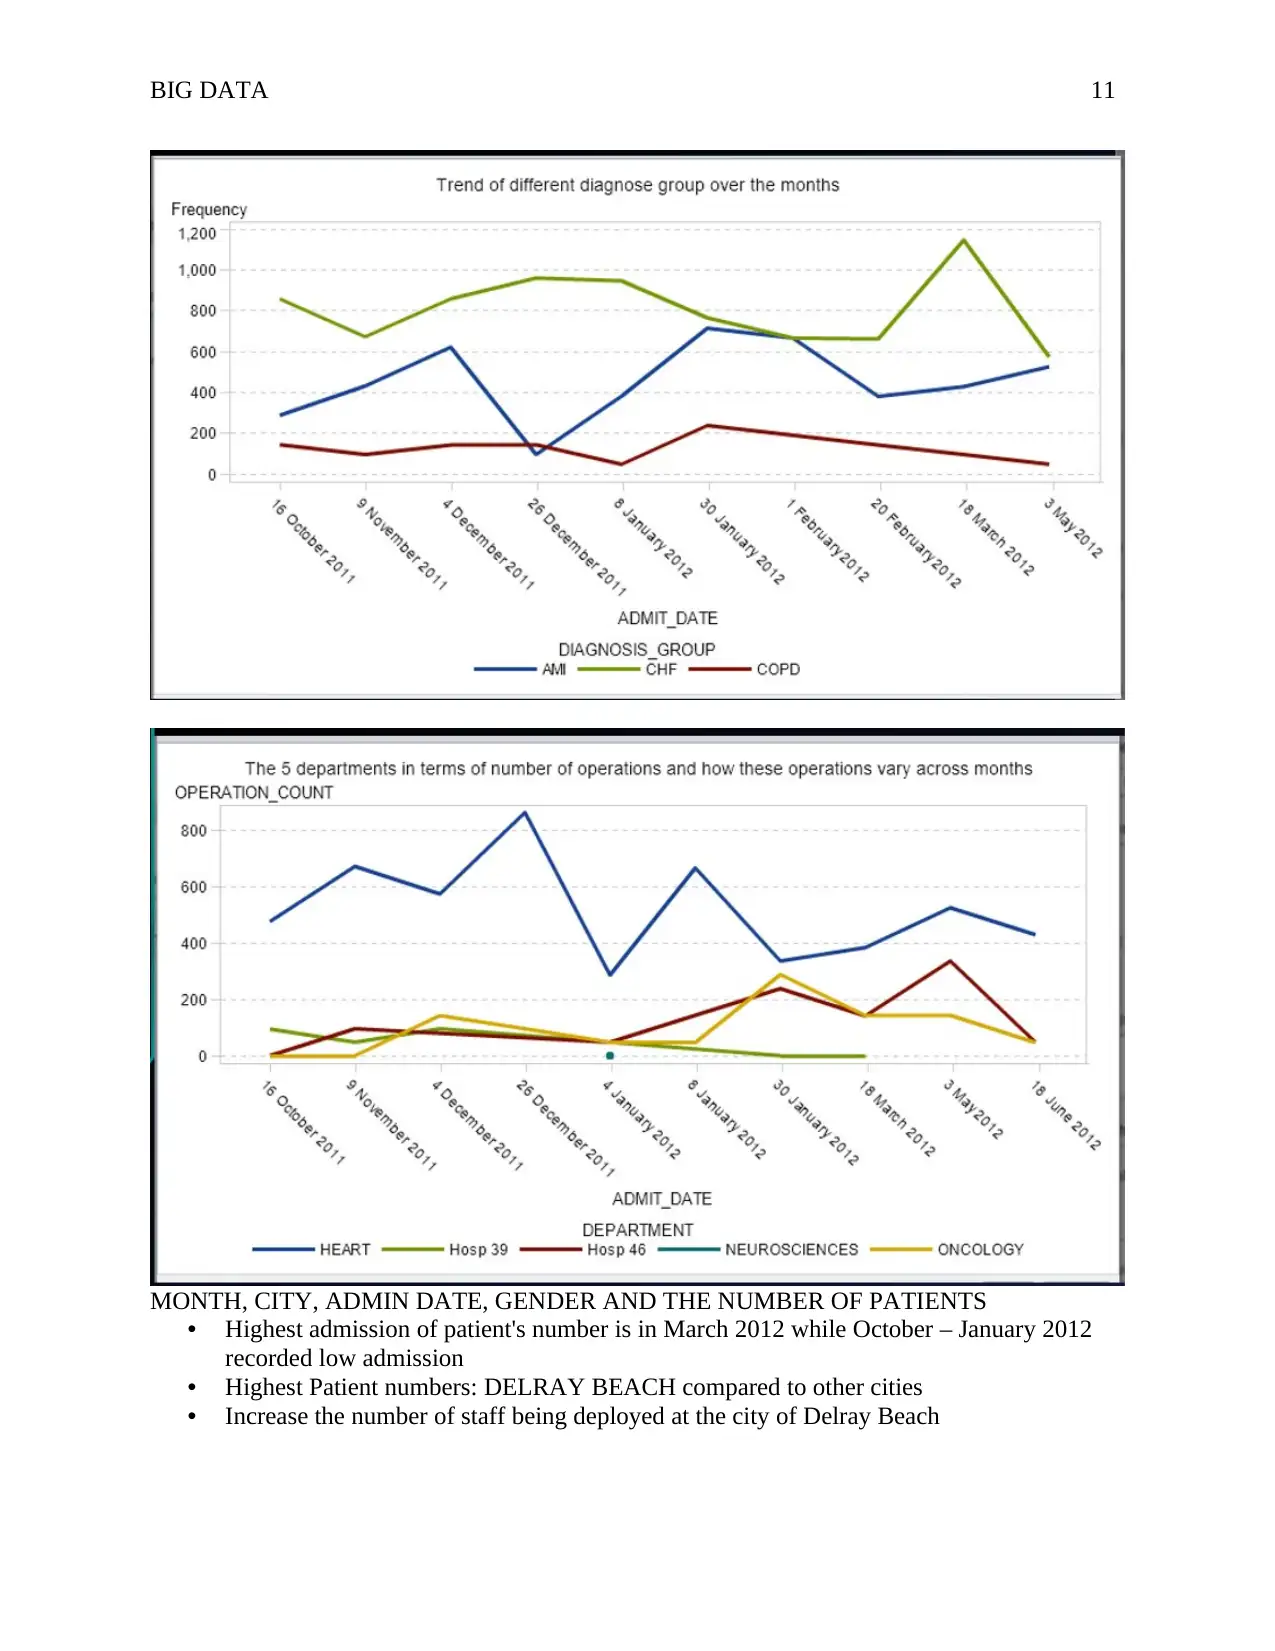
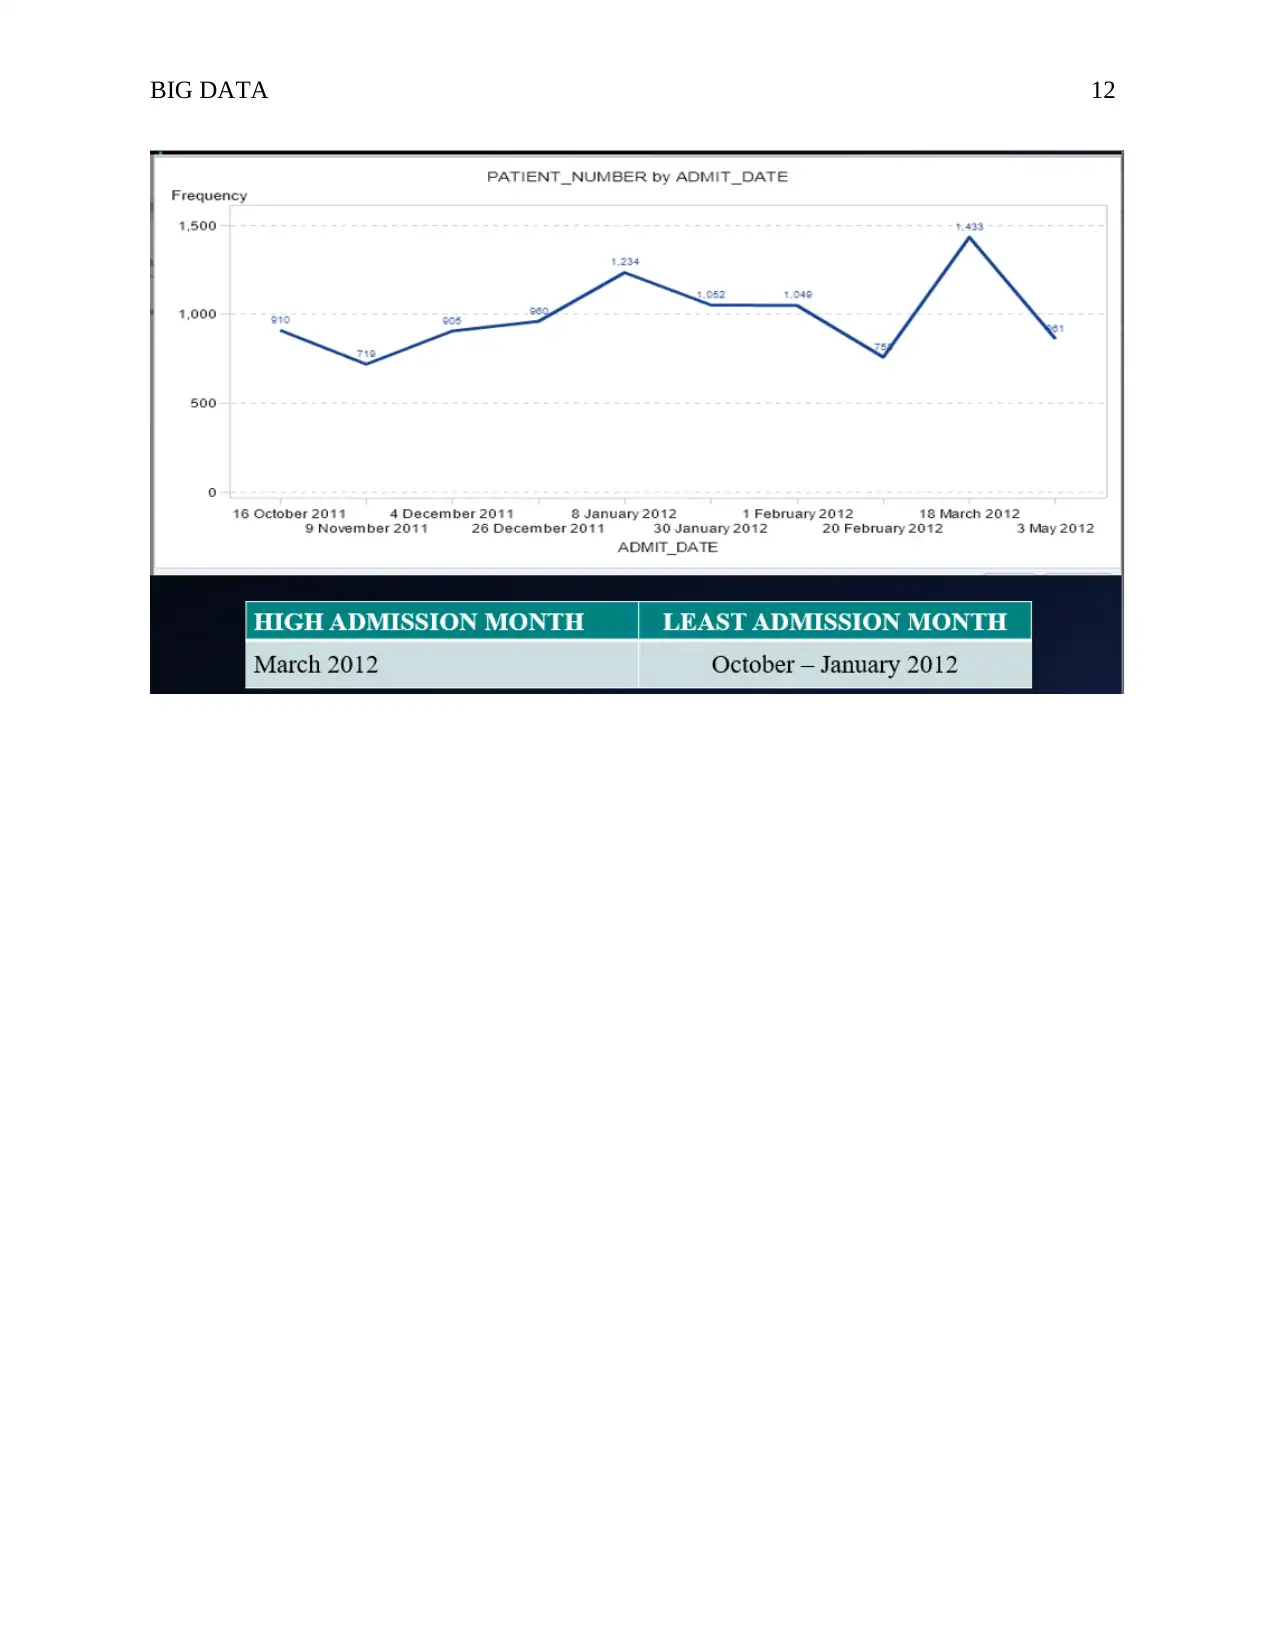
This report presents a comprehensive analysis of US health data, utilizing SAS Visual Analytics to explore trends, patterns, and insights. The analysis focuses on the 'READMIT-HISTORICAL' dataset, examining ICU days, diagnosis groups, patient numbers, admission dates, and hospital data across different regions and demographics. Key findings include the prevalence of Congestive Heart Failure (CHF) and Acute Myocardial Infarction (AMI), regional variations in diagnoses, and correlations between admission dates and specific health conditions. The report provides visualizations such as horizontal graphs, line graphs, and bar graphs to illustrate these findings and offers recommendations for healthcare improvements, including targeted training programs, resource allocation, and public health initiatives. The executive summary highlights key takeaways, such as the need for more specialists in certain areas and the importance of addressing high admission rates in specific locations. The report also includes reflections on data quality and timeliness challenges.
Document Page
Running Head: BIG DATA 1
US health department
<Name>
<University Name>
tabler-icon-diamond-filled.svg

Paraphrase This Document

Need a fresh take? Get an instant paraphrase of this document with our AI Paraphraser
Document Page
BIG DATA 2
Task 1: Background Information 3
Task 2: Reporting and Dashboard 4
ICU_DAYS and DIAGNOSIS GROUP 4
REGION, RACE, DIAGNOSIS AND DISCHARGED TO 8
TREND, DIAGNOSIS AND PATIENTS NUMBER BY ADMISION DATE 10
HOSPITAL AND PATIENT NUMBER MAP 14
Task 3: Additional Visualizations 15
Task 4: Justification 18
Task 5: Discussions 18
Task 6: Executive summary 19
Task 7: The Reflection (Individual Task) 20
Conclusion 20
References 21
Appendices 22
Document Page
BIG DATA 3
Task 1: Background Information
Generally, analysis is important for every health organization that has a specific focus in order
to; enhance productivity and, therefore, more efficiency and effectivity, various valuable health
insights are gained, organization’s reputation can be upheld, Health Organizations or business
firms can remain competitive and improve overall performance and operations.
In this assignment, the "READMIT-HISTORICAL" dataset from teradatauniversitynetwork.com
has been considered. The SAS visualization analytics have been used since it has data
visualization that enhances decision-making process as well as communicating the trend and
discovers hidden patterns. The analysis of the health industry of America is important since; it
has become an expensive industry, development, and updating of health strategic plans
addressing health issues and to identify the patient number and Admission dates.
Big Data analysis is key since it is considered as a tool for evaluating quality of service provided
by the health industry in general, huge data of numerous hospitals, (June 2011 – July 2012).
Additionally, visualization of health conditions via SAS Visual Analytics predict the future of
U.S Health Services. These results are useful to US health departments since they are dealing
with the lives of people as well as continual operational improvement is necessary.
Normally, data visualization comes with a wide range of benefits ranging from but not limited to
having a glance to changes exposed within a timely manner, (Yang, Li, & Zhang, 2018). For
example, dashboards can be manipulated to uncover other findings especially hidden factors
affecting the general performance of an organization. This makes the data visualizations better
than static charts which may not have additional interactions except what has been presented. As
a result, people tend to enjoy data visualizations due to its interactive measures that change the
general perception of many analytics, (Hepworth, & C Canon, 2018).
Document Page
BIG DATA 4
Task 2: Reporting and Dashboard
ICU_DAYS and DIAGNOSIS GROUP
tabler-icon-diamond-filled.svg

Paraphrase This Document

Need a fresh take? Get an instant paraphrase of this document with our AI Paraphraser
Document Page
BIG DATA 5
Acute Myocardial Infarction (AMI) and COPD HIGHEST ICU DAYS for male's region
11.
Congestive Heart Failure (CHF) HIGHLY DIAGNOSED in region 10 and 11.
COPD has been identified as the diagnosis group which is least popular disease whereas
Congestive Heart Failure (CHF) is the most popular disease
Include training of Congestive Heart Failure (CHF) in most learning institutions so that
more doctors can be trained to tackle the disease due to its popularity.
Deploy more doctors specializing in Congestive Heart Failure (CHF) in Region 10 and
11 than other regions since the disease is highly diagnosed in these regions.
Health education and promotion programs to target more males than females since they
have Congestive Heart Failure (CHF) and COPD conditions in higher proportions than
their female counterparts.
MOST AND LEAST POPULAR DISEASES
Under Congestive Heart Failure (CHF), Heart Failure; 85, 138 cases has been identified
as the most popular diseases while disorders of disease electrolyte; 94 cases have been
identified as the least popular disease
In addition, Pneumonia Organism Unspecified; 31, 245 is the most popular disease under
Acute Myocardial Infarction (AMI) while Bronchopneumonia; 94 is the least popular
disease
In COPD, Chronic Bronchitis ; 75, 538 has been identified as the most popular disease
whereas Others ; 48 is seen to be the least popular disease.
Train more doctors to specialize in Congestive Heart Failure (CHF), Pneumonia
Organism Unspecified and Chronic Bronchitis since they are considered to be the most
popular diseases affecting the US general populations.
Document Page
BIG DATA 6
Document Page
BIG DATA 7
DEPARTMENTS AND NUMBER OF PATIENTS SEEN
Heart department has the highest number of patients; 770 followed by general medicine
department; 290.
Oncology and Transplant department accounted for 103 and 83 total number of patients
seen.
Neurosciences is the department that sees the lowest number; 10 of patients.
There is need to add more medical doctors in Heart and General medicine given the fact
that they see the highest number of patients compared to other patients.
tabler-icon-diamond-filled.svg

Paraphrase This Document

Need a fresh take? Get an instant paraphrase of this document with our AI Paraphraser
Document Page
BIG DATA 8
REGION, RACE, DIAGNOSIS AND DISCHARGED TO
Highest female patients seen comes from region 11
A total of 89,075 patients are discharged to home after the treatment
Highest “Black race” patients are from region 8
Highest ASTHMA patients; 87 are from Hosp 35.
Increase more female doctors in region 11 and more doctors in general in region 8 which
sees many patients.
Deploy more doctors specializing in ASTHMA in hospital 35 since they see many
clients suffering from ASTHMA.
Document Page
BIG DATA 9
Document Page
BIG DATA 10
TREND, DIAGNOSIS AND PATIENTS NUMBER BY ADMISION DATE
Highest admission of patient's number WITH Congenital Heart Failure was in in March
2012 while June 2012 recorded low admission of patients with the CHF condition
January 2012 recorded the highest number of patients with COPD and AMI
In December 2011, heart department have the highest operations
tabler-icon-diamond-filled.svg

Paraphrase This Document

Need a fresh take? Get an instant paraphrase of this document with our AI Paraphraser
Document Page
BIG DATA 11
MONTH, CITY, ADMIN DATE, GENDER AND THE NUMBER OF PATIENTS
Highest admission of patient's number is in March 2012 while October – January 2012
recorded low admission
Highest Patient numbers: DELRAY BEACH compared to other cities
Increase the number of staff being deployed at the city of Delray Beach
Document Page
BIG DATA 12
chevron_up_icon
1 out of 22
circle_padding
hide_on_mobile
zoom_out_icon
[object Object]