University Name - US Health Department Data Analysis and Report
VerifiedAdded on 2022/10/10
|24
|4205
|485
Report
AI Summary
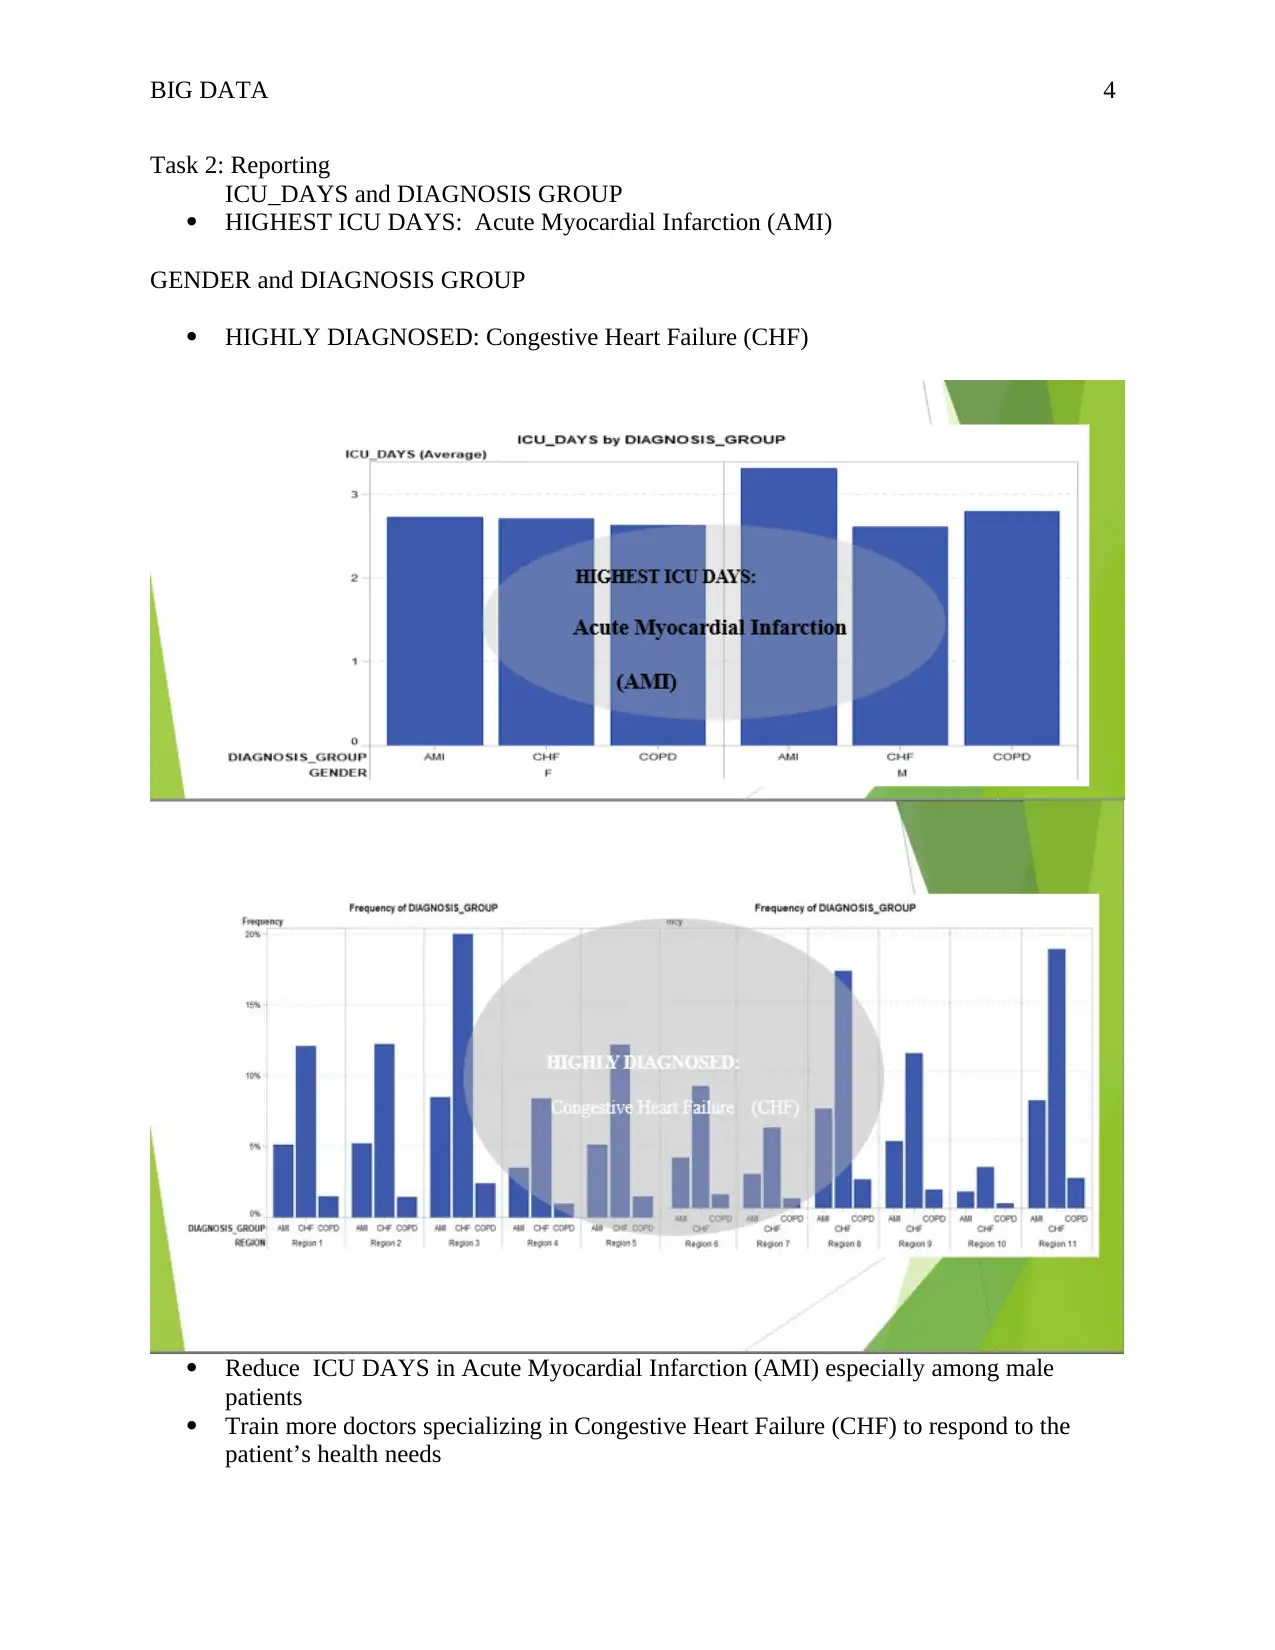
This report presents an analysis of US health data utilizing SAS Visual Analytics, focusing on the 'READMIT-HISTORICAL' dataset. The analysis includes comprehensive reporting on various aspects such as gender and diagnosis groups, the popularity of diseases, department-specific patient numbers, and patient demographics across different regions. The study incorporates diverse visualizations, including horizontal bar graphs, line graphs, and dashboards, to highlight trends and patterns, such as the correlation between admission dates and diagnosis groups. The report identifies key insights, including the prevalence of certain conditions like Congestive Heart Failure (CHF) and Acute Myocardial Infarction (AMI), and offers recommendations to improve healthcare delivery, such as targeted training for medical professionals and resource allocation based on patient needs. The report concludes with an executive summary and reflections, emphasizing the importance of data-driven decision-making in the healthcare sector. The data visualizations are also used to identify key areas of improvement for the US health department.

Running Head: BIG DATA 1
US health department
<Name>
<University Name>
US health department
<Name>
<University Name>
Paraphrase This Document
Need a fresh take? Get an instant paraphrase of this document with our AI Paraphraser

BIG DATA 2
Table of Contents
Task 1: Background Information.....................................................................................................3
Task 2: Reporting............................................................................................................................4
GENDER and DIAGNOSIS GROUP.............................................................................................4
DIAGNOSIS GROUP AND POPULARITY OF THE DISEASES...............................................5
DEPARTMENTS AND THE NUMBER OF PATIENTS..............................................................7
PATIENT NUMBER BY GENDER, RACE, HOSPITAL, AND DISCHARGE..........................7
PATIENT NUMBER, ADMISSION, AND CITY.........................................................................9
HOSPITAL AND PATIENT NUMBER MAP.............................................................................11
Task 3: Additional Visualizations.................................................................................................12
TREND, DIAGNOSIS AND PATIENTS NUMBER BY ADMISSION DATE.........................12
Dashboard......................................................................................................................................17
Task 4: Justification of Horizontal graphs.....................................................................................18
Task 5: Discussions.......................................................................................................................19
Task 4: Justification of line graphs................................................................................................20
Task 5.1: Discussions....................................................................................................................20
Task 6: Executive Summary..........................................................................................................20
Task 7: The Reflection (Individual Task)......................................................................................21
Conclusion.....................................................................................................................................22
References......................................................................................................................................23
Appendices....................................................................................................................................24

BIG DATA 3
Task 1: Background Information
Normally, every country needs a timely and ready dataset which can be analyzed to inform the
decision-making process. On this note, several organizations and departments including continue
to collect data which with time becomes big dataset. As a result, this information needs to be
analyzed so that productivity of the organization especially health information can be enhanced.
Furthermore, analysis of this big data increases the organization’s reputation thus making health
Organizations or departments to remain competitive. To note, this will lead to an increase in the
organization’s overall performance thus improving its general activities.
For the purposes of accomplishing this task, the "READMIT-HISTORICAL" dataset from
teradatauniversitynetwork.com has been utilized and the analysis conducted by use of the SAS
visualization analytics. Generally, the SAS visualization analytics produces data visualizations
which can be understood by any professional without necessarily requiring them to have a
statistical background. Hence, these visualizations help to increase the decision-making process
within the organization. Furthermore, the visualizations are useful while communicating the
trend and discovering any hidden patterns within the big data.
On this note, the analysis of the health industry of America is important since given the fact that
it has become an expensive industry within the country. Moreover, through the analysis, the
country’s strategic plan can be developed or updated to capture general health issues affecting
the population and citizens in general.
One of the tools for evaluating the quality of service provided by the health industry, in general,
is the requirement and availability of the Big Data analysis. As the department of health
continues to collect daily data, there are chances of having huge data of numerous hospitals as in
the case of (June 2011 – July 2012) dataset. Additionally, visualization of health conditions via
SAS Visual Analytics predict the future of U.S Health Services. Through this, effective control
and prevention mechanisms towards healthcare can be adopted. The fact that the department of
health in US is dealing with the lives of people and need to continue demonstrating general
healthcare services improvement, there is need for this analysis to ensure timely availability of
results for decision-making strategies.
In addition, some of the benefits of data visualizations include its ability to enable an individual
to have a glance on the results and in one way or the other detects any change within the
healthcare-related activities by state, (Yang, Li, & Zhang, 2018). For example, with the
availability of dashboards from the SAS visualization analytics, it is easy to manipulate the
results depending on the variable of interest hence discovering general trends in the analysis.
Comparing data visualizations with static charts, these visualizations are better since, in one way
or the other, they may consider additional interactions unlike to static charts which only consider
what has been presented without any further interactions. Moreover, data visualizations in most
cases attract viewers due to its interactive measures that change the general attitude of non-
statisticians, (Hepworth, & C Canon, 2018).
⊘ This is a preview!⊘
Do you want full access?
Subscribe today to unlock all pages.

Trusted by 1+ million students worldwide

BIG DATA 4
Task 2: Reporting
ICU_DAYS and DIAGNOSIS GROUP
HIGHEST ICU DAYS: Acute Myocardial Infarction (AMI)
GENDER and DIAGNOSIS GROUP
HIGHLY DIAGNOSED: Congestive Heart Failure (CHF)
Reduce ICU DAYS in Acute Myocardial Infarction (AMI) especially among male
patients
Train more doctors specializing in Congestive Heart Failure (CHF) to respond to the
patient’s health needs
Paraphrase This Document
Need a fresh take? Get an instant paraphrase of this document with our AI Paraphraser

BIG DATA 5
Need to benchmark in other regions with low levels of Congestive Heart Failure (CHF)
Like region 1 to come up with lessons learned while addressing these cases in regions
with high levels of Congestive Heart Failure (CHF).
DIAGNOSIS GROUP AND POPULARITY OF THE DISEASES
Need to benchmark in other regions with low levels of Congestive Heart Failure (CHF)
Like region 1 to come up with lessons learned while addressing these cases in regions
with high levels of Congestive Heart Failure (CHF).
DIAGNOSIS GROUP AND POPULARITY OF THE DISEASES

BIG DATA 6
• In Congestive Heart Failure (CHF), Heart failure is the most popular; about 92% while
Disorders of Fluid Electrolyte is the least popular at about 0.1%.
• Train more doctors specializing in CHF.
• In Acute Myocardial Infarction (AMI), Pneumonia Organism Unspecified; 80.6% is the
most popular while Bronchopneumonia; 0.24% is the least popular.
• In Chronic Obstructive Pulmonary Disease (COPD), Chronic Bronchitis is the leading
group
• Train several doctors specializing in Pneumonia Organism Unspecified and Chronic
Bronchitis to adequately respond to patients leading illness conditions.
⊘ This is a preview!⊘
Do you want full access?
Subscribe today to unlock all pages.

Trusted by 1+ million students worldwide

BIG DATA 7
DEPARTMENTS AND THE NUMBER OF PATIENTS
• The department of heart has so many clients compared to other departments
• Neurosciences have the least number of patients
• Increase number of medical doctors in the Heart department
• Reduce the number of doctors from the Neurosciences department
PATIENT NUMBER BY GENDER, RACE, HOSPITAL, AND DISCHARGE
Paraphrase This Document
Need a fresh take? Get an instant paraphrase of this document with our AI Paraphraser

BIG DATA 8

BIG DATA 9
• Highest Female Patients comes from region 11 whereas region 3 has the lowest number
of female patients
• 64.78% of the patients are discharged to home after the treatment
• Highest “Black race” patients are from region 11
• Highest ASTHMA patients come from Hosp 35 while Hosp 28 have the lowest
ASTHMA patients
• Employ more staff in region 11 to handle female patient cases.
• Increase the number of patients being discharged to home.
• Raise the number of staff working at Hosp 35.
PATIENT NUMBER, ADMISSION, AND CITY
• March 2012 is the month with the highest admission while October – January 2012
recorded low admission
• Highest Patient numbers: DELRAY BEACH compared to other cities
• Increase the number of staff being deployed at the city of Delray Beach
⊘ This is a preview!⊘
Do you want full access?
Subscribe today to unlock all pages.

Trusted by 1+ million students worldwide

BIG DATA 10
Paraphrase This Document
Need a fresh take? Get an instant paraphrase of this document with our AI Paraphraser

BIG DATA 11
HOSPITAL AND PATIENT NUMBER MAP
Data collection have been based in 10 states: Florida, Alabama, Georgia, Texas, Virginia,
Illinois, Mississippi, Arkansas, Missouri, and Tennessee.
The highest count of patient number by the hospital is from Florida
The lowest count is from Tennessee
HOSPITAL AND PATIENT NUMBER MAP
Data collection have been based in 10 states: Florida, Alabama, Georgia, Texas, Virginia,
Illinois, Mississippi, Arkansas, Missouri, and Tennessee.
The highest count of patient number by the hospital is from Florida
The lowest count is from Tennessee

BIG DATA 12
Task 3: Additional Visualizations
TREND, DIAGNOSIS AND PATIENTS NUMBER BY ADMISSION DATE
• Highest admission of patient's number WITH Congenital Heart Failure was in March
2012 while June 2012 recorded low admission of patients with the CHF condition
• January 2012 recorded the highest number of patients with COPD and AMI
• In December 2011, the heart department has the highest operations
⊘ This is a preview!⊘
Do you want full access?
Subscribe today to unlock all pages.

Trusted by 1+ million students worldwide
1 out of 24
Related Documents

Your All-in-One AI-Powered Toolkit for Academic Success.
+13062052269
info@desklib.com
Available 24*7 on WhatsApp / Email
Unlock your academic potential
Copyright © 2020–2025 A2Z Services. All Rights Reserved. Developed and managed by ZUCOL.