Analysis of US Economy: Sectoral GDP, Per Capita Income, Malthus Model

Verified

Added on  2021/04/21

|14
|1585
|78
Report
AI Summary
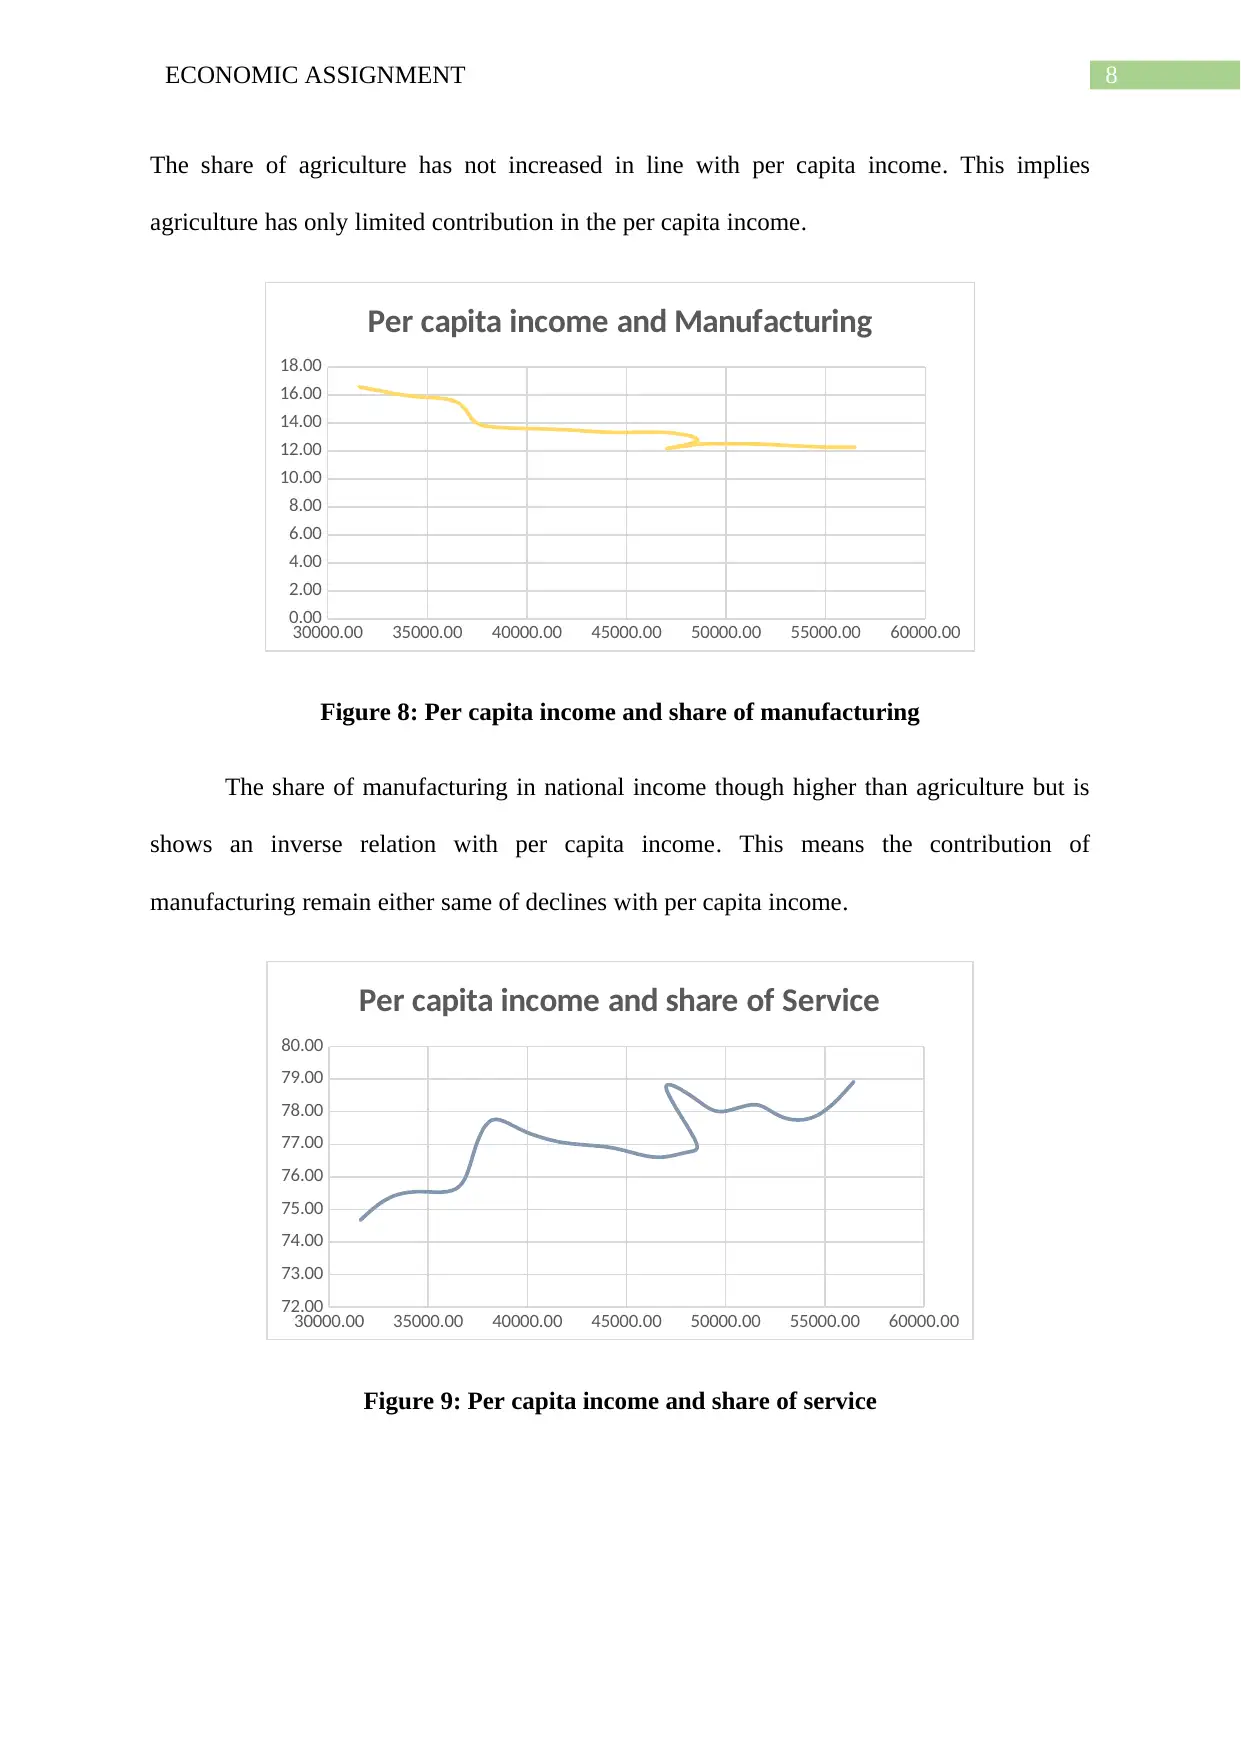
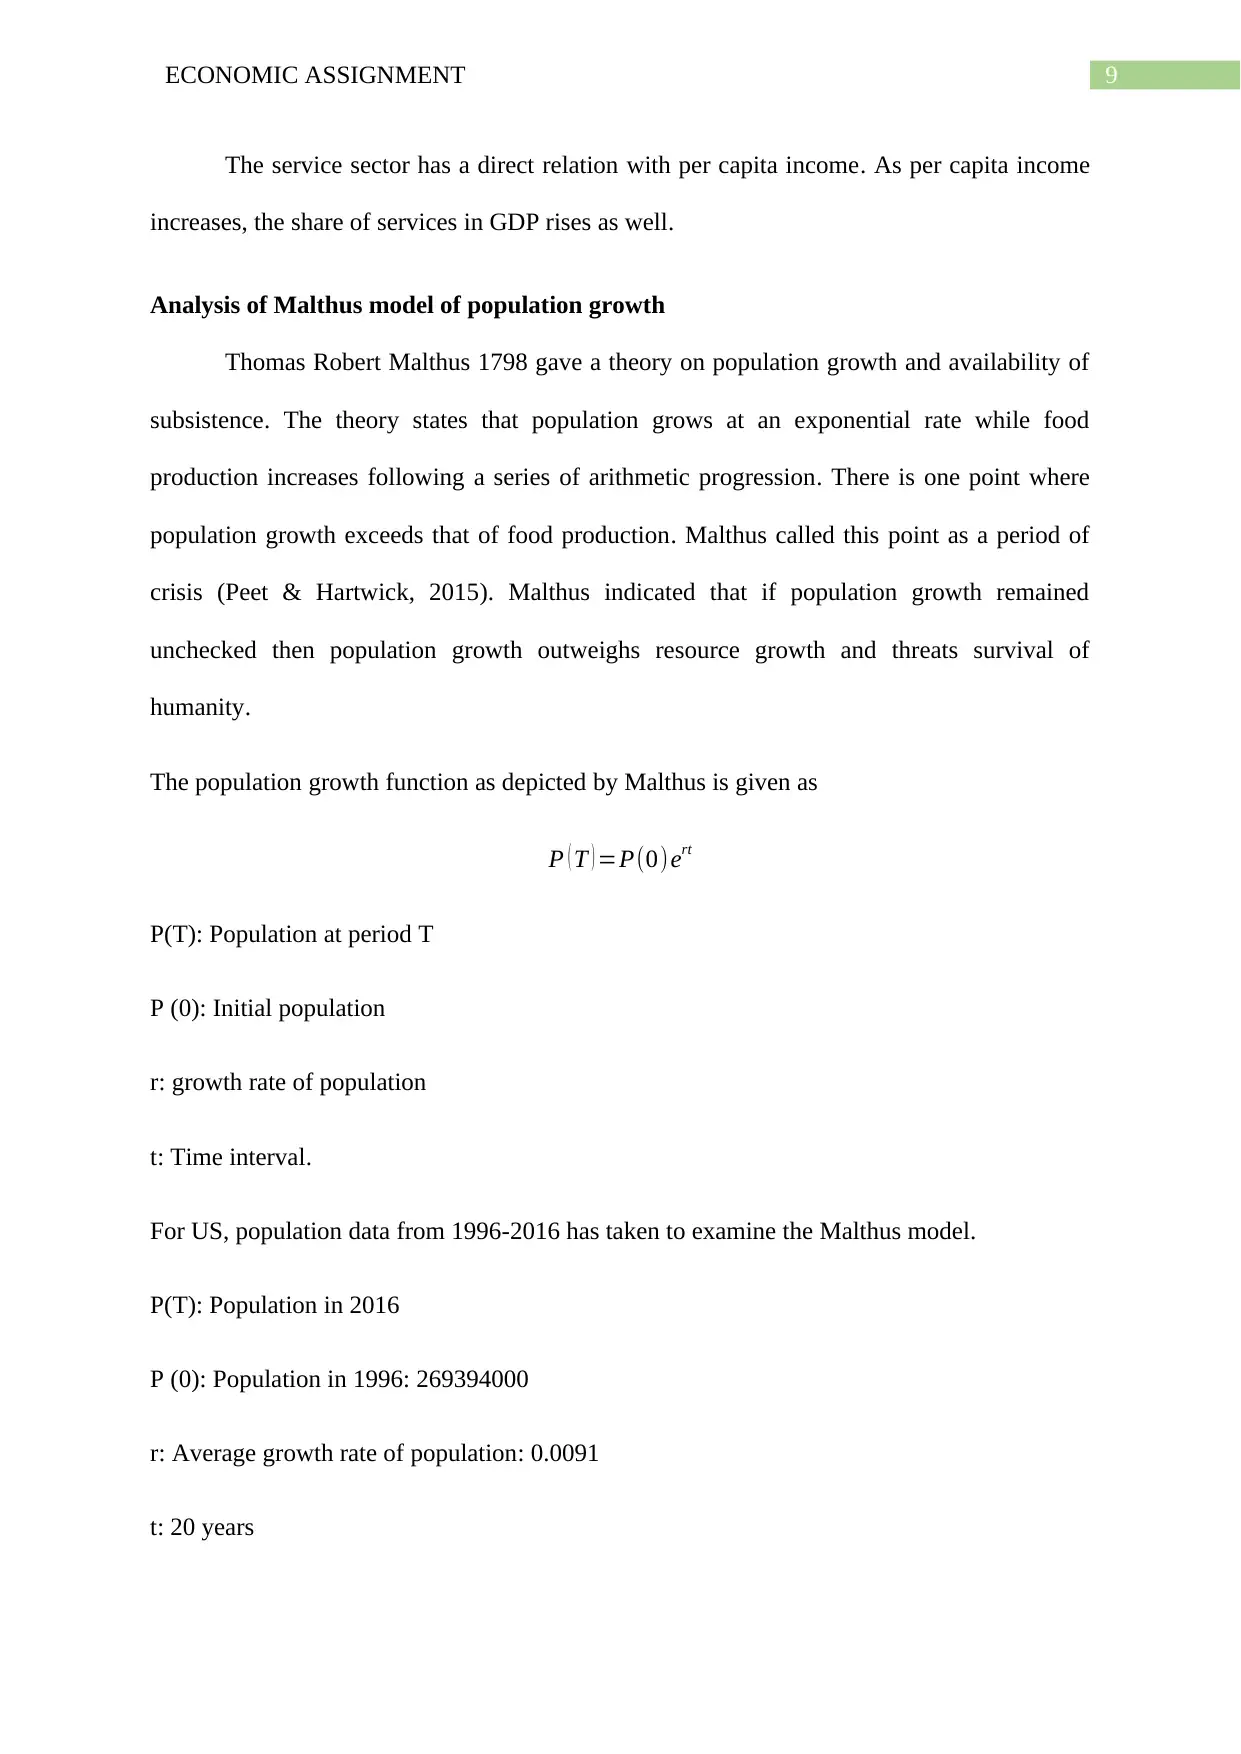
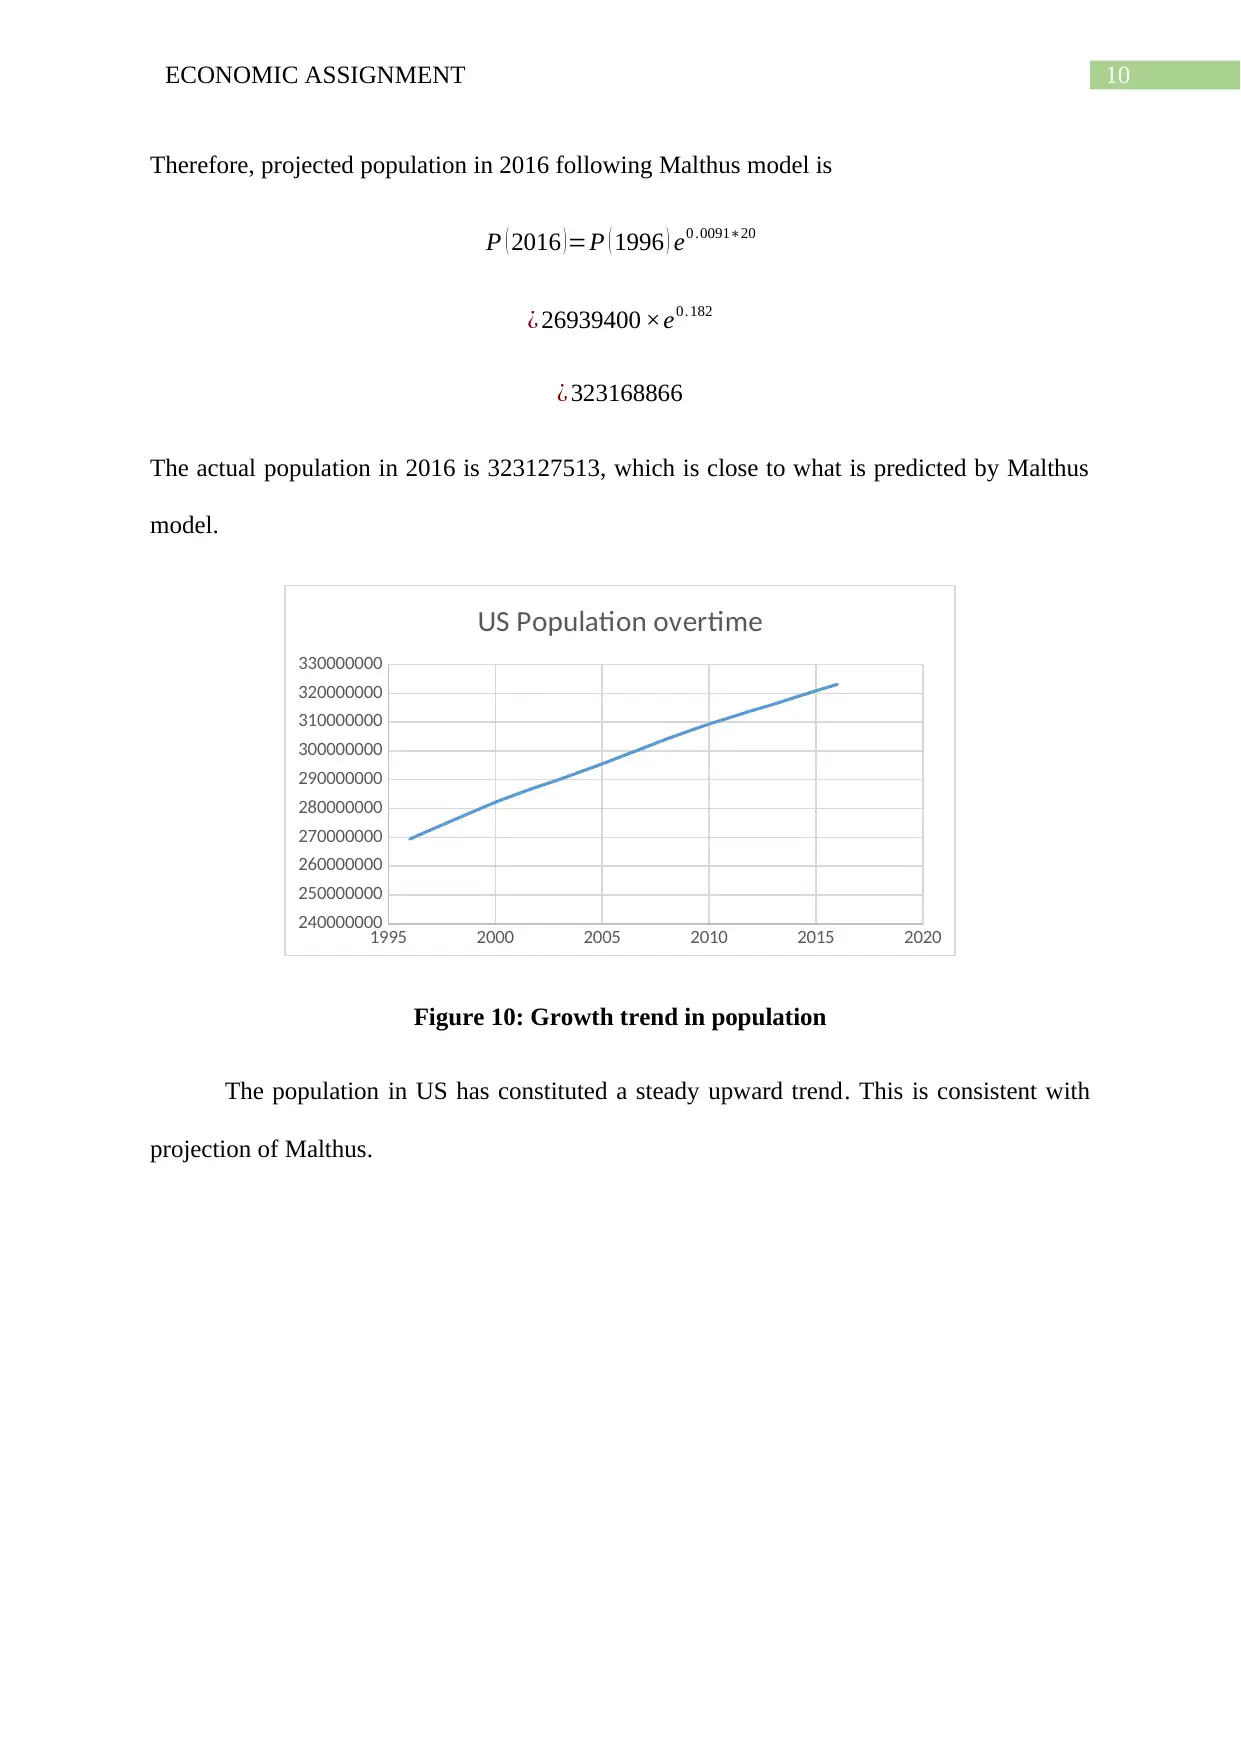
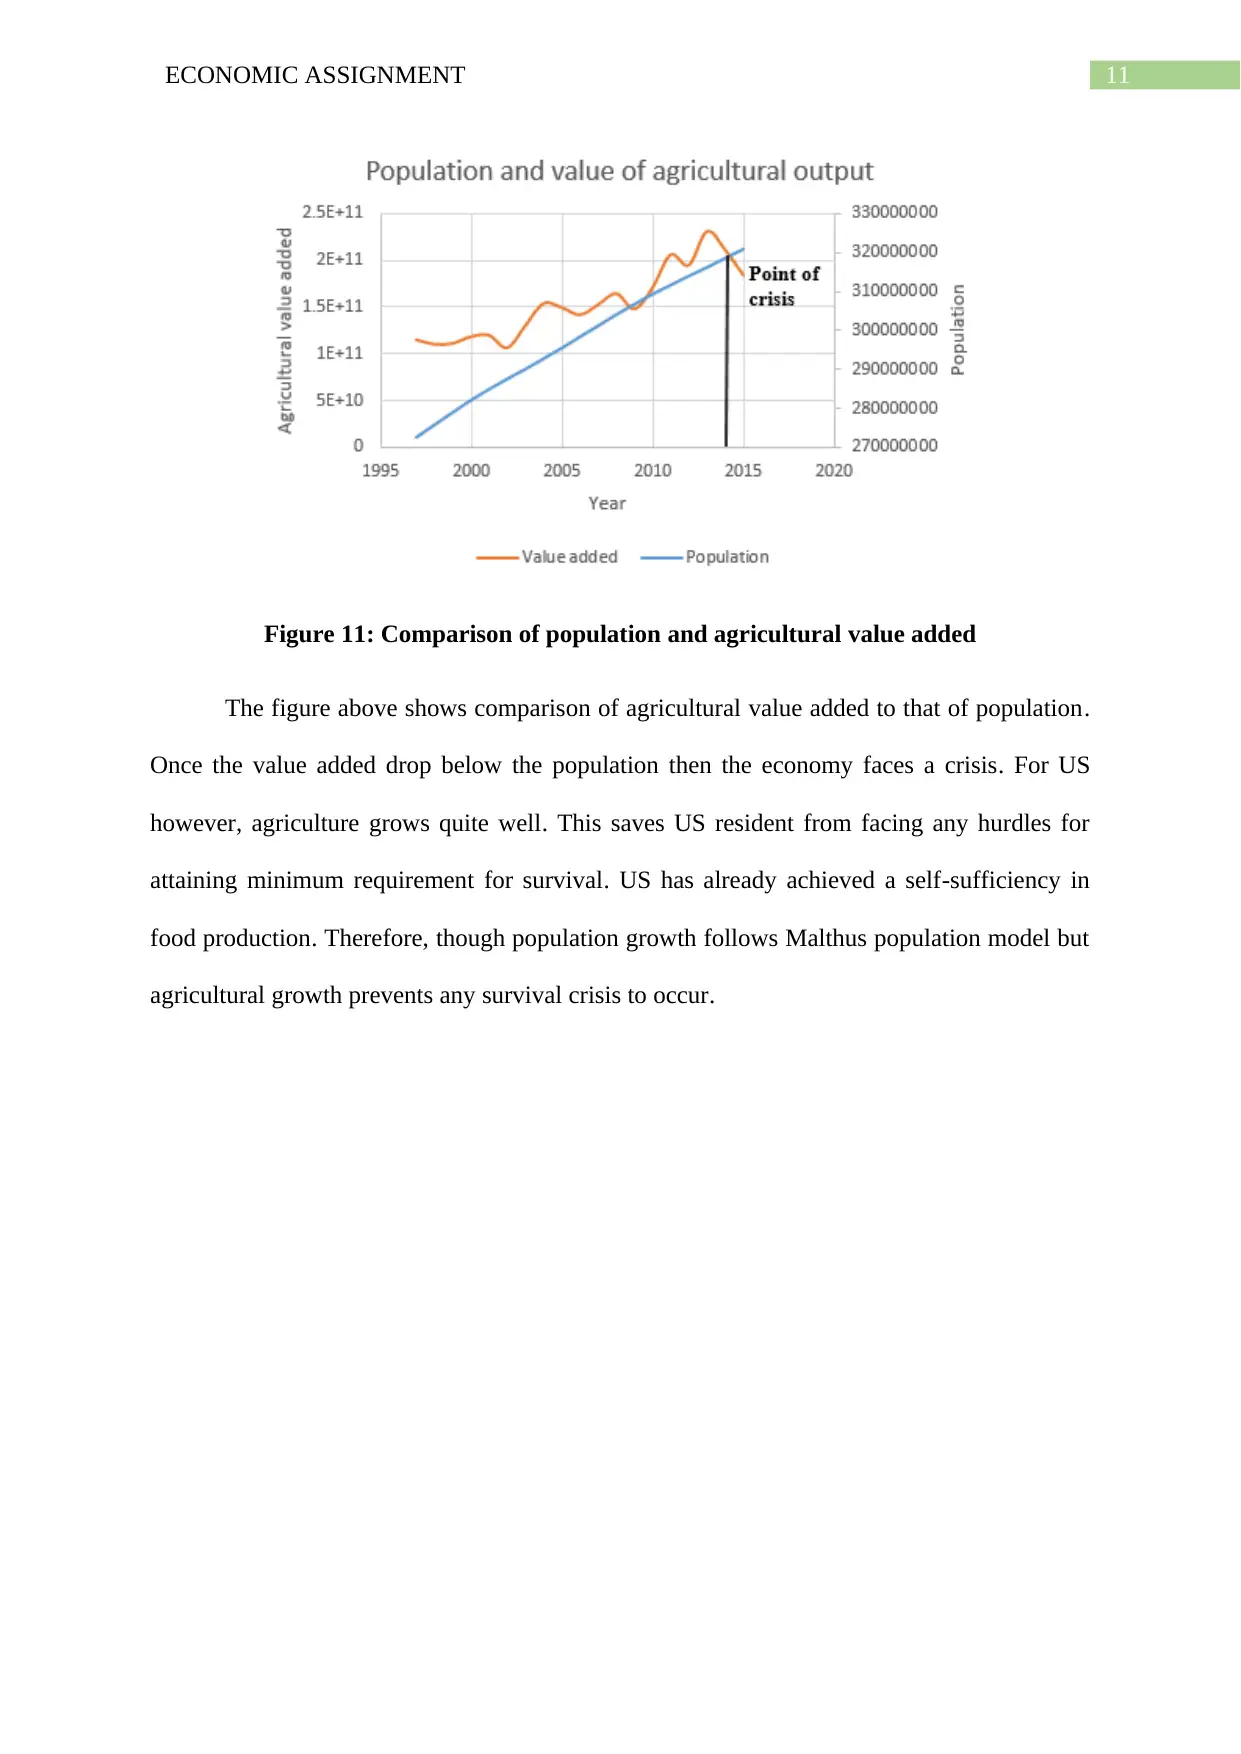
This economic report provides a comprehensive analysis of the US economy, focusing on the contributions of the agriculture, manufacturing, and service sectors to the total GDP. It examines the trends in sectoral shares over time, highlighting the shift towards a service-based economy. The report also analyzes per capita income, assessing its relationship with sectoral changes. Furthermore, it applies the Malthus model of population growth to the US data, comparing the predicted population with the actual figures and discussing the implications of population growth in relation to agricultural output. The report concludes with a summary of key findings and insights into the US economic landscape.
tabler-icon-diamond-filled.svg

Contribute Materials

Your contribution can guide someone’s learning journey. Share your documents today.
Document Page
Running Head: ECONOMIC ASSIGNMENT
Economic Assignment
Name of the Student
Name of the University
Author note
tabler-icon-diamond-filled.svg

Secure Best Marks with AI Grader

Need help grading? Try our AI Grader for instant feedback on your assignments.
Document Page
1ECONOMIC ASSIGNMENT
Table of Contents
Introduction................................................................................................................................2
Share of three major sectors in Total GDP................................................................................2
Agriculture.............................................................................................................................2
Manufacturing........................................................................................................................3
Service....................................................................................................................................4
Rate of growth Per capita income..............................................................................................6
Sectoral change and per capita income......................................................................................7
Analysis of Malthus model of population growth......................................................................9
Conclusion................................................................................................................................12
Reference list............................................................................................................................13
Data Source..............................................................................................................................13
Document Page
2ECONOMIC ASSIGNMENT
Introduction
Agriculture, manufacturing and service are the three major sectors of an economy.
The share of these three sectors in total GDP varies across countries. The paper analyzes
share of these three sectors in total GDP of United State. As a country developed, it is
generally believed that the share of primary sector goes down while that of secondary and
tertiary sector rises. US is one of most developed nation in world with having a major share
of service sector in GDP. Along with sectorial contribution per capita output or income is
also analyzed. Finally, per capita income is compared against the sectoral contribution to test
the proposition made by Robert Malthus in 1798 (Sakanko & David, 2018).
Share of three major sectors in Total GDP
Agriculture
Unites State has a stable agriculture sector. The sector is considered as one of the
major sectors of the economy. The nation has achieved self-sufficiency in food. Agriculture
sector not only meets domestic need but also provide exportable goods for the nation (Lark,
Salmon & Gibbs, 2015). The figure below shows the share of agricultural value added in total
GDP of United States over time.
Document Page
3ECONOMIC ASSIGNMENT
1996 1998 2000 2002 2004 2006 2008 2010 2012 2014 2016
0.00
0.20
0.40
0.60
0.80
1.00
1.20
1.40
1.60
Agriculture
Figure 1: Trend in share of agriculture in GDP
As shown from the above chart the share of agriculture value added in GDP fluctuates
around 1 to 2 percent. The share declines from 1997 to 2002. The share of agriculture
increases slightly from 2002 onwards and remain close to 1.1 percent. For the last two three
years, the percentage share of agriculture in GDP has declined sharply to 1 percent.
Manufacturing
One vital sector of the US economy is the Manufacturing sector. Since 1990s,
following China’s growth, spread of globalization and innovation have opened up significant
opportunities for the concerned sector. Manufacturing now accounts a significant share in
GDP. The share of manufacturing in US’s total output is given in the following chart.
tabler-icon-diamond-filled.svg

Secure Best Marks with AI Grader

Need help grading? Try our AI Grader for instant feedback on your assignments.
Document Page
4ECONOMIC ASSIGNMENT
1996 1998 2000 2002 2004 2006 2008 2010 2012 2014 2016
0.00
2.00
4.00
6.00
8.00
10.00
12.00
14.00
16.00
18.00
Manufacturing
Figure 2: Trend in share of manufacturing in GDP
In 1996, the share of manufacturing in GDP was close to 17 percent. From 2000, the share
has declined continuous and in 2009, manufacturing has accounted 12 percent share in GDP.
After that the share of manufacturing value added has remained almost stagnant around 12
percent.
Service
Service sector is the most important sector of US economy. The sector accounts
highest share in GDP and generates maximum number of employment in the economy
(washingtonpost.com, 2018)
Document Page
5ECONOMIC ASSIGNMENT
1996 1998 2000 2002 2004 2006 2008 2010 2012 2014 2016
72.00
73.00
74.00
75.00
76.00
77.00
78.00
79.00
80.00
Service
Figure 3: Trend in share of services in GDP
The share of service sector has increased steadily from 1997 to 2003. In 2003, service sector
accounts nearly 77% of GDP. The share of service sector has declined slightly in 2005-2006.
However, the share has increased sharply thereafter and reached to 78.92 percent in 2015.
0.00
10.00
20.00
30.00
40.00
50.00
60.00
70.00
80.00
90.00
Sectoral contribution of different sectors in
GDP
Agriculture
Manufacturing
Service
Figure 4: Comparison of sectoral contribution
The above figure has made a comparative analysis of share of different sectors in total
GDP. It is clearly evident that the lowest share in GDP corresponds to agriculture followed
by manufacturing and service sector
Document Page
6ECONOMIC ASSIGNMENT
Rate of growth Per capita income
Per capita GDP is the measure of per capita income in the nation. It indicates output
per person (Mankiw, 2014). An increase in per capita GDP usually implies an improvement
in living standard overtime.
1996
1997
1998
1999
2000
2001
2002
2003
2004
2005
2006
2007
2008
2009
2010
2011
2012
2013
2014
2015
2016
0.00
10000.00
20000.00
30000.00
40000.00
50000.00
60000.00
70000.00
Per Capita Output
Figure 5: Per capita output in US
Per capita output in United State has increased overtime. From 1996 to 2008, output
per person has risen sharply indicating prosperity in income until 2008. However, following
global financial crisis in 2008, growth per capita output has reduced due to economic
slowdown. With economy recovery per capita output has also recovered and continued to
increase.
tabler-icon-diamond-filled.svg

Paraphrase This Document

Need a fresh take? Get an instant paraphrase of this document with our AI Paraphraser
Document Page
7ECONOMIC ASSIGNMENT
1995 2000 2005 2010 2015 2020
-4.00%
-2.00%
0.00%
2.00%
4.00%
6.00%
8.00%
Growth in Per Capita Output
Growth
Figure 6: Growth in per capita output
In absolute term, per capita income though increases steadily but there is variation in
the rate of change in per capita output. The growth rate constitutes a fluctuating trend
reaching peak in 2005. The growth has declined dramatically in 2009, the economy had
accounted a negative growth rate during thin this time.
Sectoral change and per capita income
This section analyzes how contribution of the three major sectors of the economy
changes along with change in per capita income.
30000.00 35000.00 40000.00 45000.00 50000.00 55000.00 60000.00
0.00
0.20
0.40
0.60
0.80
1.00
1.20
1.40
1.60
Per capita income and share of
agriculture
Figure 7: Per capita income and share of agriculture
Document Page
8ECONOMIC ASSIGNMENT
The share of agriculture has not increased in line with per capita income. This implies
agriculture has only limited contribution in the per capita income.
30000.00 35000.00 40000.00 45000.00 50000.00 55000.00 60000.00
0.00
2.00
4.00
6.00
8.00
10.00
12.00
14.00
16.00
18.00
Per capita income and Manufacturing
Figure 8: Per capita income and share of manufacturing
The share of manufacturing in national income though higher than agriculture but is
shows an inverse relation with per capita income. This means the contribution of
manufacturing remain either same of declines with per capita income.
30000.00 35000.00 40000.00 45000.00 50000.00 55000.00 60000.00
72.00
73.00
74.00
75.00
76.00
77.00
78.00
79.00
80.00
Per capita income and share of Service
Figure 9: Per capita income and share of service
Document Page
9ECONOMIC ASSIGNMENT
The service sector has a direct relation with per capita income. As per capita income
increases, the share of services in GDP rises as well.
Analysis of Malthus model of population growth
Thomas Robert Malthus 1798 gave a theory on population growth and availability of
subsistence. The theory states that population grows at an exponential rate while food
production increases following a series of arithmetic progression. There is one point where
population growth exceeds that of food production. Malthus called this point as a period of
crisis (Peet & Hartwick, 2015). Malthus indicated that if population growth remained
unchecked then population growth outweighs resource growth and threats survival of
humanity.
The population growth function as depicted by Malthus is given as
P ( T ) =P(0)ert
P(T): Population at period T
P (0): Initial population
r: growth rate of population
t: Time interval.
For US, population data from 1996-2016 has taken to examine the Malthus model.
P(T): Population in 2016
P (0): Population in 1996: 269394000
r: Average growth rate of population: 0.0091
t: 20 years
tabler-icon-diamond-filled.svg

Secure Best Marks with AI Grader

Need help grading? Try our AI Grader for instant feedback on your assignments.
Document Page
10ECONOMIC ASSIGNMENT
Therefore, projected population in 2016 following Malthus model is
P ( 2016 ) =P ( 1996 ) e0 .0091∗20
¿ 26939400 ×e0 .182
¿ 323168866
The actual population in 2016 is 323127513, which is close to what is predicted by Malthus
model.
1995 2000 2005 2010 2015 2020
240000000
250000000
260000000
270000000
280000000
290000000
300000000
310000000
320000000
330000000
US Population overtime
Figure 10: Growth trend in population
The population in US has constituted a steady upward trend. This is consistent with
projection of Malthus.
Document Page
11ECONOMIC ASSIGNMENT
Figure 11: Comparison of population and agricultural value added
The figure above shows comparison of agricultural value added to that of population.
Once the value added drop below the population then the economy faces a crisis. For US
however, agriculture grows quite well. This saves US resident from facing any hurdles for
attaining minimum requirement for survival. US has already achieved a self-sufficiency in
food production. Therefore, though population growth follows Malthus population model but
agricultural growth prevents any survival crisis to occur.
Document Page
12ECONOMIC ASSIGNMENT
Conclusion
The paper has conducted an empirical research on sectoral share in US GDP, per
capita income and finally examine whether Malthus theory with realistic population model
holds or not. Agriculture has the lowest share in total output. The share of manufacturing
though is greater than agriculture but is well below that of service sector’s share. It is clearly
evident that in the increasing per capita income service sector plays a vital role. Finally, the
Malthus model of exponential population growth gives very close projection of actual
population. However, the economy has yet not faced resource crisis as predicted by Malthus
because of a more or less steady growth of agriculture.
tabler-icon-diamond-filled.svg

Paraphrase This Document

Need a fresh take? Get an instant paraphrase of this document with our AI Paraphraser
Document Page
13ECONOMIC ASSIGNMENT
Reference list
Lark, T. J., Salmon, J. M., & Gibbs, H. K. (2015). Cropland expansion outpaces agricultural
and biofuel policies in the United States. Environmental Research Letters, 10(4),
044003.
Mankiw, N. G. (2014). Principles of macroeconomics. Cengage Learning.
Peet, R., & Hartwick, E. (2015). Theories of development: Contentions, arguments,
alternatives. Guilford Publications.
Sakanko, M. A., & David, J. (2018). An Econometric Validation of Malthusian Theory:
Evidence in Nigeria. Signifikan: Jurnal Ilmu Ekonomi, 7(1).
Watch the U.S. transition from a manufacturing economy to a service economy, in one gif.
(2018). Washington Post. Retrieved 18 March 2018, from
https://www.washingtonpost.com/blogs/govbeat/wp/2014/09/03/watch-the-u-s-
transition-from-a-manufacturing-economy-to-a-service-economy-in-one-gif/?
utm_term=.56ad7ad77a63
Data Source
Population growth (annual %) | Data. (2018). Data.worldbank.org. Retrieved 17 March
2018, from https://data.worldbank.org/indicator/NY.GDP.MKTP.KD.ZG
chevron_up_icon
1 out of 14
circle_padding
hide_on_mobile
zoom_out_icon
logo.png

Your All-in-One AI-Powered Toolkit for Academic Success.

Available 24*7 on WhatsApp / Email

[object Object]