US Trade Deficit: An Empirical Analysis - CSUF Economics 340
VerifiedAdded on 2023/06/10
|12
|3748
|360
Project
AI Summary
This paper provides an empirical analysis of the US trade deficit, exploring the impact of macroeconomic variables such as import prices, employment levels, consumer price index, exchange rates, import volume, and stock prices. Three different log-linear regression models are developed to analyze these factors, with findings suggesting that all variables except import prices contribute to a deterioration of the US trade balance. The analysis includes a literature review of previous studies on US trade deficits, econometric model development, and interpretation of estimated results, concluding with a summary of the findings. The research aims to model the US trade deficit, considering the effects of various macroeconomic indicators on US trade, and finds that employment, CPI, exchange rates, import and stock prices contribute to the deterioration of US trade balance. Desklib is a platform where students can find similar assignments and study resources.
Running Head: US TRADE DEFICIT: AN EMPIRICAL ANALYSIS
US Trade Deficit: An Empirical Analysis
Name of the Student
Name of the University
Course ID
US Trade Deficit: An Empirical Analysis
Name of the Student
Name of the University
Course ID
Paraphrase This Document
Need a fresh take? Get an instant paraphrase of this document with our AI Paraphraser
1US TRADE DEFICIT: AN EMPIRICAL ANALYSIS
Table of Contents
1. Introduction.............................................................................................................................................2
2. Literature Review....................................................................................................................................3
3. The Econometric Model of Trade Deficit................................................................................................4
4. Interpretation of Estimated Results..........................................................................................................6
5. Conclusion...............................................................................................................................................9
6. References list.......................................................................................................................................10
2US TRADE DEFICIT: AN EMPIRICAL ANALYSIS
1. Introduction
In a globally integrated world economy, there is a growing interdependence among countries.
Countries participate in world trade to increase to maximize economic welfare. However, excessive
dependence on import above its export may hinder economic growth by expanding its trade deficit.
International trade holds an important position in US economy (www.richmondfed.org, 2018). Trade
balance measures the extent of export over its import. When overseas purchase of a nation exceeds that of
its sales to overseas market then the nation experience a trade deficit. Trade deficit or trade surplus has
implication for the economy.
US has accounted a trade deficit of $566 billion in 2017. Total import of goods and services
accounted to be $2.895 trillion. As against this, total import was $2.329 trillion. The trade deficit in 2017
was higher than that in 2013. Recorded trade deficit in 2013 was $478 billion. One primary reason for
growing trade deficit is stronger dollar in between 2014 and 2016. The deficit however is lower than that
in 2006 (thebalance.com, 2018). The widening trade deficit has detrimental effect on the US economy as
it is mostly financed with borrowing or debt. The ability of US to borrow from its trading partners make it
possible to make more purchase from abroad. Another problem associated with persistent trade deficit
related with the competitiveness of the economy. Purchase of goods from abroad causes US originated
companies to lose their expertise in producing these products. Trade deficit leads to a deterioration in
investment-income balance of US (Eaton et al., 2016). This is due to an increase in growing indebtedness
of US because of borrowing from foreigners. The trade deficit though have an adverse effect on the entire
economy but effects are more severe for sectors that are more sensitive to trade.
Realizing the ongoing debt and its adverse effect on US economy, study of trade of US trade
deficit has become one important research topic. The present paper attempts to model US trade deficit
considering effect of different macroeconomic variables on US trade deficit. Three different log-linear
regression models are developed to analyze the impact of different macro variables. Variables that might
affect trade deficit are GDP, Consumer price index, exchange rate, government spending, prices of
imported good, stock price index and US job market. The variables considered for the current paper are
price of imported goods, employment level of US, Consumer Price Index, Exchange Rate, imports and
Stock prices. Each of these variables has its own channel to influence trade deficit. The paper finds all the
variables except import price contribute to a deterioration of US trade balance.
The rest of this research paper is organized as follows. Section 2 briefly discusses the previous
literature on US trade deficit, in section 3, three log-linear econometric model are developed to explain
⊘ This is a preview!⊘
Do you want full access?
Subscribe today to unlock all pages.
Trusted by 1+ million students worldwide
3US TRADE DEFICIT: AN EMPIRICAL ANALYSIS
different factors explaining trade deficit of US, Section 4 discusses the estimated result obtained from the
econometric models and section 5 concludes the paper with summarizing obtained results.
2. Literature Review
Trade balance presents difference between country’s export and import. Exports consist of goods
and services that a country sells to abroad. Import is the basket of goods and services that a country
purchases abroad. United State experienced a trade surplus from 1960 to 1975. Since 1975, the nation
however ran with a trade deficit. The trade deficit peaked up in 2006 when trade deficit stood at $753
billion accounting 5.6% of GDP. Following a decline in import trade deficit fell $381 billion during 2007-
2009. Trade deficit again increased to $560 billion during 2011 (Araujo, Mion & Ornelas, 2016). In US,
trade balance constitutes a major part of US current account and this comprises a significant portion of
nation’s balance of payment. Firms, household and government borrows from international capital market
when purchase of foreign good exceeds sells to foreigners.
Most studies on US trade finds that a rise in economic activity in domestic economy reflected in
an increased income raises import demand while an increase in economic activity in foreign countries
raises demand for export. An increase in relative price of imported goods lowers import the demand while
an increase in relative export price dampens export demand (Acemoglu et al., 2016). Previous literatures
claim that income elasticity of US import is relatively larger than income elasticity of US export.
The past studies analyzes different factors contributing to the growing trade deficit. Changing
dynamics of oil prices are often held responsible for widening trade deficit. Price of imported petroleum
in 2014 fell to $32.60 per barrel in 2016 from $91.23 per barrel in 2014 representing a fall by more than
60%. Price of oil per barrel again raised to $52 by December 2017 (Jackson, 2018). Crude oil price
continued to rise in 2018 with price reached to $70 per barrel in April 2018. In response to rising oil
price, import volume of crude oil remained almost flat as compared to its trend in 2016 (Baumeister &
Kilian, 2016). Increase in average crude oil price in combination with a small increase in import volume
in 2017, lead to an increase in total deficit in US merchandise trade associated mostly with energy import
deficit.
In addition to productivity, fiscal and monetary studies also attempt to find influence of stock
price on trade balance of US. The impact on stock price on trade balance is divided into two channels.
One is channel of wealth effect and other is channel of exchange rate. The rationale behind wealth effect
channel is as follows. This describes as stock price increases especially where the increase in stock prices
appeared to be permanent there is an increase in expected income of the household (Antonakakis, Gupta
& Tiwari, 2015). Increase in income expectation increase household consumption as well making it easier
Paraphrase This Document
Need a fresh take? Get an instant paraphrase of this document with our AI Paraphraser
4US TRADE DEFICIT: AN EMPIRICAL ANALYSIS
of business firms to undertake new investment opportunities. This lead to a decline in trade balance of the
specific country. However, as indicated by Simo-Kengne et al. (2015) in times of Stock market boom,
investors it might be possible that investors draw their wealth and reduces consumption. This implies an
ambiguous effect of stock price on trade balance (Simo-Kengne et al., 2015). Following exchange rate
channel, an increase rate increases short-term interest rate and inflation. This in turn results in an
appreciation of exchange rate worsening the trade balance.
3. The Econometric Model of Trade Deficit
This section develops three different log-linear regression models to develop to examine causes
of trade deficit in USA.
Model 1
In the first model, the two chosen variables influencing trade deficit are import prices and level of
employment. In the concerned regression model, employment and import prices are taken as independent
variables or regressors and monthly trade deficit is taken as dependent variable. Import price is adversely
related with import demand. That is with increase in import prices import demand increases and vice-
versa. A decrease in import demand leads to a decrease in trade deficit. US job market might also
influence trade deficits of US. As condition of US job market improves, more employment opportunities
are created. As income increases, there is more demand for import leading to an increase in trade deficit
(Acemoglu et al., 2016). The first log-linear regression model is structured as follows
ln Y t =α 0 +α1 X1 t + α2 X2 t + e
Y = US monthly trade deficits
X1 = Prices of imported goods
X2 = US employment level
Model 2
The second model evaluates the impact of Consumer Price Index and Exchange rate between yen
and dollar. Consumer Price Index is a measure of domestic price level or inflation. An increase in
Consumer Price Index indicates an increase in the rate of inflation. As domestic price increases, import
become relatively cheaper. As import increases, there is possibility of an increase in trade deficit as well
5US TRADE DEFICIT: AN EMPIRICAL ANALYSIS
(Arkolakis et al., 2015). Exchange rate is an important determinant of trade volume between nations. It
represents the value of one country’s currency in terms of another currency. A As currency depreciates
more dollar needs to be exchanged for getting one unit of foreign currency. This though implies a weak
position of domestic currency but is helpful in increasing export by making export relatively cheaper.
Japan is one vital trading partner of USA and ranks 4th in terms of goods export. Yen/Dollar exchange rate
is considered. An increase in exchange rate here implies an increased value of dollar against Yen
indicating an appreciation of dollar (Levy-Yeyati, Sturzenegger & Gluzmann, 2013). This in turn means
an increase in import volume and decline in export. This improves the trade balance by lowering trade
deficit. The second model is formed as
ln Y t =β0 +β1 X3 t + β2 X 4 t +e1
Y = US monthly trade deficits
X3 = Consumer Price Index
X4 = Exchange rate
Model 3
In third model, US trade deficit modeled considering import volume and S&P 500 stock prices.
An increase in import volume increases trade deficit. Another important macro variable that might
influence trade deficit is stock prices (Bernanke, Antonovics & Frank, 2015). Stock prices can affect trade
balance of a nation through two possible channels. One is wealth effect channel and other is exchange
rate channel. An increase in stock prices increases income of the household by increasing stock return.
Backed by household income, consumption increases. With this, firms get opportunities to finance new
investment. Increase in consumption decreases trade balance of the concerned nation. This is wealth
effect. A rise in stock prices have a positive impact on short-term interest rate and that of inflation. This
by appreciating US dollar worsens trade balance. This is exchange rate channel (Antonakakis, Gupta &
Tiwari, 2015). The model 3 is framed as follows
⊘ This is a preview!⊘
Do you want full access?
Subscribe today to unlock all pages.
Trusted by 1+ million students worldwide
6US TRADE DEFICIT: AN EMPIRICAL ANALYSIS
ln Y t =γ0 + γ1 X5 t + γ2 X6 t +e2
Y = US monthly trade deficits
X5 = Import Volume
X6 = Stock price.
4. Interpretation of Estimated Results
This section provides the result of estimation regression and provides interpretation in line with
economic theories.
Model 1
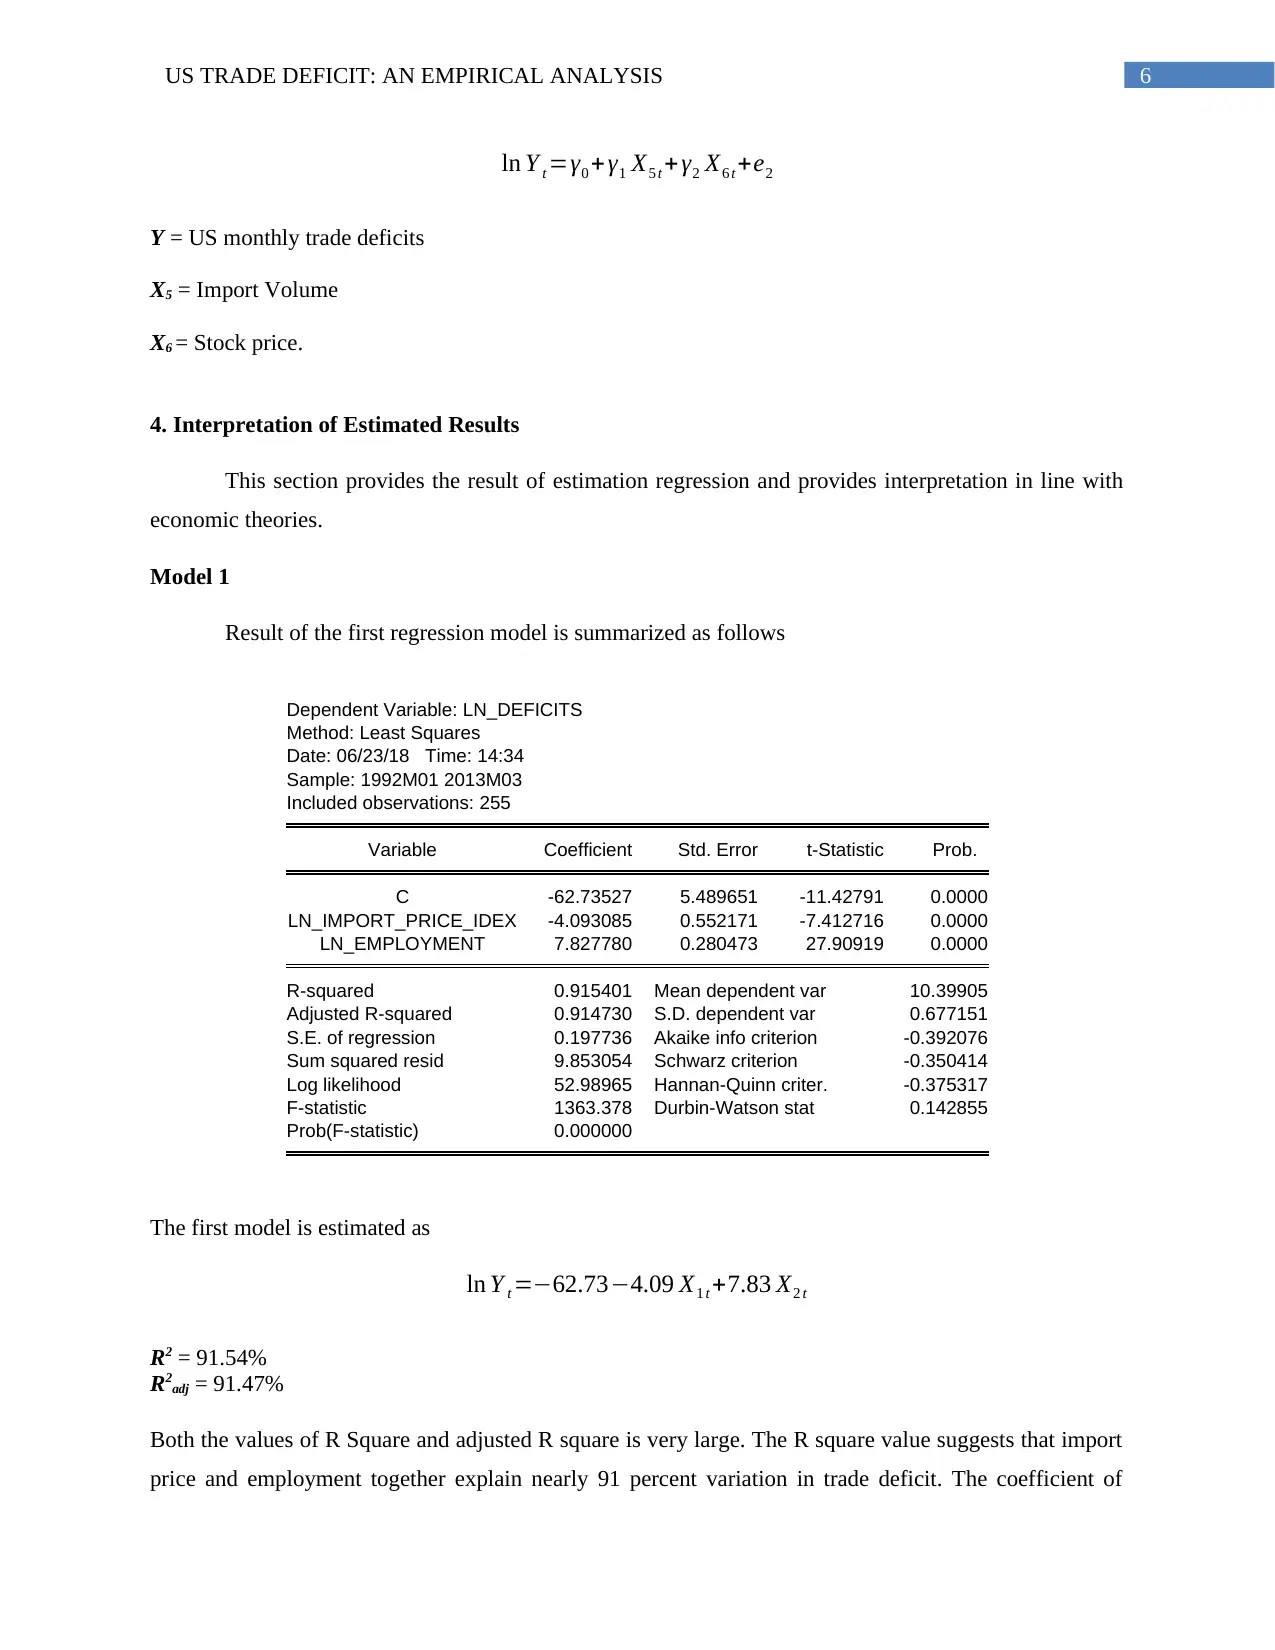
Result of the first regression model is summarized as follows
Dependent Variable: LN_DEFICITS
Method: Least Squares
Date: 06/23/18 Time: 14:34
Sample: 1992M01 2013M03
Included observations: 255
Variable Coefficient Std. Error t-Statistic Prob.
C -62.73527 5.489651 -11.42791 0.0000
LN_IMPORT_PRICE_IDEX -4.093085 0.552171 -7.412716 0.0000
LN_EMPLOYMENT 7.827780 0.280473 27.90919 0.0000
R-squared 0.915401 Mean dependent var 10.39905
Adjusted R-squared 0.914730 S.D. dependent var 0.677151
S.E. of regression 0.197736 Akaike info criterion -0.392076
Sum squared resid 9.853054 Schwarz criterion -0.350414
Log likelihood 52.98965 Hannan-Quinn criter. -0.375317
F-statistic 1363.378 Durbin-Watson stat 0.142855
Prob(F-statistic) 0.000000
The first model is estimated as
ln Y t =−62.73−4.09 X1 t +7.83 X2 t
R2 = 91.54%
R2adj = 91.47%
Both the values of R Square and adjusted R square is very large. The R square value suggests that import
price and employment together explain nearly 91 percent variation in trade deficit. The coefficient of
ln Y t =γ0 + γ1 X5 t + γ2 X6 t +e2
Y = US monthly trade deficits
X5 = Import Volume
X6 = Stock price.
4. Interpretation of Estimated Results
This section provides the result of estimation regression and provides interpretation in line with
economic theories.
Model 1
Result of the first regression model is summarized as follows
Dependent Variable: LN_DEFICITS
Method: Least Squares
Date: 06/23/18 Time: 14:34
Sample: 1992M01 2013M03
Included observations: 255
Variable Coefficient Std. Error t-Statistic Prob.
C -62.73527 5.489651 -11.42791 0.0000
LN_IMPORT_PRICE_IDEX -4.093085 0.552171 -7.412716 0.0000
LN_EMPLOYMENT 7.827780 0.280473 27.90919 0.0000
R-squared 0.915401 Mean dependent var 10.39905
Adjusted R-squared 0.914730 S.D. dependent var 0.677151
S.E. of regression 0.197736 Akaike info criterion -0.392076
Sum squared resid 9.853054 Schwarz criterion -0.350414
Log likelihood 52.98965 Hannan-Quinn criter. -0.375317
F-statistic 1363.378 Durbin-Watson stat 0.142855
Prob(F-statistic) 0.000000
The first model is estimated as
ln Y t =−62.73−4.09 X1 t +7.83 X2 t
R2 = 91.54%
R2adj = 91.47%
Both the values of R Square and adjusted R square is very large. The R square value suggests that import
price and employment together explain nearly 91 percent variation in trade deficit. The coefficient of
Paraphrase This Document
Need a fresh take? Get an instant paraphrase of this document with our AI Paraphraser
7US TRADE DEFICIT: AN EMPIRICAL ANALYSIS
import price is obtained as -4.09. Negative coefficient of import prices indicate an inverse relation
between import price and trade deficit. That is an increase in import price reduces trade deficit and vice-
versa. The coefficient thus has the expected sign. The coefficient also suggests that with 1 percent
increase in import prices trade deficit decrease by 4.09 percent. The coefficient of employment is 7.83.
The positive coefficient means there exists a positive relation between condition of US job market and
trade deficit. If employment increases by 1 percent, then trade deficit also increases by 7.83 percent. The
regression result thus satisfies the expectation made while developing the model. P value for both the
variables are 0.0000. The p value lower than the significance level means both the variables are
statistically significant determinants of trade deficits.
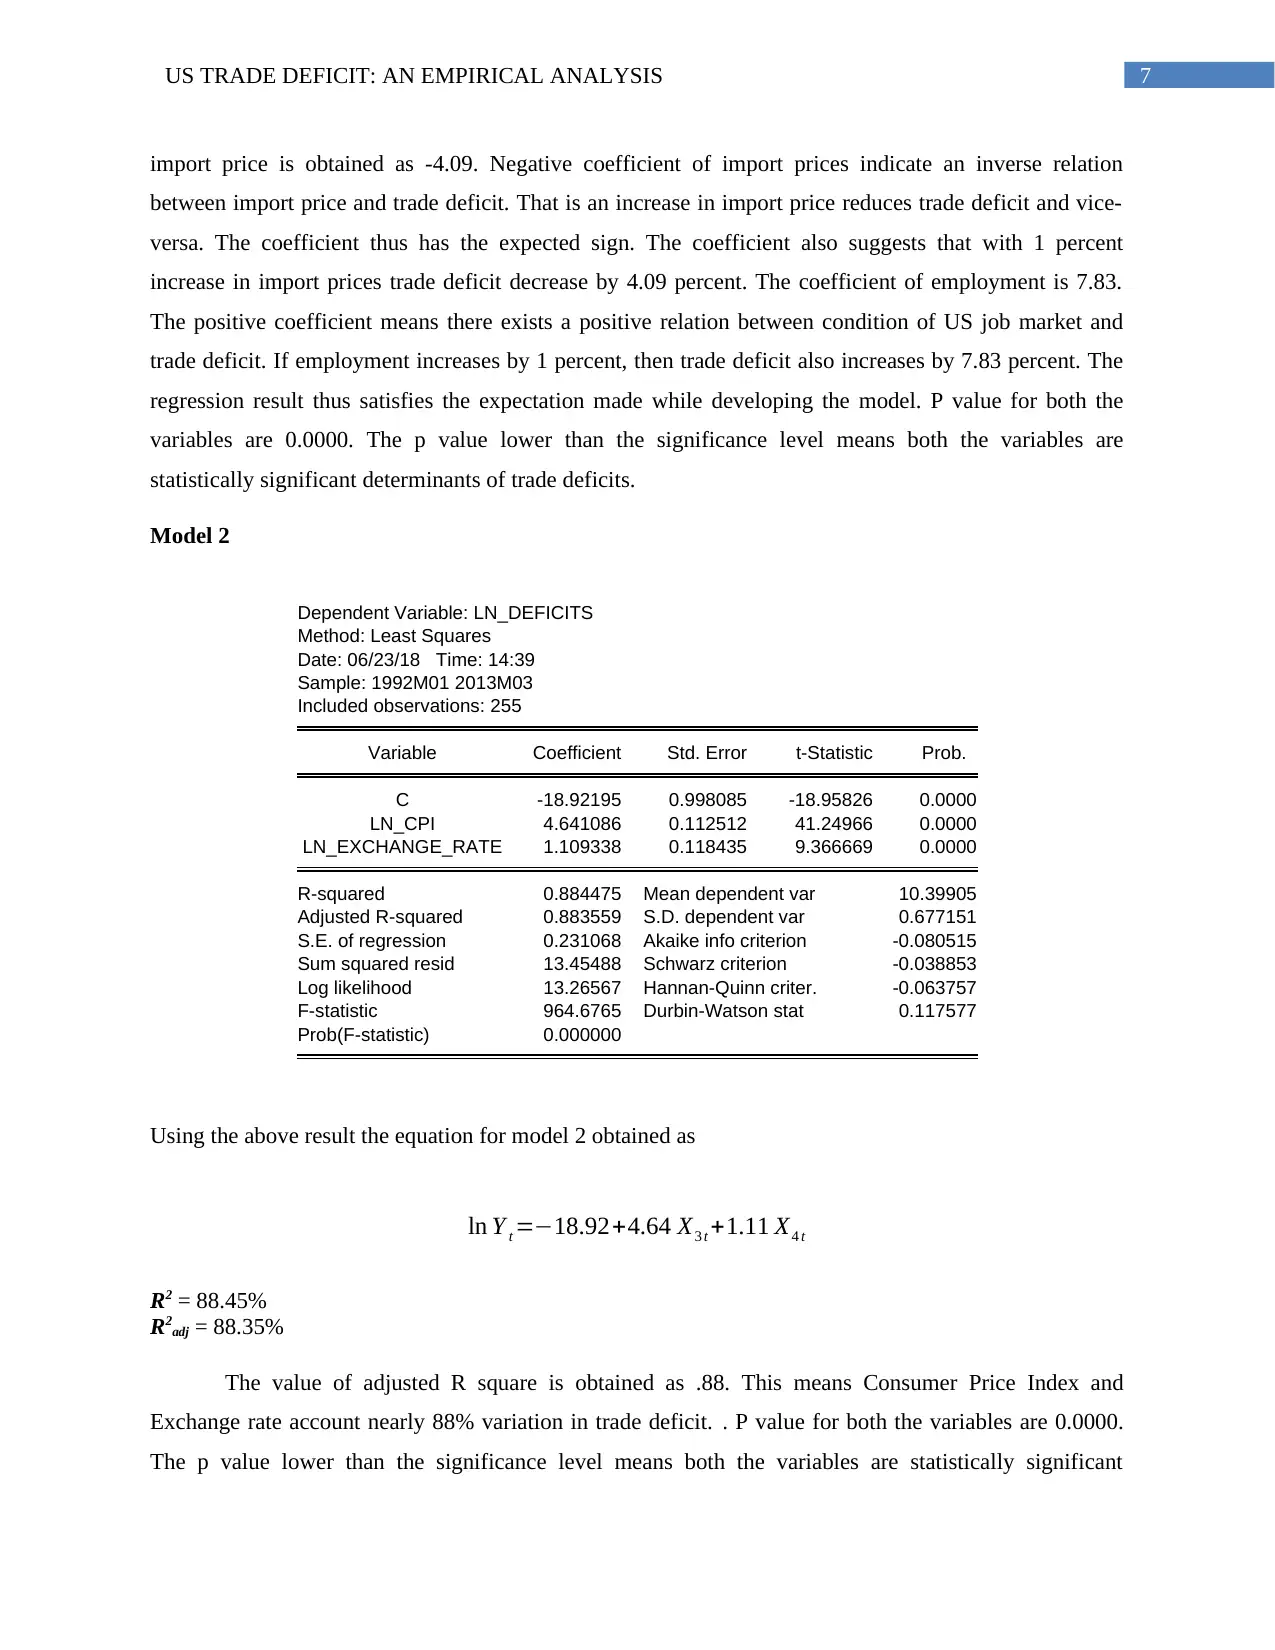
Model 2
Dependent Variable: LN_DEFICITS
Method: Least Squares
Date: 06/23/18 Time: 14:39
Sample: 1992M01 2013M03
Included observations: 255
Variable Coefficient Std. Error t-Statistic Prob.
C -18.92195 0.998085 -18.95826 0.0000
LN_CPI 4.641086 0.112512 41.24966 0.0000
LN_EXCHANGE_RATE 1.109338 0.118435 9.366669 0.0000
R-squared 0.884475 Mean dependent var 10.39905
Adjusted R-squared 0.883559 S.D. dependent var 0.677151
S.E. of regression 0.231068 Akaike info criterion -0.080515
Sum squared resid 13.45488 Schwarz criterion -0.038853
Log likelihood 13.26567 Hannan-Quinn criter. -0.063757
F-statistic 964.6765 Durbin-Watson stat 0.117577
Prob(F-statistic) 0.000000
Using the above result the equation for model 2 obtained as
ln Y t =−18.92+4.64 X3 t +1.11 X4 t
R2 = 88.45%
R2adj = 88.35%
The value of adjusted R square is obtained as .88. This means Consumer Price Index and
Exchange rate account nearly 88% variation in trade deficit. . P value for both the variables are 0.0000.
The p value lower than the significance level means both the variables are statistically significant
import price is obtained as -4.09. Negative coefficient of import prices indicate an inverse relation
between import price and trade deficit. That is an increase in import price reduces trade deficit and vice-
versa. The coefficient thus has the expected sign. The coefficient also suggests that with 1 percent
increase in import prices trade deficit decrease by 4.09 percent. The coefficient of employment is 7.83.
The positive coefficient means there exists a positive relation between condition of US job market and
trade deficit. If employment increases by 1 percent, then trade deficit also increases by 7.83 percent. The
regression result thus satisfies the expectation made while developing the model. P value for both the
variables are 0.0000. The p value lower than the significance level means both the variables are
statistically significant determinants of trade deficits.
Model 2
Dependent Variable: LN_DEFICITS
Method: Least Squares
Date: 06/23/18 Time: 14:39
Sample: 1992M01 2013M03
Included observations: 255
Variable Coefficient Std. Error t-Statistic Prob.
C -18.92195 0.998085 -18.95826 0.0000
LN_CPI 4.641086 0.112512 41.24966 0.0000
LN_EXCHANGE_RATE 1.109338 0.118435 9.366669 0.0000
R-squared 0.884475 Mean dependent var 10.39905
Adjusted R-squared 0.883559 S.D. dependent var 0.677151
S.E. of regression 0.231068 Akaike info criterion -0.080515
Sum squared resid 13.45488 Schwarz criterion -0.038853
Log likelihood 13.26567 Hannan-Quinn criter. -0.063757
F-statistic 964.6765 Durbin-Watson stat 0.117577
Prob(F-statistic) 0.000000
Using the above result the equation for model 2 obtained as
ln Y t =−18.92+4.64 X3 t +1.11 X4 t
R2 = 88.45%
R2adj = 88.35%
The value of adjusted R square is obtained as .88. This means Consumer Price Index and
Exchange rate account nearly 88% variation in trade deficit. . P value for both the variables are 0.0000.
The p value lower than the significance level means both the variables are statistically significant
8US TRADE DEFICIT: AN EMPIRICAL ANALYSIS
determinants of trade deficits. The coefficient of consumer price index is obtained as -4.64. This means
consumer price index has a positive influence on trade deficit. That is an increase in domestic inflation
increases trade deficit and vice-versa. Sign of the coefficient is consistent with economic rationale. The
exchange rate coefficient is 1.11. The coefficient suggests that, as the value of yen increases per dollar,
trade deficit increase as well. This is because an increase in yen per dollar indicates appreciation of dollar
and hence, an increase dollar through increase in import. If exchange rate increases by 1 percent, then
trade deficit also increases by 1.11 percent. The regression result thus satisfies the expectation made while
developing the model.
Model 3
Dependent Variable: LN_DEFICITS
Method: Least Squares
Date: 06/23/18 Time: 14:41
Sample: 1992M01 2013M03
Included observations: 255
Variable Coefficient Std. Error t-Statistic Prob.
C -5.886363 0.285663 -20.60596 0.0000
LN_IMPORTS__M$ 1.240388 0.043245 28.68294 0.0000
LN_STOCK_PRICE 0.287212 0.048370 5.937805 0.0000
R-squared 0.938482 Mean dependent var 10.39905
Adjusted R-squared 0.937994 S.D. dependent var 0.677151
S.E. of regression 0.168618 Akaike info criterion -0.710669
Sum squared resid 7.164856 Schwarz criterion -0.669007
Log likelihood 93.61031 Hannan-Quinn criter. -0.693911
F-statistic 1922.181 Durbin-Watson stat 0.125701
Prob(F-statistic) 0.000000
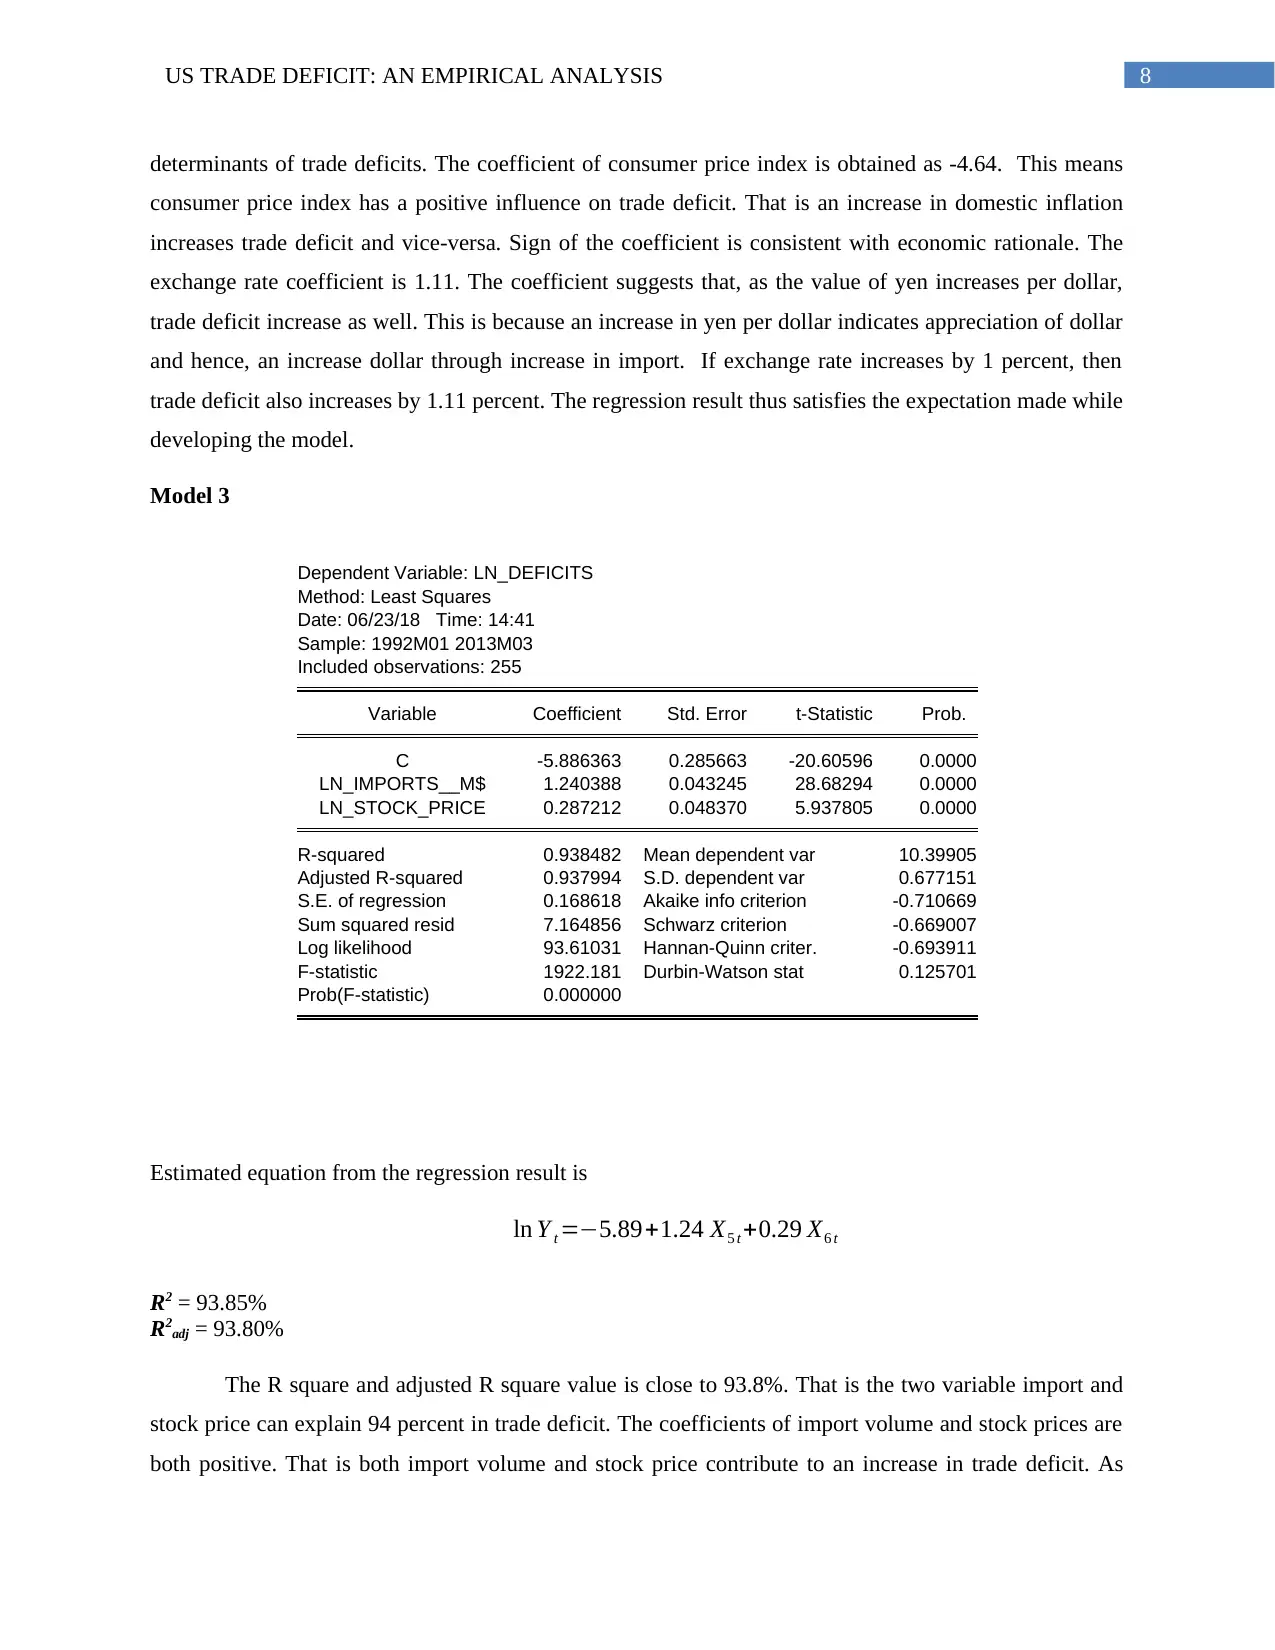
Estimated equation from the regression result is
ln Y t =−5.89+1.24 X5 t +0.29 X6 t
R2 = 93.85%
R2adj = 93.80%
The R square and adjusted R square value is close to 93.8%. That is the two variable import and
stock price can explain 94 percent in trade deficit. The coefficients of import volume and stock prices are
both positive. That is both import volume and stock price contribute to an increase in trade deficit. As
determinants of trade deficits. The coefficient of consumer price index is obtained as -4.64. This means
consumer price index has a positive influence on trade deficit. That is an increase in domestic inflation
increases trade deficit and vice-versa. Sign of the coefficient is consistent with economic rationale. The
exchange rate coefficient is 1.11. The coefficient suggests that, as the value of yen increases per dollar,
trade deficit increase as well. This is because an increase in yen per dollar indicates appreciation of dollar
and hence, an increase dollar through increase in import. If exchange rate increases by 1 percent, then
trade deficit also increases by 1.11 percent. The regression result thus satisfies the expectation made while
developing the model.
Model 3
Dependent Variable: LN_DEFICITS
Method: Least Squares
Date: 06/23/18 Time: 14:41
Sample: 1992M01 2013M03
Included observations: 255
Variable Coefficient Std. Error t-Statistic Prob.
C -5.886363 0.285663 -20.60596 0.0000
LN_IMPORTS__M$ 1.240388 0.043245 28.68294 0.0000
LN_STOCK_PRICE 0.287212 0.048370 5.937805 0.0000
R-squared 0.938482 Mean dependent var 10.39905
Adjusted R-squared 0.937994 S.D. dependent var 0.677151
S.E. of regression 0.168618 Akaike info criterion -0.710669
Sum squared resid 7.164856 Schwarz criterion -0.669007
Log likelihood 93.61031 Hannan-Quinn criter. -0.693911
F-statistic 1922.181 Durbin-Watson stat 0.125701
Prob(F-statistic) 0.000000
Estimated equation from the regression result is
ln Y t =−5.89+1.24 X5 t +0.29 X6 t
R2 = 93.85%
R2adj = 93.80%
The R square and adjusted R square value is close to 93.8%. That is the two variable import and
stock price can explain 94 percent in trade deficit. The coefficients of import volume and stock prices are
both positive. That is both import volume and stock price contribute to an increase in trade deficit. As
⊘ This is a preview!⊘
Do you want full access?
Subscribe today to unlock all pages.
Trusted by 1+ million students worldwide
9US TRADE DEFICIT: AN EMPIRICAL ANALYSIS
import volume continues to increase, trade deficit also increases. The corresponding coefficient is 1.24
meaning for one unit increase in import trade deficit increases by 1.24 unit. The coefficient of stock price
is 0.28. The stock price elasticity suggests with 1 percent increase in S&P 500 Stock prices trade deficit
increases by 0.28%. Both the variables are found to be statistically significant as p value for both is
obtained as 0.0000, which is less than the level of significance 0.05.
5. Conclusion
The paper briefly analyzes the dynamics of US trade deficit. Trade deficit precisely describes a
situation where import exceeds imports. In the last few years, US has accounted an increasing trend in its
trade deficit. Trade deficit in recent years though has declined as compared to that in 2005-2006; the
sizable trade deficit remains a matter of concern for US economy. Widening gap between export and
import hinders growth prospects of the economy by raising indebtedness of the nation. Several researches
have been conducted on US trade deficit. These studies find expansion in economic activity might lead to
an expansion in import demand aggravating the problem of trade deficit. Some studies have also stressed
that fluctuation in global oil and stock price influences trade balance of US. The present paper models
US trade deficit using variables such as import prices, condition of US job market, movement of
Consumer Price Index, exchange rate, import volume and stock price. The first model reveals that import
price has an adverse effect on trade deficit while the employment has a positive influence on trade deficit.
From the second model, both consumer prices and exchange rate found to have a positive effect on
raising trade deficit. The third model has found that an increase in stock price increase trade deficit. Trade
deficit also increases with an increase in import.
The paper though tries to consider as many variables as possible to find the influence on trade
deficit but there remain some variables that is not considered in the paper. Such variables include GDP,
government spending and others. This makes the paper limited in scope. Further researches can be
conducted to find out the impact of these variables on US trade deficit.
Paraphrase This Document
Need a fresh take? Get an instant paraphrase of this document with our AI Paraphraser
10US TRADE DEFICIT: AN EMPIRICAL ANALYSIS
6. References list
Acemoglu, D., Autor, D., Dorn, D., Hanson, G. H., & Price, B. (2016). Import competition and the great
US employment sag of the 2000s. Journal of Labor Economics, 34(S1), S141-S198.
Acemoglu, D., Autor, D., Dorn, D., Hanson, G. H., & Price, B. (2016). Import competition and the great
US employment sag of the 2000s. Journal of Labor Economics, 34(S1), S141-S198.
Amadeo, K. (2018). How the US Trade Deficit Hurts the Economy. Retrieved from
https://www.thebalance.com/u-s-trade-deficit-causes-effects-trade-partners-3306276
Antonakakis, N., Gupta, R., & Tiwari, A. K. (2015). Time-Varying Correlations between Trade Balance
and Stock Prices in the United States over the Period 1792 to 2013 (No. 2015100).
Araujo, L., Mion, G., & Ornelas, E. (2016). Institutions and export dynamics. Journal of International
Economics, 98, 2-20.
Arkolakis, C., Costinot, A., Donaldson, D., & Rodríguez-Clare, A. (2015). The elusive pro-competitive
effects of trade. The Review of Economic Studies.
Baumeister, C., & Kilian, L. (2016). Lower oil prices and the US economy: Is this time
different?. Brookings Papers on Economic Activity, 2016(2), 287-357.
Bernanke, B., Antonovics, K., & Frank, R. (2015). Principles of macroeconomics. McGraw-Hill Higher
Education.
Eaton, J., Kortum, S., Neiman, B., & Romalis, J. (2016). Trade and the global recession. American
Economic Review, 106(11), 3401-38.
Jackson, J. K. (2018). US Trade Deficit and the Impact of Changing Oil Prices. Library of Congress
Washington Dc Congressional Research Service.
Johnson, R. C., & Noguera, G. (2012). Accounting for intermediates: Production sharing and trade in
value added. Journal of international Economics, 86(2), 224-236.
Levy-Yeyati, E., Sturzenegger, F., & Gluzmann, P. A. (2013). Fear of appreciation. Journal of
Development Economics, 101, 233-247.
Romero, J. (2018). Balance of Trade. Retrieved from
https://www.richmondfed.org/-/media/richmondfedorg/publications/research/econ_focus/2012/
q2-3/pdf/jargon_alert.pdf
11US TRADE DEFICIT: AN EMPIRICAL ANALYSIS
Simo-Kengne, B., Miller, S., Gupta, R., & Aye, G. (2015). Time-Varying E_ects of Housing and Stock
Returns on U.S. Consumption. The Journal of Real Estate Finance and Economics 50 (3),
339(354).
Simo-Kengne, B., Miller, S., Gupta, R., & Aye, G. (2015). Time-Varying E_ects of Housing and Stock
Returns on U.S. Consumption. The Journal of Real Estate Finance and Economics 50 (3),
339(354).
⊘ This is a preview!⊘
Do you want full access?
Subscribe today to unlock all pages.
Trusted by 1+ million students worldwide
1 out of 12
Related Documents


Your All-in-One AI-Powered Toolkit for Academic Success.
+13062052269
info@desklib.com
Available 24*7 on WhatsApp / Email
![[object Object]](/_next/static/media/star-bottom.7253800d.svg)
Unlock your academic potential
Copyright © 2020–2026 A2Z Services. All Rights Reserved. Developed and managed by ZUCOL.