Economics Report: Analysis of the USA Economy (Course ID: ECON101)
VerifiedAdded on 2023/01/10
|16
|3141
|43
Report
AI Summary
This economics report provides a detailed analysis of the USA economy, examining key indicators such as real GDP, real GDP growth rate, and per capita real GDP to assess output performance. It delves into the labor market, discussing different types of unemployment (structural, frictional, and cyclical) and the trend of the unemployment rate, alongside government measures to achieve full employment. The report also explores price level analysis, explaining inflation, its causes (demand-pull and cost-push), and the trend of the inflation rate, including government policies to maintain price stability. The analysis covers the period from 2008 to 2018, highlighting the impact of the global financial crisis and government interventions like the Troubled Asset Relief Program and the American Recovery and Reinvestment Act. The report also examines the role of the Federal Reserve in controlling inflation through monetary policy tools.
ECONOMICS
Economics
Name of the Student
Name of the University
Course ID
Economics
Name of the Student
Name of the University
Course ID
Paraphrase This Document
Need a fresh take? Get an instant paraphrase of this document with our AI Paraphraser
1ECONOMICS
Introduction
The economy of USA is known as one of the most developed mixed economy. In
terms of nominal GDP the country ranks first while in terms of purchasing power parity the
nation stands second. The natural resources and associated sectors developed based on these
resource has made USA one of the largest economy of the world (Imf.org. 2018). USA is
blessed with the abundance of six primary natural resources. The nation possesses a large
area of land mass controlled by single political system. Two large coastlines bordered the
nation that earlier provided food and later ports to help in commerce. The country has large
acres of fertile land that help in the development of fertile land. USA has abundant fresh
water.
The industrial sector of USA is second largest in the world constituting a real output
valued US$2 trillion in the first quarter of 2018. The industrial sector is further subdivide into
different sectors. Real estate along with Renting and Leasing account the largest share of
GDP. The sector plays an integrated role in US economy. The next important sector is
Finance and Insurance sector contributing 8 percent in GDP. The sector particularly helps
the economy to facilitate export. The Health and Social Care industry makes up a significant
portion of USA’s GDP (Sawe 2019). Besides these, other important industries of USA
include Durable Manufacturing, Retail Trade, Wholesale Trade, Non-Durable
Manufacturing and Information industry.
Production output performance analysis
The first primary determinant of economic performance of a nation is the aggregate
output. One composite indicator of aggregate output of a nation is Gross Domestic Product.
In the essay, output performance of USA has been analyzed in terms of real GDP, real GDP
growth rate and per capita real GDP.
2ECONOMICS
Real GDP
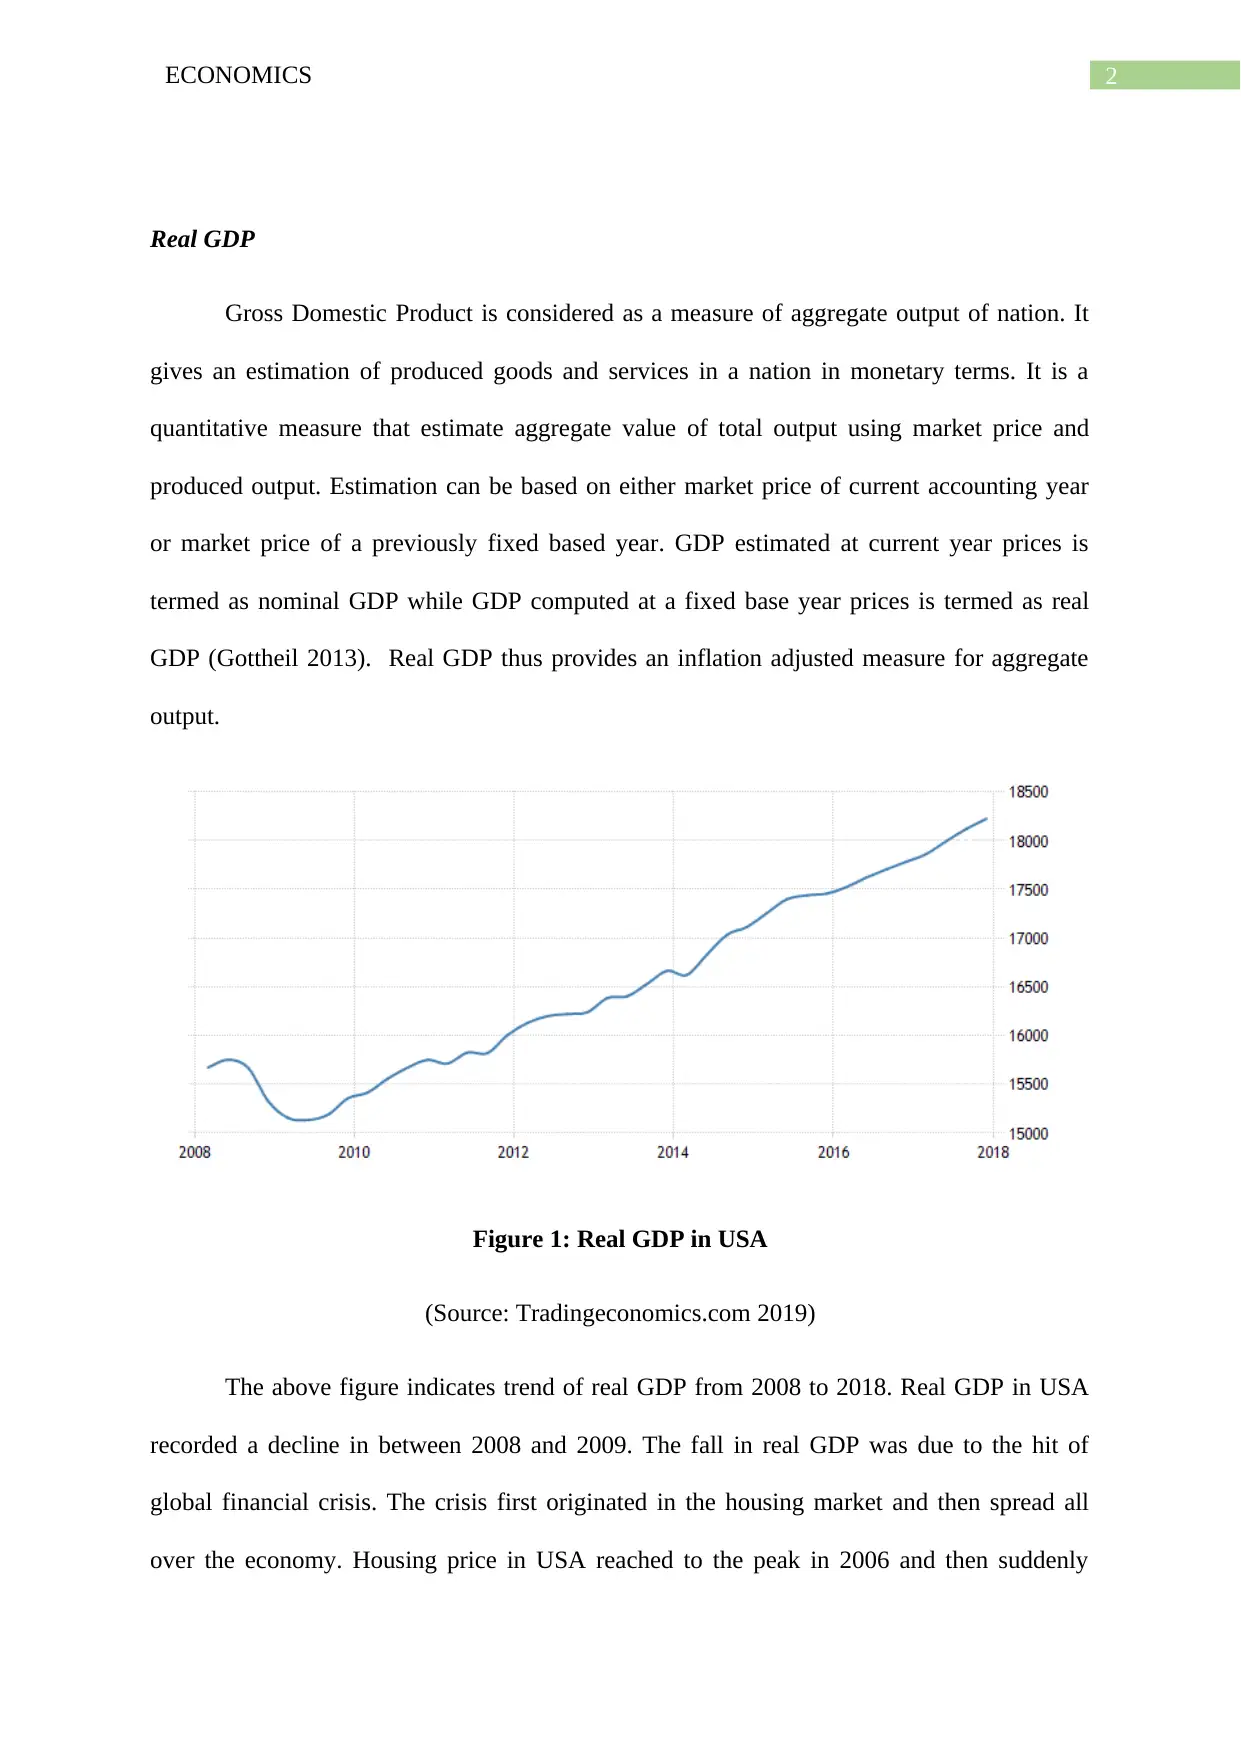
Gross Domestic Product is considered as a measure of aggregate output of nation. It
gives an estimation of produced goods and services in a nation in monetary terms. It is a
quantitative measure that estimate aggregate value of total output using market price and
produced output. Estimation can be based on either market price of current accounting year
or market price of a previously fixed based year. GDP estimated at current year prices is
termed as nominal GDP while GDP computed at a fixed base year prices is termed as real
GDP (Gottheil 2013). Real GDP thus provides an inflation adjusted measure for aggregate
output.
Figure 1: Real GDP in USA
(Source: Tradingeconomics.com 2019)
The above figure indicates trend of real GDP from 2008 to 2018. Real GDP in USA
recorded a decline in between 2008 and 2009. The fall in real GDP was due to the hit of
global financial crisis. The crisis first originated in the housing market and then spread all
over the economy. Housing price in USA reached to the peak in 2006 and then suddenly
Real GDP
Gross Domestic Product is considered as a measure of aggregate output of nation. It
gives an estimation of produced goods and services in a nation in monetary terms. It is a
quantitative measure that estimate aggregate value of total output using market price and
produced output. Estimation can be based on either market price of current accounting year
or market price of a previously fixed based year. GDP estimated at current year prices is
termed as nominal GDP while GDP computed at a fixed base year prices is termed as real
GDP (Gottheil 2013). Real GDP thus provides an inflation adjusted measure for aggregate
output.
Figure 1: Real GDP in USA
(Source: Tradingeconomics.com 2019)
The above figure indicates trend of real GDP from 2008 to 2018. Real GDP in USA
recorded a decline in between 2008 and 2009. The fall in real GDP was due to the hit of
global financial crisis. The crisis first originated in the housing market and then spread all
over the economy. Housing price in USA reached to the peak in 2006 and then suddenly
⊘ This is a preview!⊘
Do you want full access?
Subscribe today to unlock all pages.
Trusted by 1+ million students worldwide
3ECONOMICS
started to decline since last half of 2007. Housing market crashed in 2008 resulting in an
economy wide crisis (Chen et al. 2016). USA economy recovered at a relatively slower pace
from the recession. Since then USA recorded a steady rise in the real GDP.
Real GDP growth rate
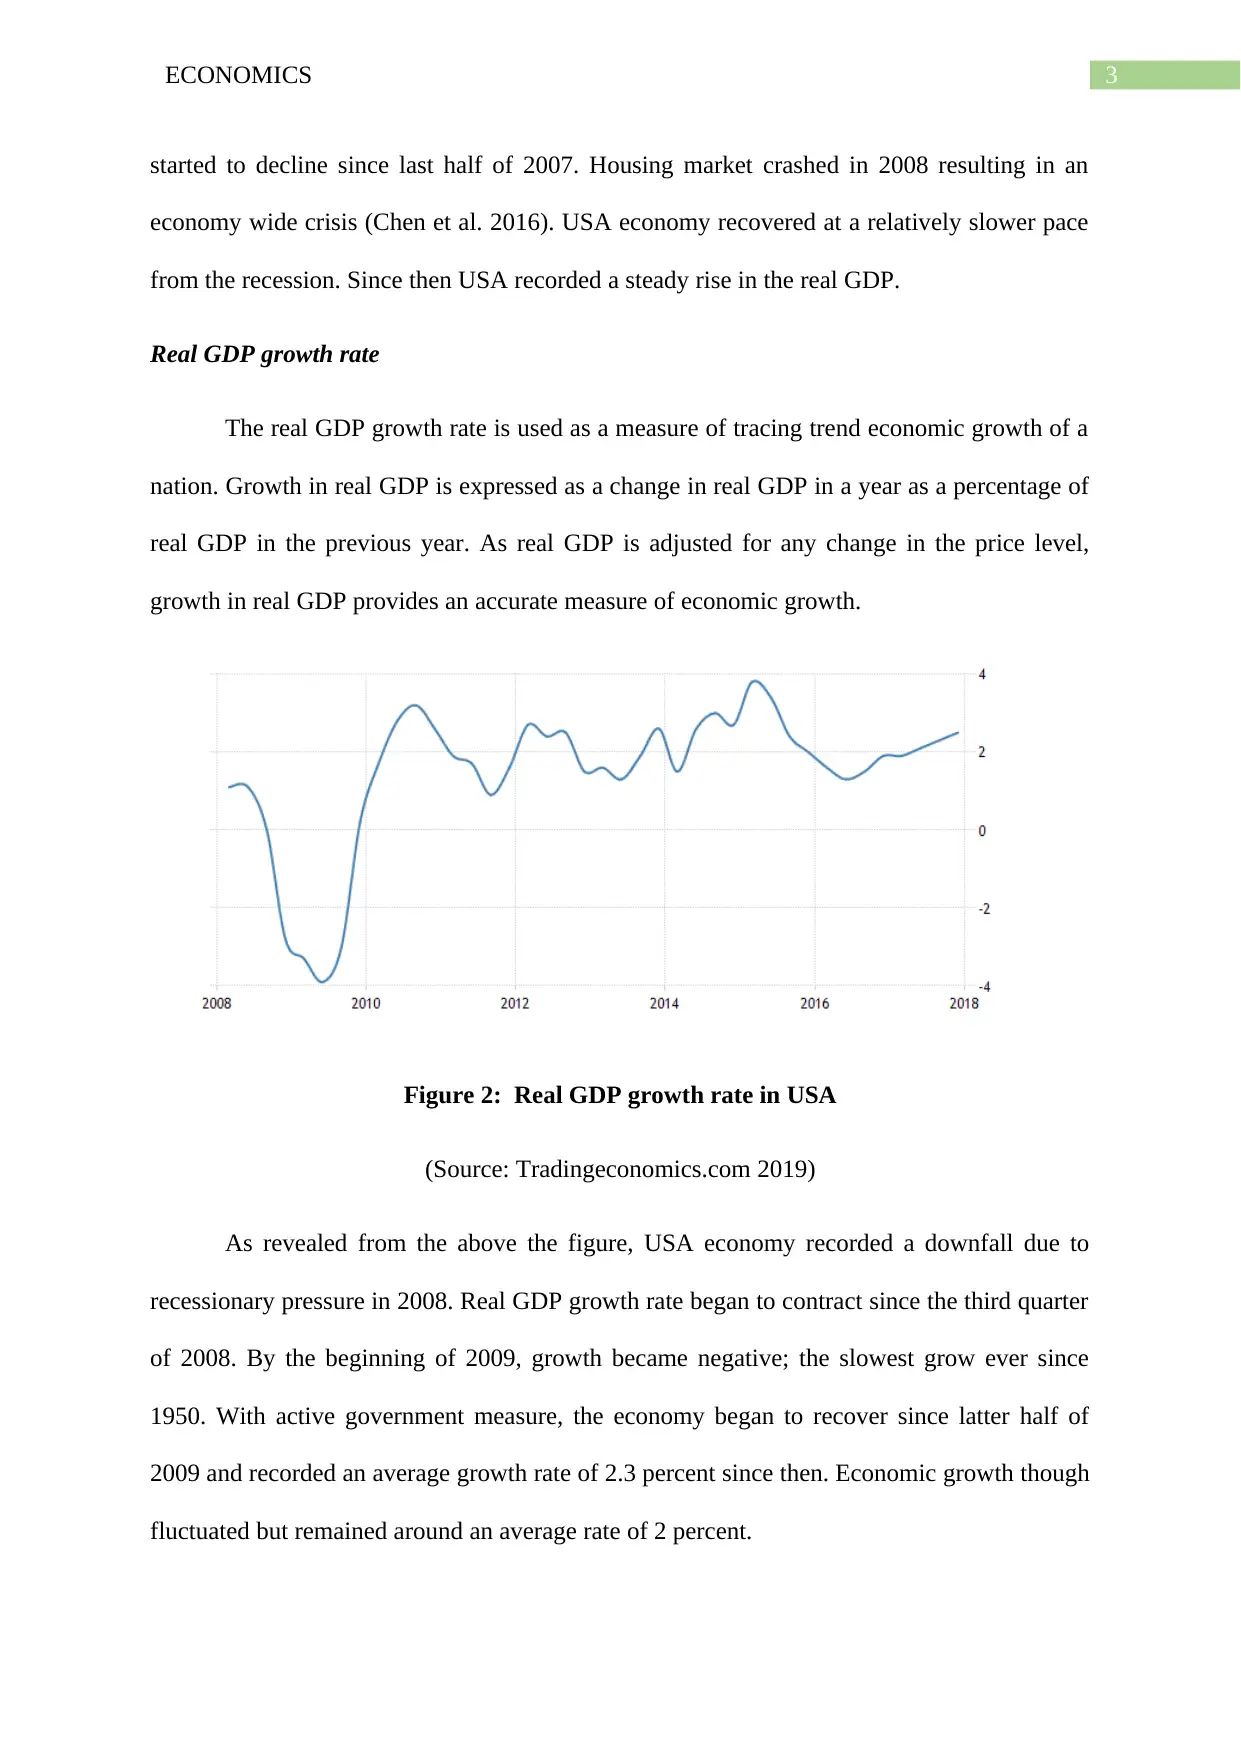
The real GDP growth rate is used as a measure of tracing trend economic growth of a
nation. Growth in real GDP is expressed as a change in real GDP in a year as a percentage of
real GDP in the previous year. As real GDP is adjusted for any change in the price level,
growth in real GDP provides an accurate measure of economic growth.
Figure 2: Real GDP growth rate in USA
(Source: Tradingeconomics.com 2019)
As revealed from the above the figure, USA economy recorded a downfall due to
recessionary pressure in 2008. Real GDP growth rate began to contract since the third quarter
of 2008. By the beginning of 2009, growth became negative; the slowest grow ever since
1950. With active government measure, the economy began to recover since latter half of
2009 and recorded an average growth rate of 2.3 percent since then. Economic growth though
fluctuated but remained around an average rate of 2 percent.
started to decline since last half of 2007. Housing market crashed in 2008 resulting in an
economy wide crisis (Chen et al. 2016). USA economy recovered at a relatively slower pace
from the recession. Since then USA recorded a steady rise in the real GDP.
Real GDP growth rate
The real GDP growth rate is used as a measure of tracing trend economic growth of a
nation. Growth in real GDP is expressed as a change in real GDP in a year as a percentage of
real GDP in the previous year. As real GDP is adjusted for any change in the price level,
growth in real GDP provides an accurate measure of economic growth.
Figure 2: Real GDP growth rate in USA
(Source: Tradingeconomics.com 2019)
As revealed from the above the figure, USA economy recorded a downfall due to
recessionary pressure in 2008. Real GDP growth rate began to contract since the third quarter
of 2008. By the beginning of 2009, growth became negative; the slowest grow ever since
1950. With active government measure, the economy began to recover since latter half of
2009 and recorded an average growth rate of 2.3 percent since then. Economic growth though
fluctuated but remained around an average rate of 2 percent.
Paraphrase This Document
Need a fresh take? Get an instant paraphrase of this document with our AI Paraphraser
4ECONOMICS
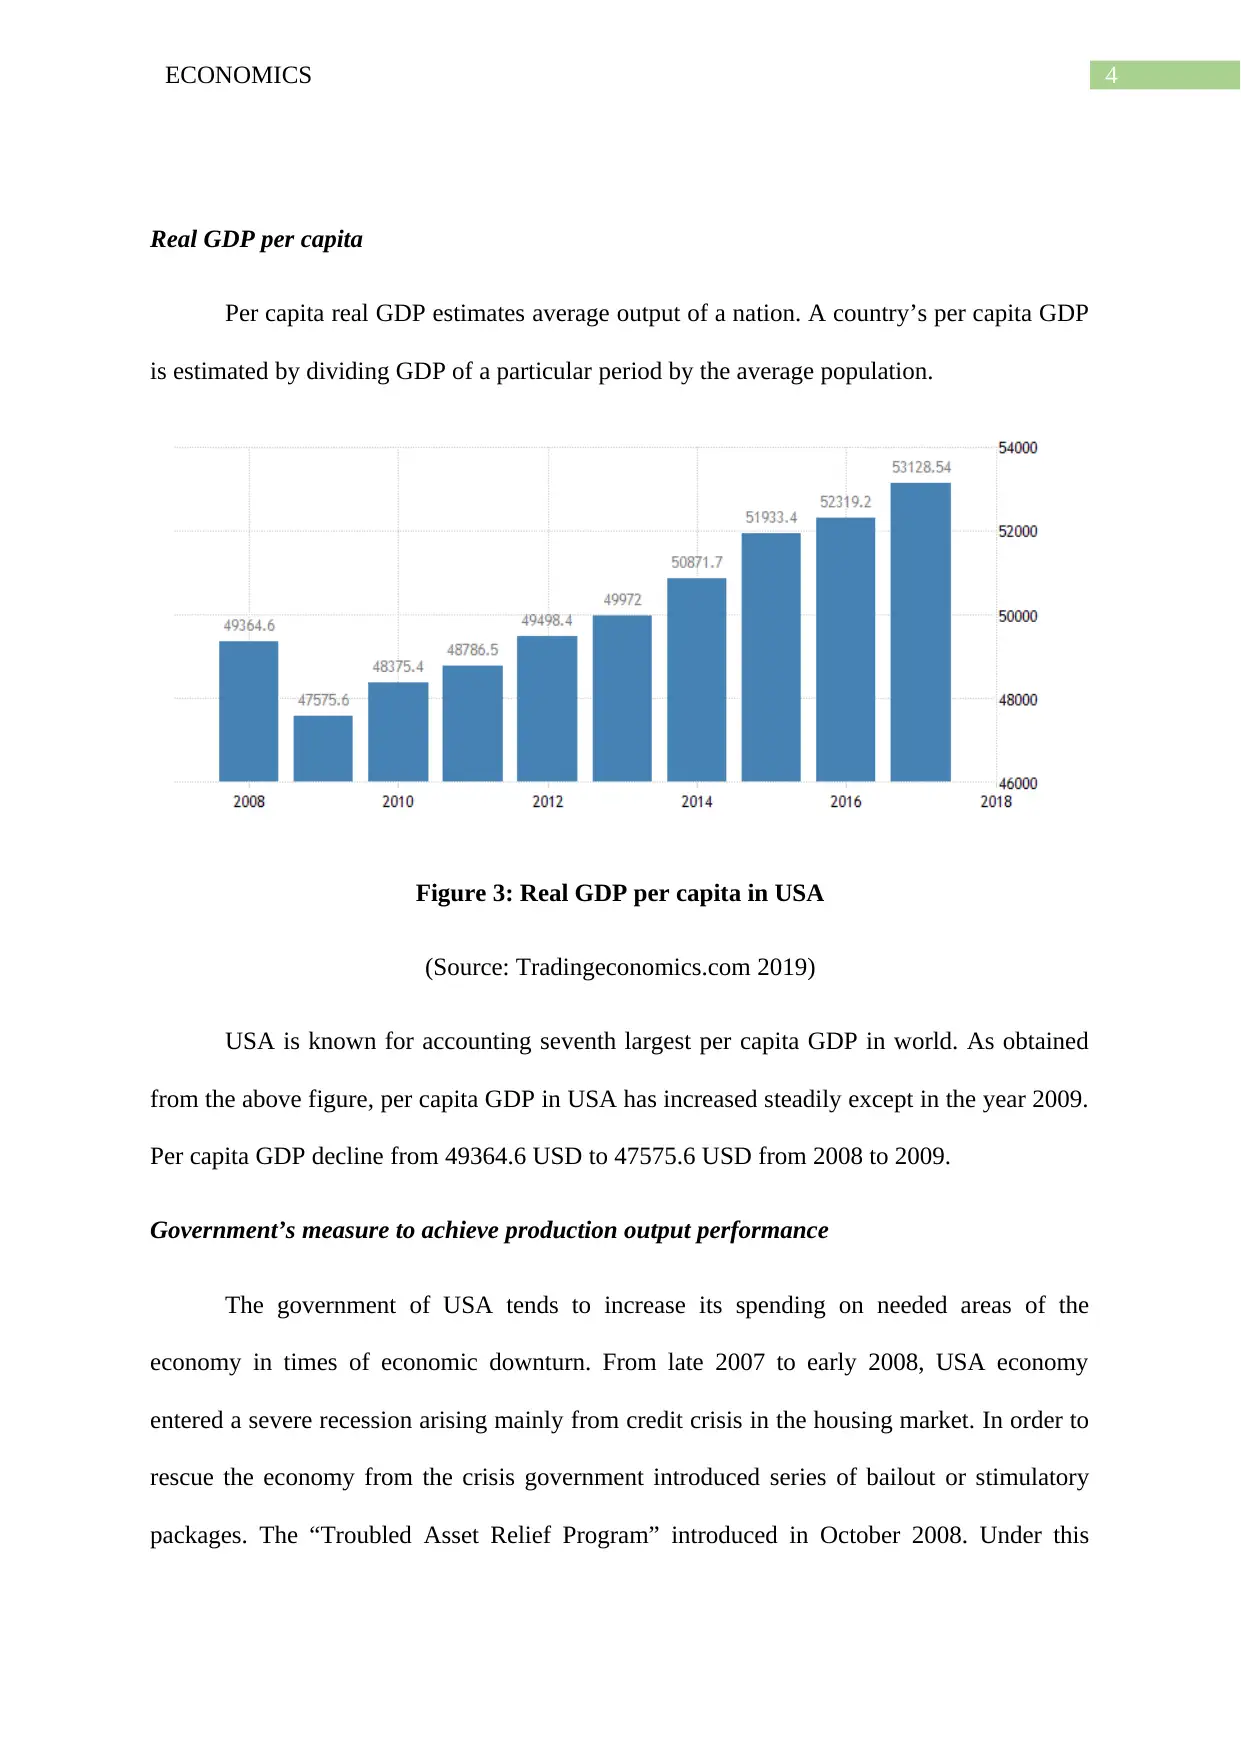
Real GDP per capita
Per capita real GDP estimates average output of a nation. A country’s per capita GDP
is estimated by dividing GDP of a particular period by the average population.
Figure 3: Real GDP per capita in USA
(Source: Tradingeconomics.com 2019)
USA is known for accounting seventh largest per capita GDP in world. As obtained
from the above figure, per capita GDP in USA has increased steadily except in the year 2009.
Per capita GDP decline from 49364.6 USD to 47575.6 USD from 2008 to 2009.
Government’s measure to achieve production output performance
The government of USA tends to increase its spending on needed areas of the
economy in times of economic downturn. From late 2007 to early 2008, USA economy
entered a severe recession arising mainly from credit crisis in the housing market. In order to
rescue the economy from the crisis government introduced series of bailout or stimulatory
packages. The “Troubled Asset Relief Program” introduced in October 2008. Under this
5ECONOMICS
program government, the federal government spent USD $700 billion to stabilize the
financial system. The American Recovery and Reinvestment Act introduced during this time
contained a series of tax relief and spending measure totaling $787 billion. The government
enhanced energy security in terms of promoting an integrated, transparent and diversifying
energy market and encourage appropriate investment in energy sector in order to increase
access to the energy sector and encourage economic growth. Government strengthens the
private sector by helping business to grow profits and invest in US market. Government
reduces regulation to assist allow companies to grow (state.gov 2019). Recently, government
has introduced a large program for infrastructural investment. The proposed federal
government funding for the program is $200 billion.
Labor market analysis
Unemployment and its type
Unemployment defines a condition of labor market where some members of labor
force are not able to find a job are willing to get a full-time employment. In an economy,
people remain unemployed for different reasons. Based on the different scenarios of
unemployment, there are three major form of unemployment (Mankiw 2014). These are
Structural unemployment, Frictional unemployment and cyclical unemployment.
Structural unemployment
Structural unemployment in an economy occurs due to structural shift in the
economy-creating mismatch between skills of workers and available jobs. An example of
structural unemployment is unemployment created due to replacement of machine workers
with the robots.
Frictional unemployment
⊘ This is a preview!⊘
Do you want full access?
Subscribe today to unlock all pages.
Trusted by 1+ million students worldwide
6ECONOMICS
Frictional unemployment is the unemployment suffered by people in moving between
jobs. This is the time when labors leave their old jobs have not yet found a new job. People
mostly leave their jobs voluntarily to get some better jobs. Frictional unemployment is also
observed among students newly entered the labor force.
Cyclical unemployment
Cyclical unemployment is the unemployment occurred due to business cycle
contraction. During business cycle, contraction there is rapid decline in demand for goods
and services in the economy. This forces firms to lay off workers resulting in cyclical
unemployment.
Types of unemployment in USA
The economy of USA experiences three major types of unemployment in some forms.
Structural unemployment in US exits because of two main reasons. First is technological
advances in the existing industry and the second is trade agreement. Frictional unemployment
is observed among students just graduating from college, mothers who have rejoined the
labor force after raising their children or a construction worker shifting to Arizona in winter
(Summers, 2014). USA economy experienced several recession in past years and faced the
associated problem of cyclical unemployment. Examples of cyclical unemployment include
unemployment created during great depression of 1929, tech crash in 2000 and financial
crisis of 2008.
Paraphrase This Document
Need a fresh take? Get an instant paraphrase of this document with our AI Paraphraser
7ECONOMICS
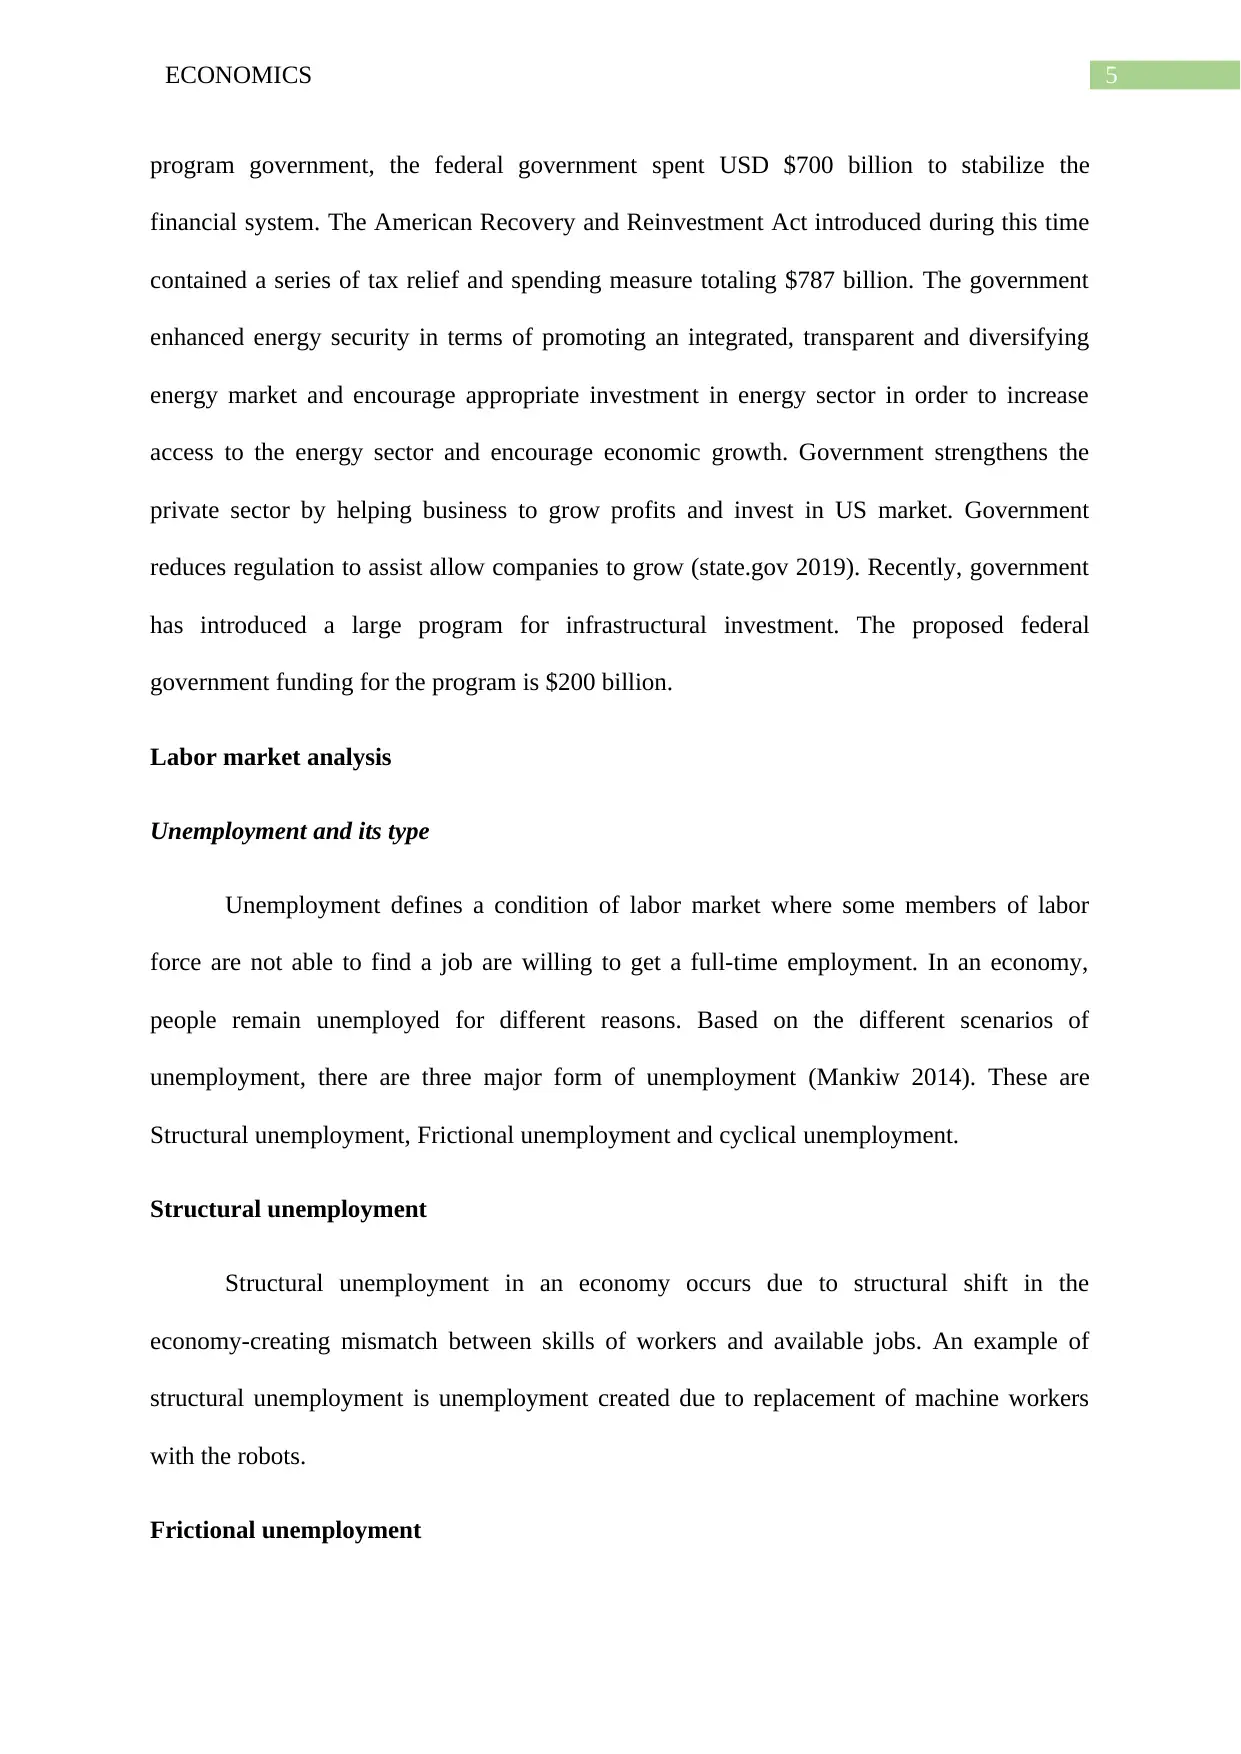
Trend unemployment rate in USA
Figure 4: Unemployment rate in USA
(Source: Tradingeconomics.com 2019)
Unemployment rate in United State fluctuated rapidly especially during economic
recession. Rate of unemployment increased from a low level of 4.7 percent in 2008 to a high
level of 10.1 percent during 2009 (Cunningham 2017). Unemployment rate rose significantly
due to the effect of housing bubble burst and collapse of Wall Street. Different employment
support program and expenditures on social security scheme contributed to labor market
recovery. Since then unemployment in the economy fell sharply and reached close to the rate
before the crisis. During economic recovery, jobs were created in areas such as
professionals, management and related areas and service occupation contributing to lower
unemployment rate in the economy (whitehouse.gov 2018).
Government measures to achieve full employment
USA’s government has made continuous effort to attain full employment or at least
close to full employment in the economy. In times of recession, the economy suffers from the
problem of cyclical unemployment. In order to combat unemployment and restore full
8ECONOMICS
employment government takes either expansionary monetary policy or expansionary fiscal
policy. Expansionary monetary policy is introduced in the economy through reduction of
federal fund rate. Under expansionary fiscal policy, government directly increases spending
on government employment programs. Examples includes New deal and Economic Stimulus
Program in 2009 (Hall 2015). The federal government plays an important role for training
displaced and disadvantaged workers. Major programs are funded by Department of
Education and Department of Labor. Government also funds valuable and complementary
tasks for providing reemployment services.
Price level analysis
Inflation and causes of inflation
Inflation in an economy refers to a situation of sustained increase in general price
level. The two main causes of inflation are discussed below
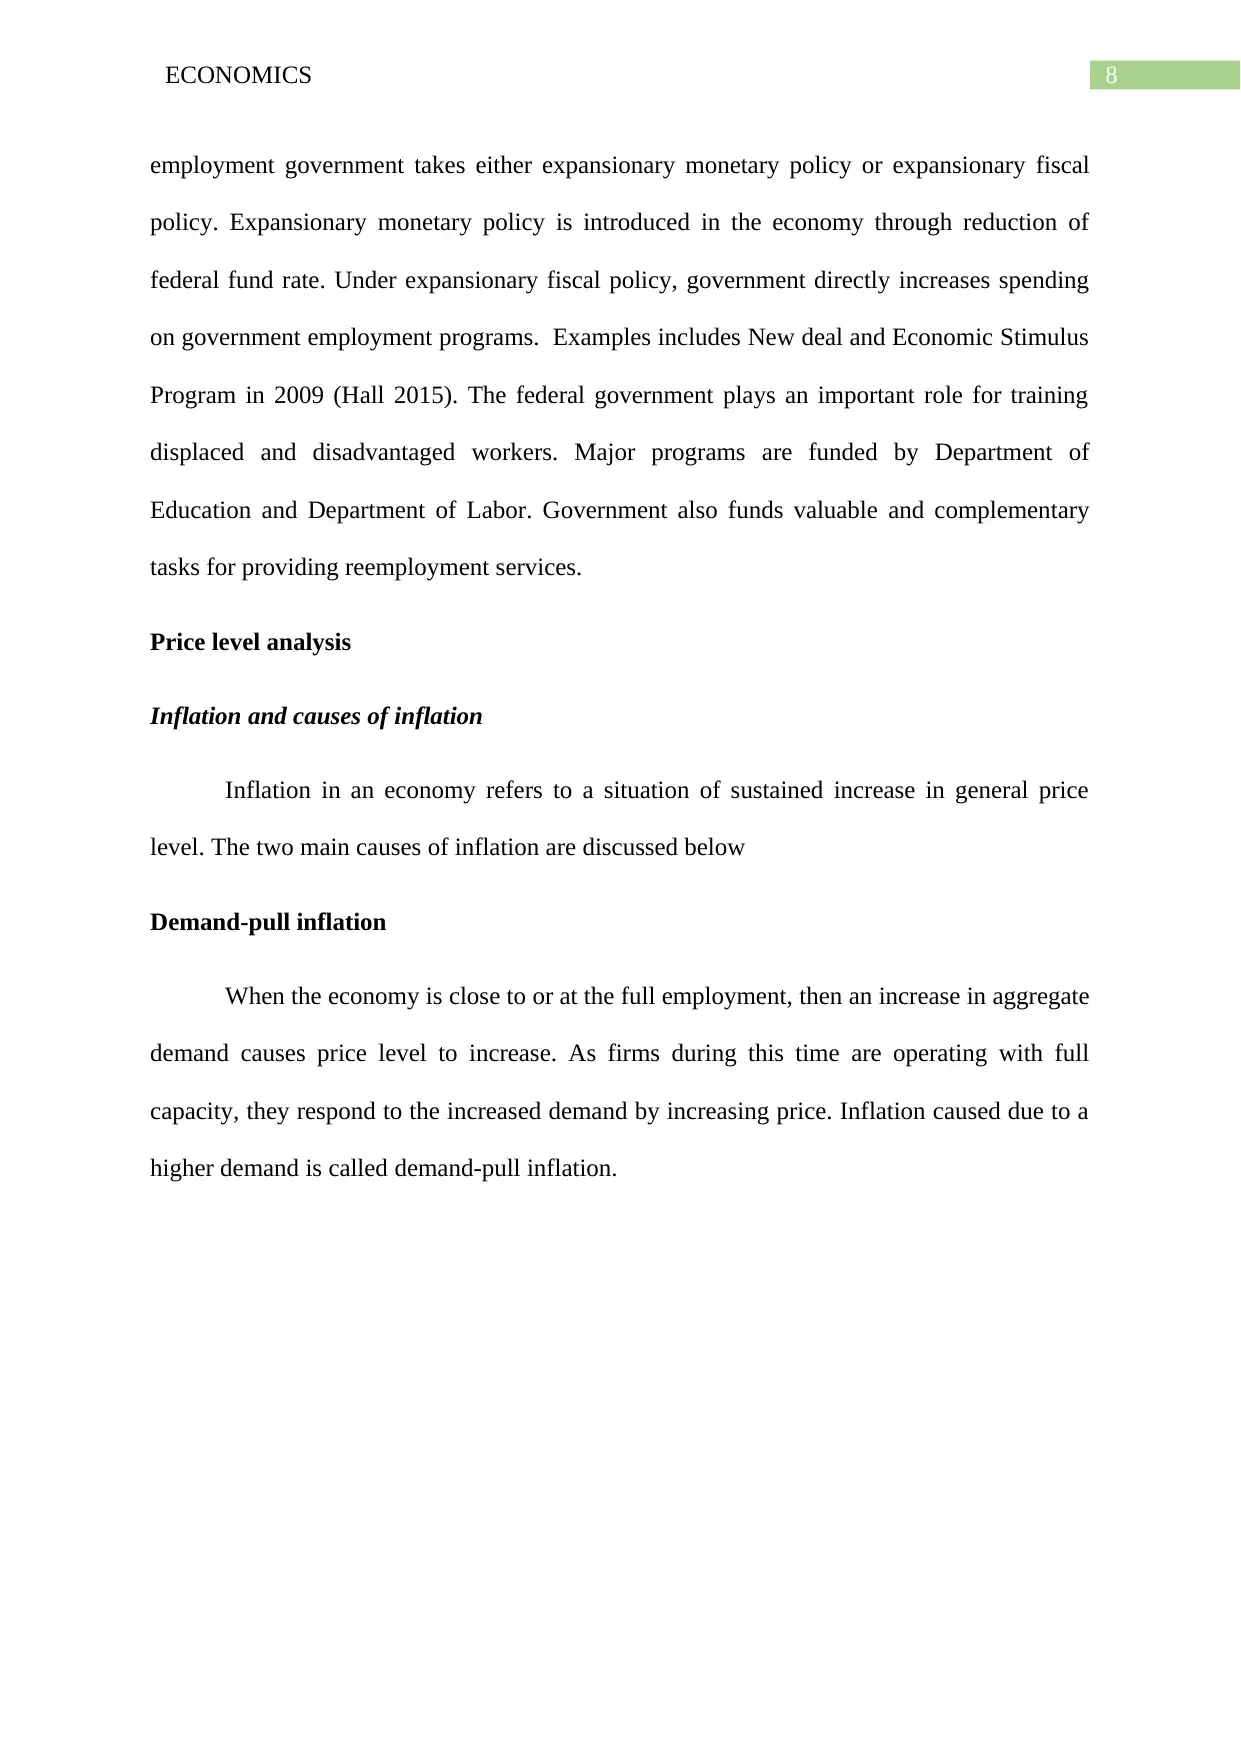
Demand-pull inflation
When the economy is close to or at the full employment, then an increase in aggregate
demand causes price level to increase. As firms during this time are operating with full
capacity, they respond to the increased demand by increasing price. Inflation caused due to a
higher demand is called demand-pull inflation.
employment government takes either expansionary monetary policy or expansionary fiscal
policy. Expansionary monetary policy is introduced in the economy through reduction of
federal fund rate. Under expansionary fiscal policy, government directly increases spending
on government employment programs. Examples includes New deal and Economic Stimulus
Program in 2009 (Hall 2015). The federal government plays an important role for training
displaced and disadvantaged workers. Major programs are funded by Department of
Education and Department of Labor. Government also funds valuable and complementary
tasks for providing reemployment services.
Price level analysis
Inflation and causes of inflation
Inflation in an economy refers to a situation of sustained increase in general price
level. The two main causes of inflation are discussed below
Demand-pull inflation
When the economy is close to or at the full employment, then an increase in aggregate
demand causes price level to increase. As firms during this time are operating with full
capacity, they respond to the increased demand by increasing price. Inflation caused due to a
higher demand is called demand-pull inflation.
⊘ This is a preview!⊘
Do you want full access?
Subscribe today to unlock all pages.
Trusted by 1+ million students worldwide
9ECONOMICS
Figure 5: Demand-pull inflation
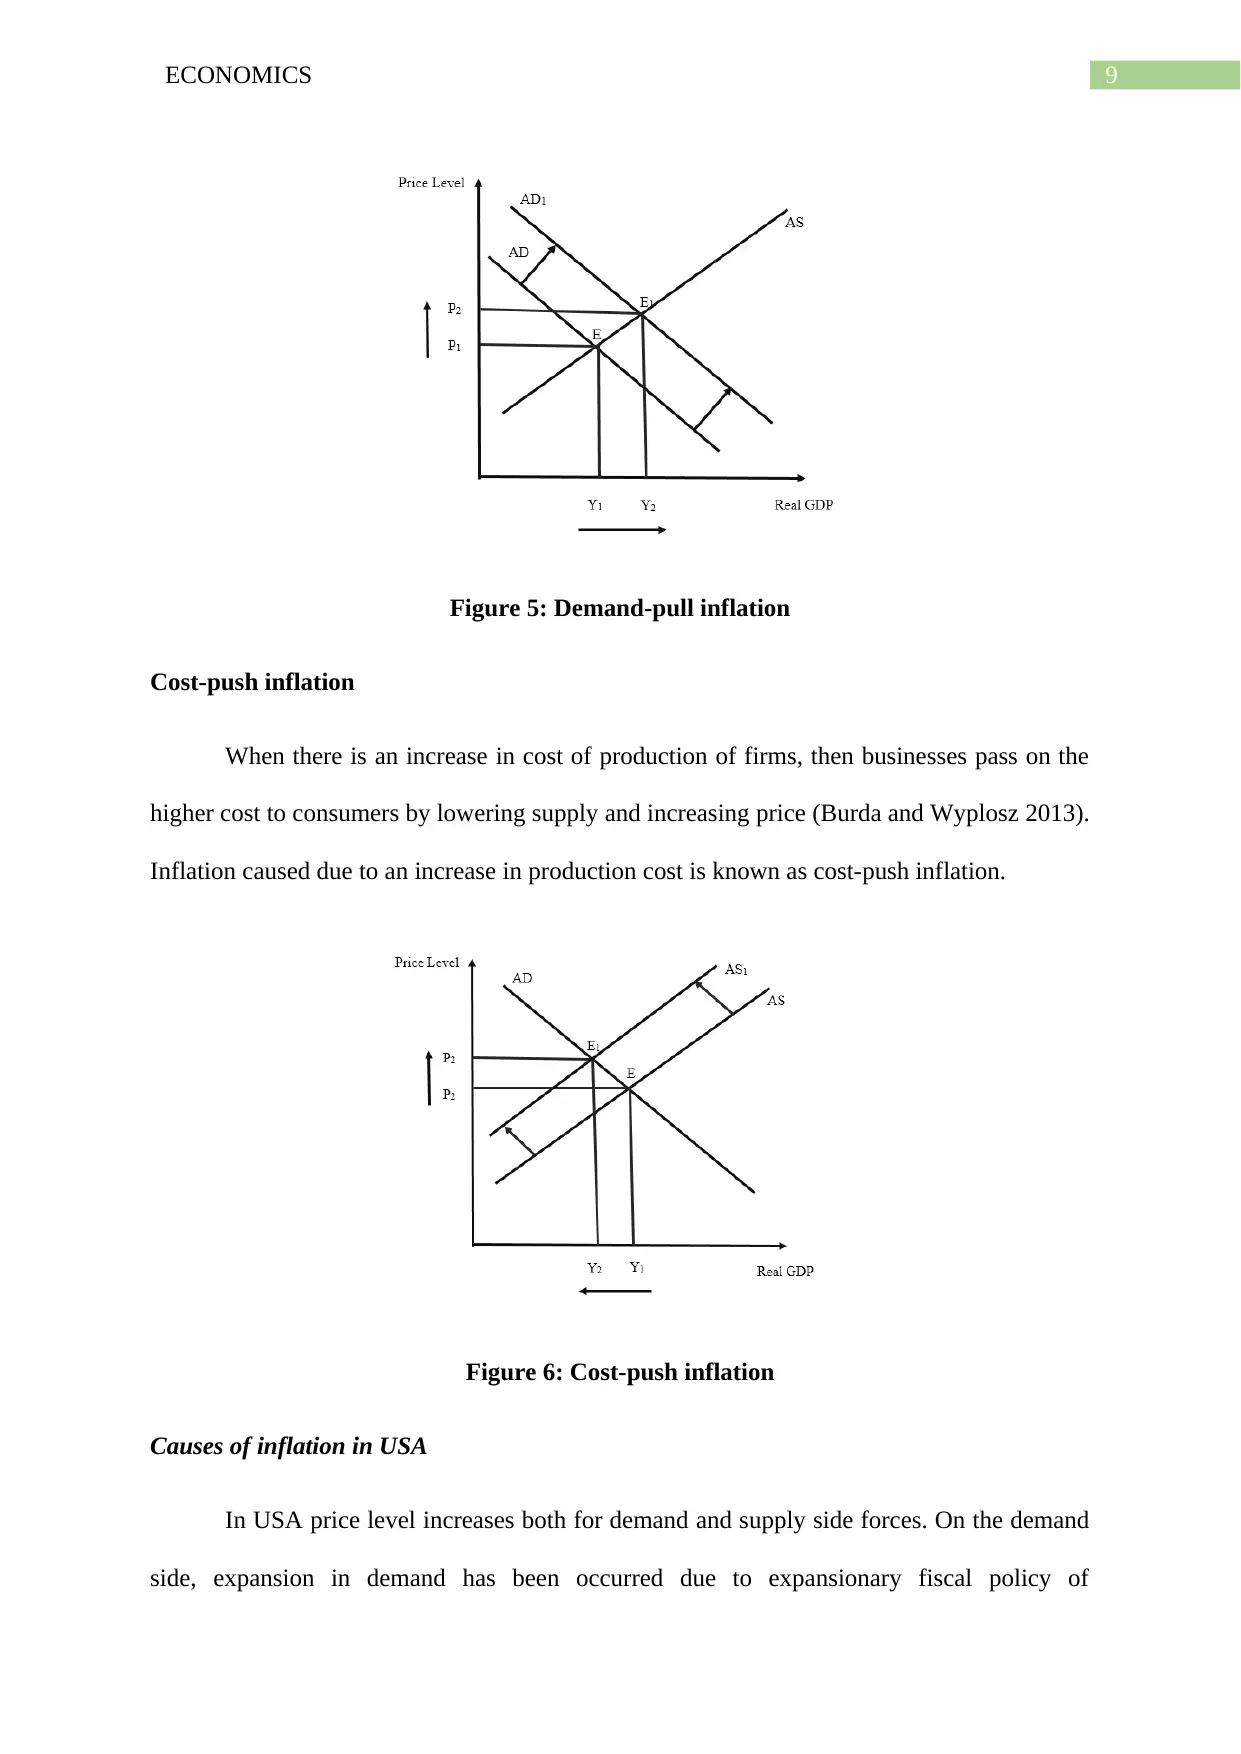
Cost-push inflation
When there is an increase in cost of production of firms, then businesses pass on the
higher cost to consumers by lowering supply and increasing price (Burda and Wyplosz 2013).
Inflation caused due to an increase in production cost is known as cost-push inflation.
Figure 6: Cost-push inflation
Causes of inflation in USA
In USA price level increases both for demand and supply side forces. On the demand
side, expansion in demand has been occurred due to expansionary fiscal policy of
Figure 5: Demand-pull inflation
Cost-push inflation
When there is an increase in cost of production of firms, then businesses pass on the
higher cost to consumers by lowering supply and increasing price (Burda and Wyplosz 2013).
Inflation caused due to an increase in production cost is known as cost-push inflation.
Figure 6: Cost-push inflation
Causes of inflation in USA
In USA price level increases both for demand and supply side forces. On the demand
side, expansion in demand has been occurred due to expansionary fiscal policy of
Paraphrase This Document
Need a fresh take? Get an instant paraphrase of this document with our AI Paraphraser
10ECONOMICS
government. This include a cut in personal income tax, decline in corporate income tax and
other. This results in an increase in aggregate demand causing demand-pull inflation in the
economy. Cost-push inflation in the economy is mainly resulted from higher growth in
wages. The increased cost of wage increases production cost reducing aggregate supply. This
cause cost-push inflation.
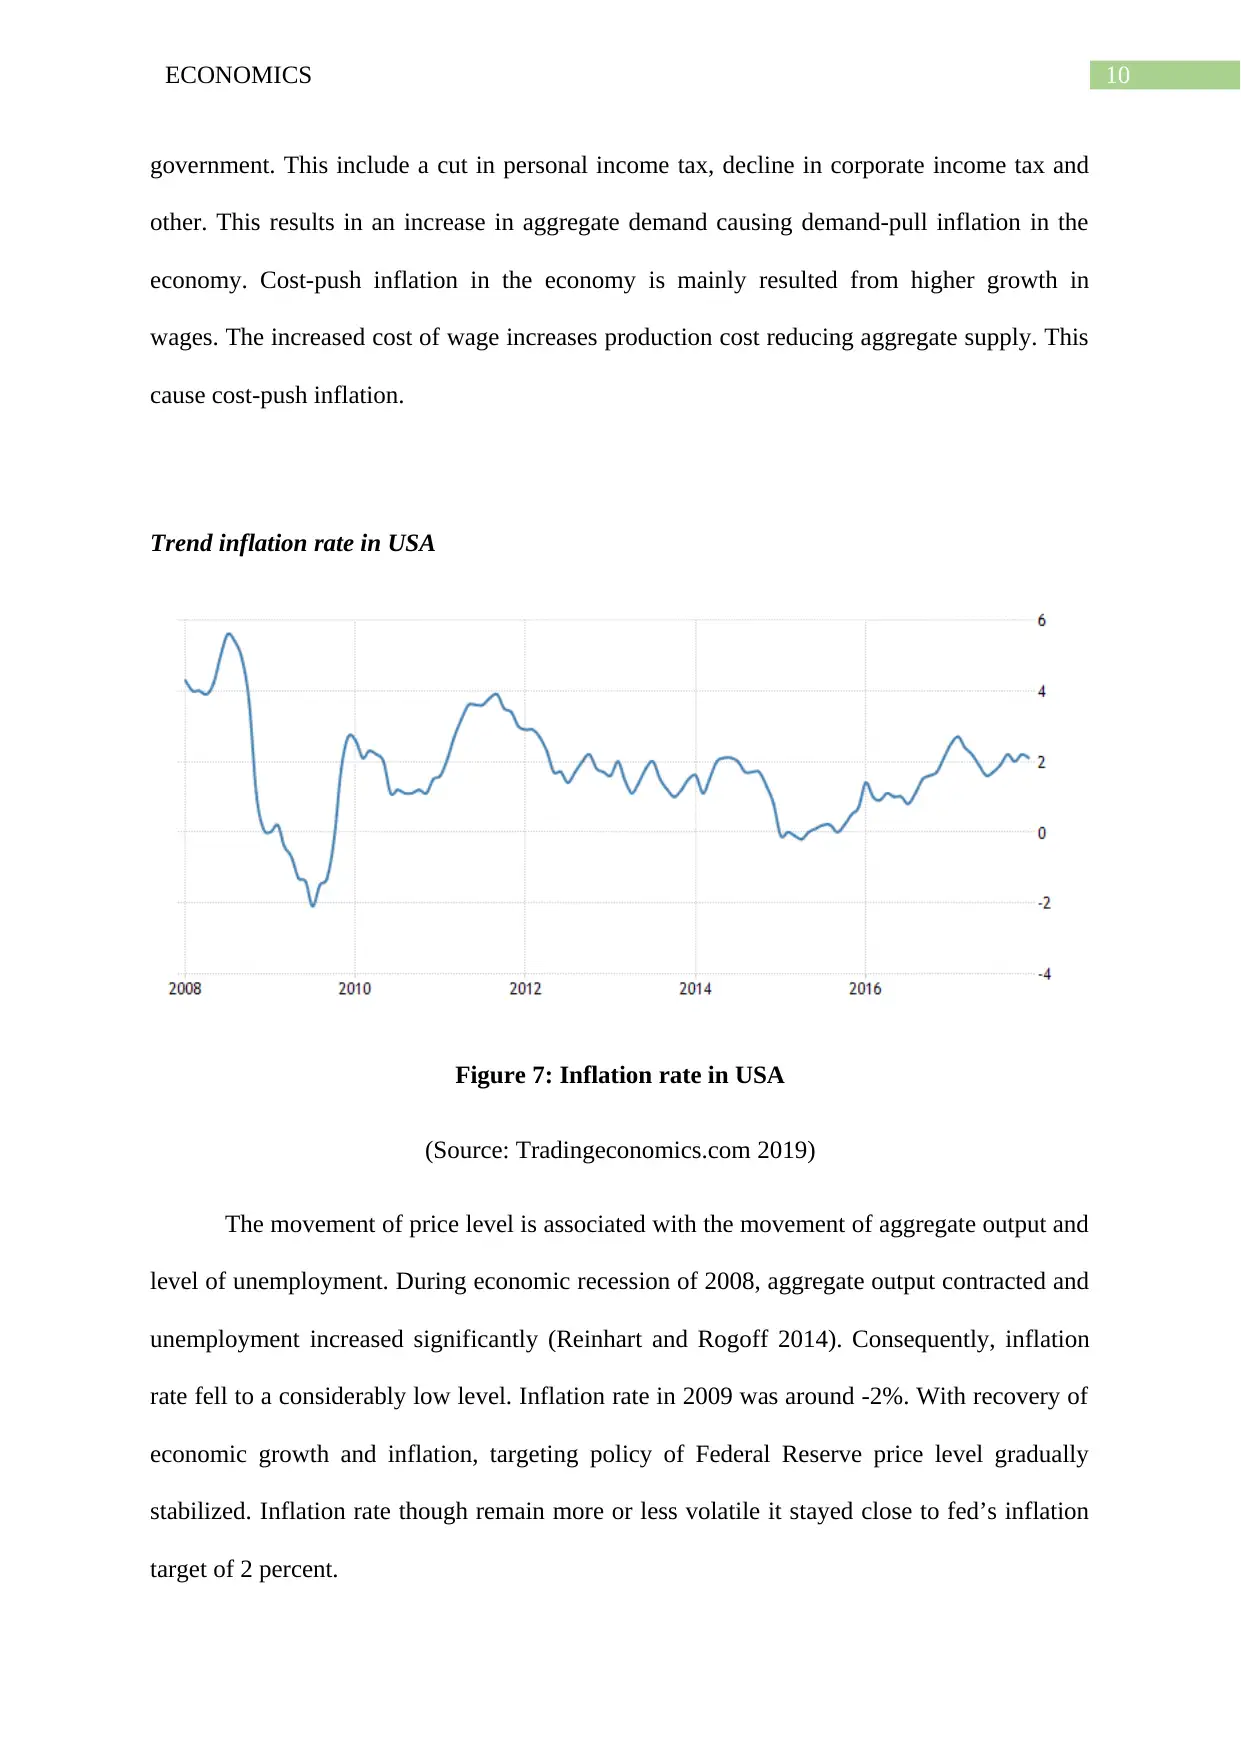
Trend inflation rate in USA
Figure 7: Inflation rate in USA
(Source: Tradingeconomics.com 2019)
The movement of price level is associated with the movement of aggregate output and
level of unemployment. During economic recession of 2008, aggregate output contracted and
unemployment increased significantly (Reinhart and Rogoff 2014). Consequently, inflation
rate fell to a considerably low level. Inflation rate in 2009 was around -2%. With recovery of
economic growth and inflation, targeting policy of Federal Reserve price level gradually
stabilized. Inflation rate though remain more or less volatile it stayed close to fed’s inflation
target of 2 percent.
government. This include a cut in personal income tax, decline in corporate income tax and
other. This results in an increase in aggregate demand causing demand-pull inflation in the
economy. Cost-push inflation in the economy is mainly resulted from higher growth in
wages. The increased cost of wage increases production cost reducing aggregate supply. This
cause cost-push inflation.
Trend inflation rate in USA
Figure 7: Inflation rate in USA
(Source: Tradingeconomics.com 2019)
The movement of price level is associated with the movement of aggregate output and
level of unemployment. During economic recession of 2008, aggregate output contracted and
unemployment increased significantly (Reinhart and Rogoff 2014). Consequently, inflation
rate fell to a considerably low level. Inflation rate in 2009 was around -2%. With recovery of
economic growth and inflation, targeting policy of Federal Reserve price level gradually
stabilized. Inflation rate though remain more or less volatile it stayed close to fed’s inflation
target of 2 percent.
11ECONOMICS
Government’s measure to achieve stable price
In USA, Federal Reserve controls the inflation rate. The Federal Open Market
Committee (FOMC) is committed to maintain an inflation rate of 2 percent
(federalreserve.gov 2019). Government uses monetary policy tool to attain the objective of
price stability. If growth in gross domestic product exceeds the standard rate of 2-3 percent
then the excess demand condition creates inflationary pressure in the economy. Fed then
takes a tight monetary policy. Federal Reserve has several tools to implement monetary
policy contraction. The first is open market operations. Under this, Fed sells or buys
government securities from the member banks. In times of excess demand condition
government sells securities lowering money supply and hence, reduces inflation (Summers
2014). A second way to lower inflationary pressure is to increase reserve requirement of
commercial banks. The third way is to increase the federal fund rate or discount rate. Fed
does the reverse in times of deflationary pressure.
Conclusion
The paper evaluates performance of USA economy from 2008 to 2018. The economy
recorded a considerable slowdown in between 2008 and 2009. This was due to bursting of
housing bubble in the year 2008. The sudden fall in housing price put the economy into
severe crisis. The economic slowdown during this time is evident from a decline in real GDP
and negative growth rate. Unemployment rose significantly and inflation became negative.
The economy however recovered the recessionary shocks and again recorded a stable
performances. In the economic recovery of USA, government played an important role. To
rescue the economy from financial crisis in 2008 and ensure a stable growth, government
introduced several resilience or bailout packages. Government takes significant measures to
support the private sector, support business growth and associated strategy to support
⊘ This is a preview!⊘
Do you want full access?
Subscribe today to unlock all pages.
Trusted by 1+ million students worldwide
1 out of 16
Related Documents


Your All-in-One AI-Powered Toolkit for Academic Success.
+13062052269
info@desklib.com
Available 24*7 on WhatsApp / Email
![[object Object]](/_next/static/media/star-bottom.7253800d.svg)
Unlock your academic potential
Copyright © 2020–2026 A2Z Services. All Rights Reserved. Developed and managed by ZUCOL.