Quantitative Methods Project: Soft Drink Market at USC

Verified

Added on  2020/04/21

|5
|1016
|323
Project
AI Summary
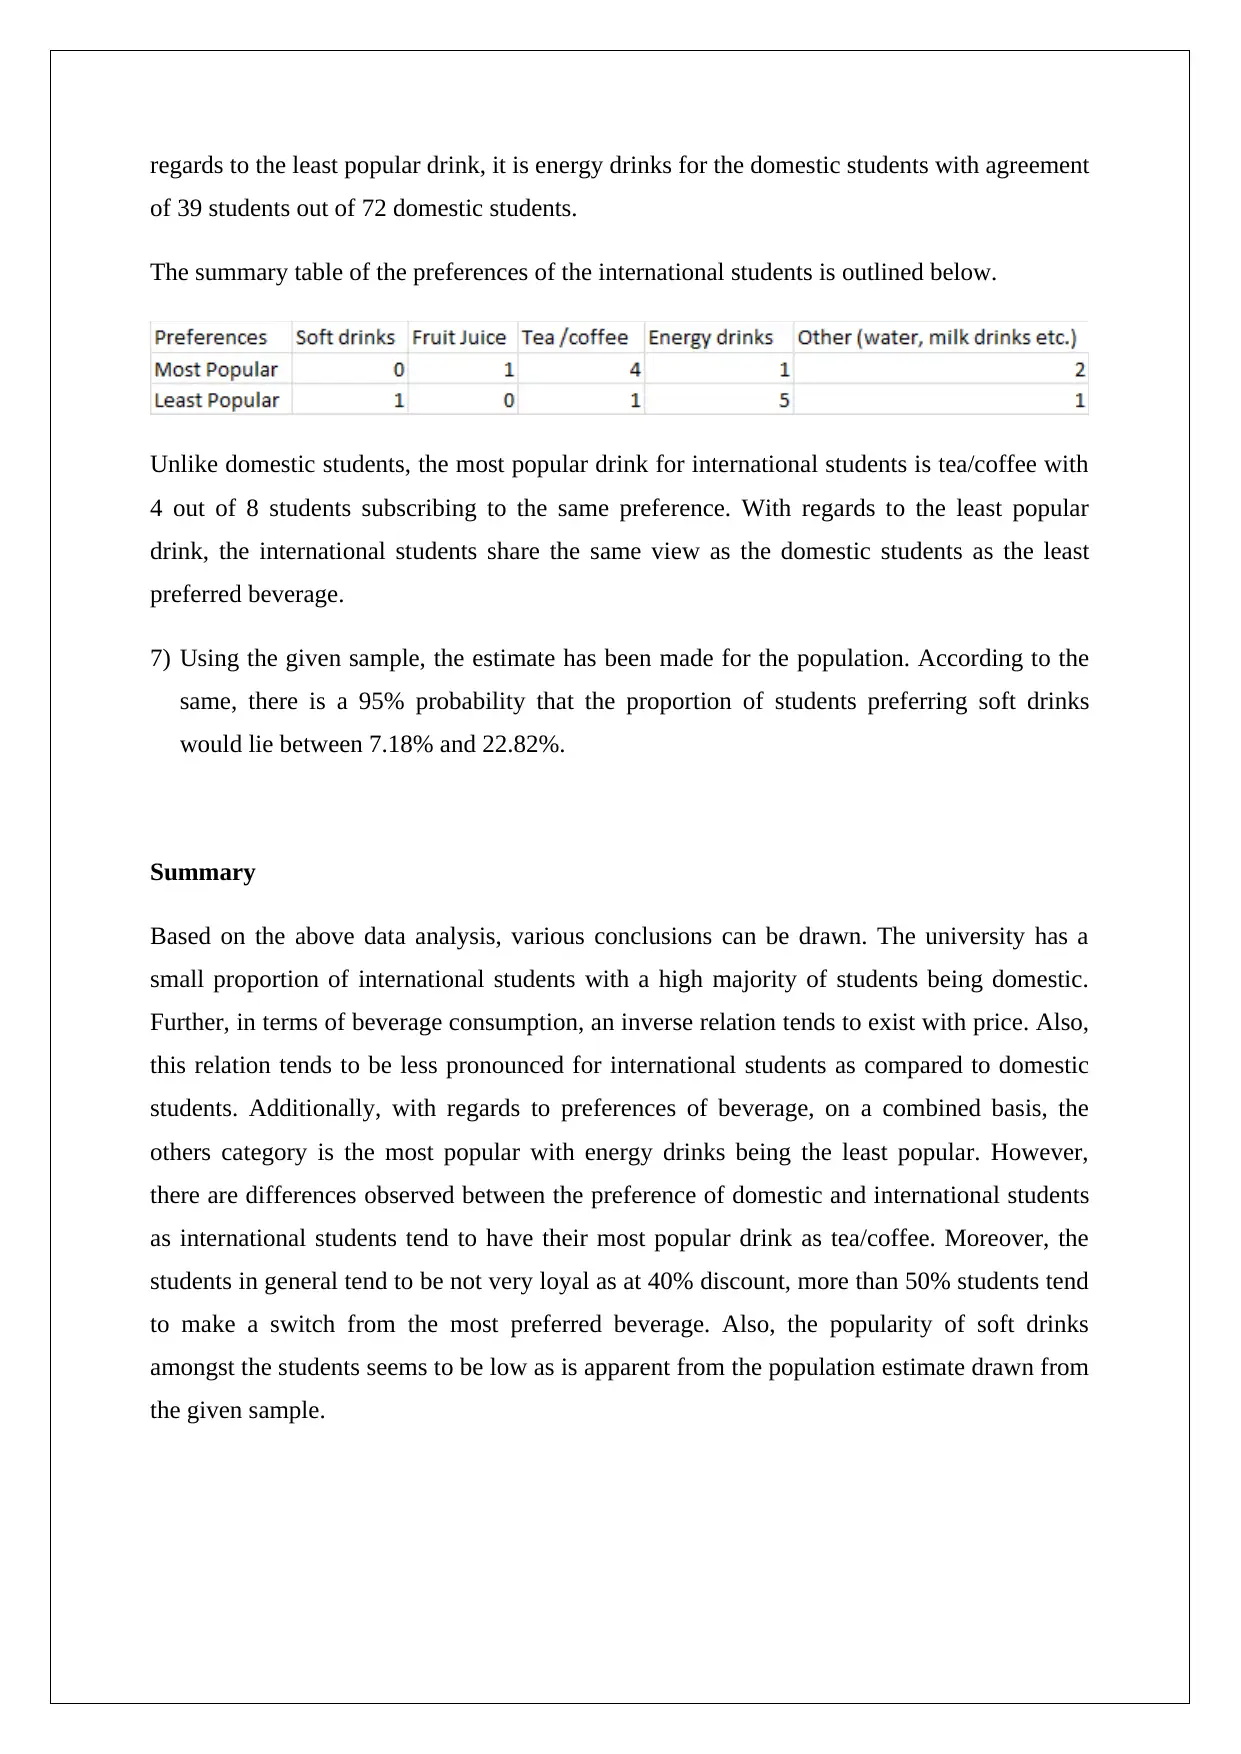
This project analyzes the soft drink market among students at the University of Southern California (USC). A survey of 80 students, obtained via random sampling, examined beverage consumption, preferences, and price sensitivity. The analysis reveals that domestic students constitute 90% of the sample and exhibit a stronger inverse relationship between price and consumption compared to international students. 'Other' beverages are the most popular overall, while energy drinks are the least preferred. Student loyalty to preferred beverages is moderate, with a significant shift in preference at a 40% discount. The study also estimates the proportion of students preferring soft drinks, providing valuable insights into market dynamics and consumer behavior within the USC student population. The project employs descriptive and inferential statistical techniques, including scatter plots and proportion estimations, to support its conclusions.
Document Page
Quantitative Methods
STUDENT ID:
[Pick the date]
tabler-icon-diamond-filled.svg

Paraphrase This Document

Need a fresh take? Get an instant paraphrase of this document with our AI Paraphraser
Document Page
Introduction
The objective of the given task is to understand the soft drink market comprising of the
students studying at the USC. In order to facilitate the same , a survey was conducted so as to
collect the data about the consumption & demand of various beverages along with their
respective beverage preferences and impact of price on the same. From the representative
population data collected through the survey, a sample of 80 students was obtained from the
original survey results through the use of random sampling. This was executed through the
usage of random sampling. From the sample data obtained, various inferential and descriptive
statistics techniques have been applied in order to provide answers to the various question.
These have been highlighted in the following section while the relevant computations are
shown in the attached excel sheer.
Data Analysis
Based on the sample data and the corresponding computations performed in excel, the
following analysis may be carried out.
1) Out of the given 80 students which form the sample, 72 are domestic students while the
remaining 8 are international students. This implies that the proportion of domestic
students in the sample is 90% while that of international students is 10% only.
2) It is observed from the sample data that as the price of the beverage tends to increase, the
corresponding consumption tends to shrink. This implies that there is an inverse
relationship between the price and beverage quantity consumed by the students. The
following scatter plot also highlights the same.
Document Page
This is in line with the law of demand and makes sense considering the fact that these are
not necessary items and can be curtailed especially when the price rises. Also, the relation
seems to be quite linear as is apparent from the above plot.
3) Based on the sample data, it is apparent that the other category is the most popular
considering that 33 out of 80 students have chosen the same as their most popular
beverage. The least popular beverage amongst the students based on the given sample
seems to be energy drinks considering that it has been voted as the least popular by 44
students out of the given 80 students. The summary of preferences obtained from sample
is highlighted below.
4) In order to check the loyalty of the students to their preferred beverage, it is imperative to
analyse the proportion of students who tend to make a switch when discounts are offered
to them in favour of the second preference. It is apparent from the sample data that when
25% discount is offered on the second preferred drink, then only 21.25% of the sample
tends to a make a shift. However, when the discount is increased to 40%, then this value
tends to increase to 55%. Therefore, it is apparent that the students tend to be not very
loyal to the preferred beverage and if given reasonably high discount (40%) majority of
them are willing to make a shift.
Document Page
5) Based on the given sample data, it would be fair to conclude that it seems that the
domestic students are more sensitive to price in comparison with international students.
The scatter plot for the beverage price quantity relationship for the international students is
as highlighted below.
It is apparent that the above scatter plot does show an inverse relationship but the
correlation coefficient seems to be lower. The combined scatterplot tends to reflect on a
more linear and uniform trend thus highlighting that the domestic students tend to have a
more strong and linear relationship with regards to price and beverage quantity.
6) The respective summary table of the preferences of the local students is outlined below.
It is apparent from the above table that that the most popular beverage amongst the domestic
students tends to be other with 31 out of 72 students subscribing to the same preference. With
tabler-icon-diamond-filled.svg

Paraphrase This Document

Need a fresh take? Get an instant paraphrase of this document with our AI Paraphraser
Document Page
regards to the least popular drink, it is energy drinks for the domestic students with agreement
of 39 students out of 72 domestic students.
The summary table of the preferences of the international students is outlined below.
Unlike domestic students, the most popular drink for international students is tea/coffee with
4 out of 8 students subscribing to the same preference. With regards to the least popular
drink, the international students share the same view as the domestic students as the least
preferred beverage.
7) Using the given sample, the estimate has been made for the population. According to the
same, there is a 95% probability that the proportion of students preferring soft drinks
would lie between 7.18% and 22.82%.
Summary
Based on the above data analysis, various conclusions can be drawn. The university has a
small proportion of international students with a high majority of students being domestic.
Further, in terms of beverage consumption, an inverse relation tends to exist with price. Also,
this relation tends to be less pronounced for international students as compared to domestic
students. Additionally, with regards to preferences of beverage, on a combined basis, the
others category is the most popular with energy drinks being the least popular. However,
there are differences observed between the preference of domestic and international students
as international students tend to have their most popular drink as tea/coffee. Moreover, the
students in general tend to be not very loyal as at 40% discount, more than 50% students tend
to make a switch from the most preferred beverage. Also, the popularity of soft drinks
amongst the students seems to be low as is apparent from the population estimate drawn from
the given sample.
chevron_up_icon
1 out of 5
circle_padding
hide_on_mobile
zoom_out_icon
[object Object]