BAC21 Group Project: Quantitative Analysis of USC Soft Drink Market
VerifiedAdded on 2023/05/31
|9
|1289
|192
Report
AI Summary
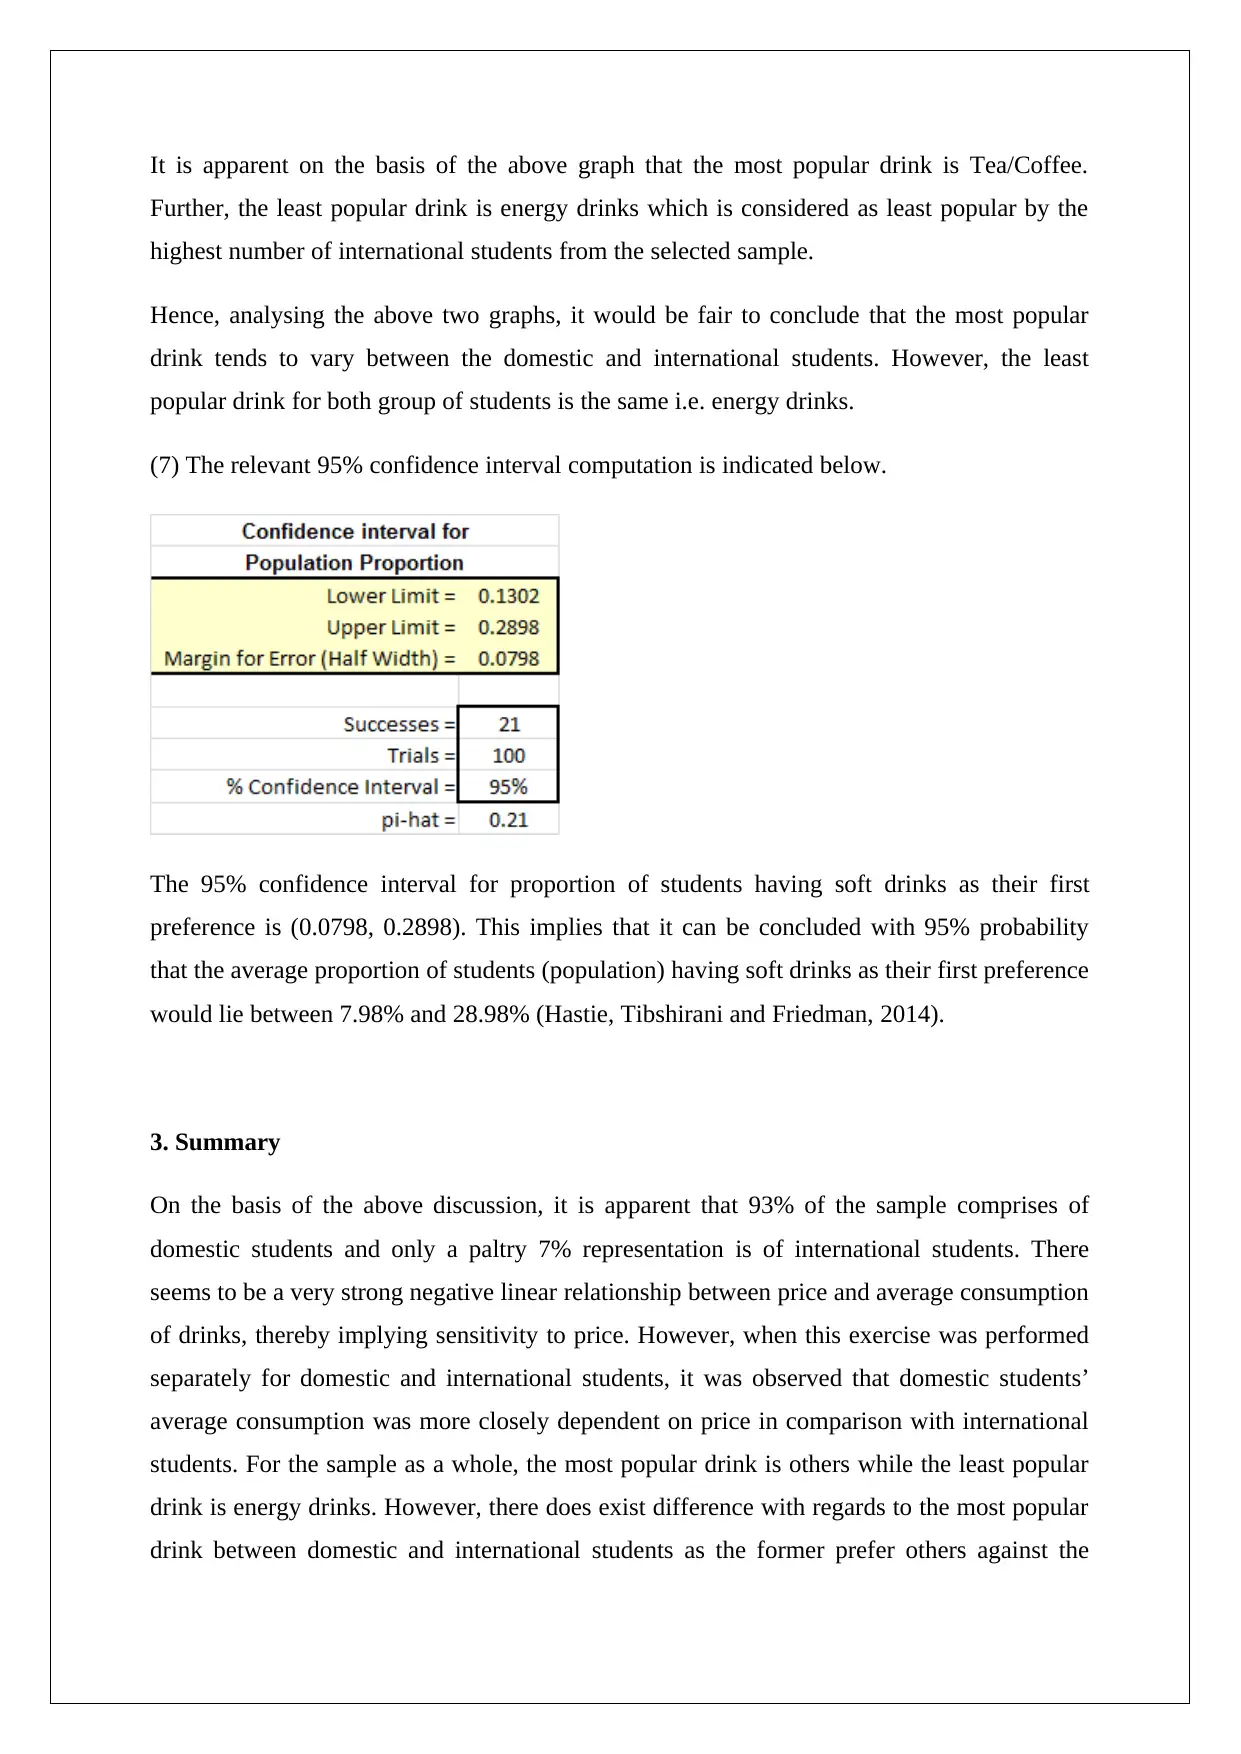
This report analyzes the beverage preferences of USC students, distinguishing between international and domestic students to compare their choices and price sensitivity. Using a simple random sample of 100 student responses, the analysis reveals that domestic students constitute 93% of the sample. A strong negative linear relationship exists between price and average consumption, particularly among domestic students. While "others" (water, milk, etc.) are the most popular drinks overall, international students favor tea/coffee. Energy drinks are the least popular across both groups. Brand loyalty is significant, with only 54% of students willing to switch brands even with a 40% discount. A 95% confidence interval suggests that the true proportion of students preferring soft drinks lies between 7.98% and 28.98%, indicating that the sample is a faithful representation of the underlying population. Desklib offers a variety of resources including past papers and solved assignments for students.

QUANTITATIVE METHODS
STUDENT ID:
[Pick the date]
STUDENT ID:
[Pick the date]
Paraphrase This Document
Need a fresh take? Get an instant paraphrase of this document with our AI Paraphraser

1. Introduction
The objective of the given report is to analyse the beverage preferences of students studying
at USC. In this regards, emphasis has been given on the segregation between international
and domestic students so that their preferences and price related behaviour can be compared.
A sample of responses of 100 students has been selected from the available population survey
data. The underlying sampling technique used for the same is simple random sampling which
has been executed using Excel as the enabling tool (Eriksson and Kovalainen, 2015). Each of
the elements in the population in this sampling technique has equal chance of getting
selected. Since this technique is a probability based sampling technique, hence the bias
would be limited in this sample (Flick, 2015).
2. Data Analysis
The objective of this section is to address specific questions that have been raised which the
report aims to address.
(1) The requisite screenshot for the selected sample is pasted below.
From the above, it is apparent 93% of the students in the sample are domestic students while
7% of the students are international students.
(2) The relevant data summarising the relationship between price and average quantity
consumed by students is indicated as follows.

The relationship can be studied by drawing a scatter plot with price as the independent
variable and average quantity consumed as the dependent variable.
From the above scatterplot, it is apparent that there is a significant negative linear relationship
between price and the average quantity demanded by the students. This is apparent from the
fact that correlation coefficient is quite close to the theoretical minimum of -1 (Hillier, 2016).
(3) The preferences of the selected sample with regards to most popular and least popular
beverage is summarised in the form of graph indicated below.
⊘ This is a preview!⊘
Do you want full access?
Subscribe today to unlock all pages.

Trusted by 1+ million students worldwide

It is apparent on the basis of the above graph that the most popular drink is others which
comprises of options such as water, milk, drinks etc. Further, the least popular drink is energy
drinks which is considered as least popular by the highest number of students from the
selected sample.
(4) The loyalty amongst the students to their brand is significant considering the fact that
even after giving a discount of 40%, only 54% were willing to make the shift. The
appropriate table in this regards is indicated below.
From the above, it is evident that when 25% discount is given, only 29% of the students make
a shift from their preferred brand which implies that students as a target audience are not very
price sensitive and exhibit significant brand loyalty.
(5) The price quantity relationship for international students is summarised using the
following scatter plot as indicated below.
Paraphrase This Document
Need a fresh take? Get an instant paraphrase of this document with our AI Paraphraser

The price quantity relationship for domestic students is summarised using the following
scatter plot as indicated below.
Considering the two scatter plots indicated above, it is apparent that the correlation seems
stronger for domestic students in comparison to international students. This implies that the
consumption of drinks by domestic students is more sensitive to price in comparison to
consumption by international students (Hair et. al., 2015).

(6) The preferences of the domestic students with regards to most popular and least popular
beverage is summarised in the form of graph indicated below.
It is apparent on the basis of the above graph that the most popular drink is others which
comprises of options such as water, milk, drinks etc. Further, the least popular drink is energy
drinks which is considered as least popular by the highest number of domestic students from
the selected sample.
The preferences of the International students with regards to most popular and least popular
beverage is summarised in the form of graph indicated below.
⊘ This is a preview!⊘
Do you want full access?
Subscribe today to unlock all pages.

Trusted by 1+ million students worldwide

It is apparent on the basis of the above graph that the most popular drink is Tea/Coffee.
Further, the least popular drink is energy drinks which is considered as least popular by the
highest number of international students from the selected sample.
Hence, analysing the above two graphs, it would be fair to conclude that the most popular
drink tends to vary between the domestic and international students. However, the least
popular drink for both group of students is the same i.e. energy drinks.
(7) The relevant 95% confidence interval computation is indicated below.
The 95% confidence interval for proportion of students having soft drinks as their first
preference is (0.0798, 0.2898). This implies that it can be concluded with 95% probability
that the average proportion of students (population) having soft drinks as their first preference
would lie between 7.98% and 28.98% (Hastie, Tibshirani and Friedman, 2014).
3. Summary
On the basis of the above discussion, it is apparent that 93% of the sample comprises of
domestic students and only a paltry 7% representation is of international students. There
seems to be a very strong negative linear relationship between price and average consumption
of drinks, thereby implying sensitivity to price. However, when this exercise was performed
separately for domestic and international students, it was observed that domestic students’
average consumption was more closely dependent on price in comparison with international
students. For the sample as a whole, the most popular drink is others while the least popular
drink is energy drinks. However, there does exist difference with regards to the most popular
drink between domestic and international students as the former prefer others against the
Paraphrase This Document
Need a fresh take? Get an instant paraphrase of this document with our AI Paraphraser

latter’s preference for tea/coffee. But the least popular drink for both international and
domestic students is energy drinks. Further, it has been observed that students tend to be
quite loyal to their brands considering the fact that they do not switch to other brands even if
significant discounts are offered by these. Additionally, it is 95% likely that that the average
proportion of students (population) having soft drinks as their first preference would lie
between 7.98% and 28.98%. Considering that the actual population average in this regards
does fall within the above stated interval, hence it can be concluded that the given sample
seems to be a faithful representation of the underlying population.

References
Eriksson, P. and Kovalainen, A. (2015) Quantitative methods in business research. 3rd ed.
London: Sage Publications.
Flick, U. (2015) Introducing research methodology: A beginner's guide to doing a research
project. 4th ed. New York: Sage Publications.
Hair, J. F., Wolfinbarger, M., Money, A. H., Samouel, P., and Page, M. J. (2015) Essentials
of business research methods. 2nd ed. New York: Routledge.
Hastie, T., Tibshirani, R. and Friedman, J. (2014) The Elements of Statistical Learning. 4th
ed. New York: Springer Publications.
Hillier, F. (2016) Introduction to Operations Research. 6th ed. New York: McGraw Hill
Publications.
⊘ This is a preview!⊘
Do you want full access?
Subscribe today to unlock all pages.

Trusted by 1+ million students worldwide
1 out of 9
Related Documents
Your All-in-One AI-Powered Toolkit for Academic Success.
+13062052269
info@desklib.com
Available 24*7 on WhatsApp / Email
Unlock your academic potential
Copyright © 2020–2025 A2Z Services. All Rights Reserved. Developed and managed by ZUCOL.


