University of Southern California: Soft Drink Market Analysis Report
VerifiedAdded on 2023/05/30
|12
|2300
|202
Report
AI Summary
This report presents a comprehensive analysis of the soft drink market at the University of Southern California (USC), based on a project undertaken by BAC21 students. The study involved surveying a random sample of 100 students to determine soft drink sales, student preferences, and consumption patterns. The analysis included examining the proportions of local and international students, the relationship between price and quantity consumed, the popularity of different soft drink brands, brand loyalty, and the differences in demand between local and international students. The findings revealed that local students are the primary consumers, that low prices increase consumption, and that Coca-Cola and Diet Cola are popular among local students. The report concludes by emphasizing the importance of brand value and pricing strategies to influence student choices and drive sales within the university market. The study highlights the need for companies to consider healthy options to attract students.
The market for soft drinks at USC
1
1
Paraphrase This Document
Need a fresh take? Get an instant paraphrase of this document with our AI Paraphraser
Table of Contents
1.Introduction.............................................................................................................................3
2. Data Analysis.........................................................................................................................4
3. Summary..............................................................................................................................11
Reference list............................................................................................................................12
2
1.Introduction
This study is about finding out current market of soft drinks at the University. USC is one of
the leading universities attended by many students each day on week days. Core purpose of
this study and data analysis is to determine the soft drink sale and students’ soft drink market
at this educational campus. Generally, market of soft drinks is calculated in terms of 375ml
cans. All the information has been selected through survey and data collection process. Since
conducting survey with all the students is not possible a random sample of 100 students has
been selected. Therefore, it has been decided that only the BAC21 students must be surveyed
and asked questions. Though it has been decided that which division of students will be
survey and interviewed, selection of the sample size and data collection method are based on
other theories and models also (Taylor et al., 2015). During the sample selection probability
sampling method has been implemented to select the 100 respondents. On the other hand,
field survey will be effective for achieving the answers from the students and there is a need
of direct interaction with the students having soft drinks at USC. Therefore, Primary data
analysis method is considered as appropriate for survey. On the other hand, it has been
identified that only the quantitative data collection and analysis process would be
implemented in this study (Lewis, 2015). These information together withstand how the
sample and data analysis have been decided for this study.
3
⊘ This is a preview!⊘
Do you want full access?
Subscribe today to unlock all pages.
Trusted by 1+ million students worldwide
2. Data Analysis
The primary data collection process has been conducted through designing a preferred
questionnaire containing 7 questions. All the questions along with analysis of are listed
below.
1. What proportions of the students in your sample are local and what proportion are
international?
Options Respondent
Percentage (%)
Number of
Responses
Total Respondents
International
students
40 40 100
Local students 60 60 100
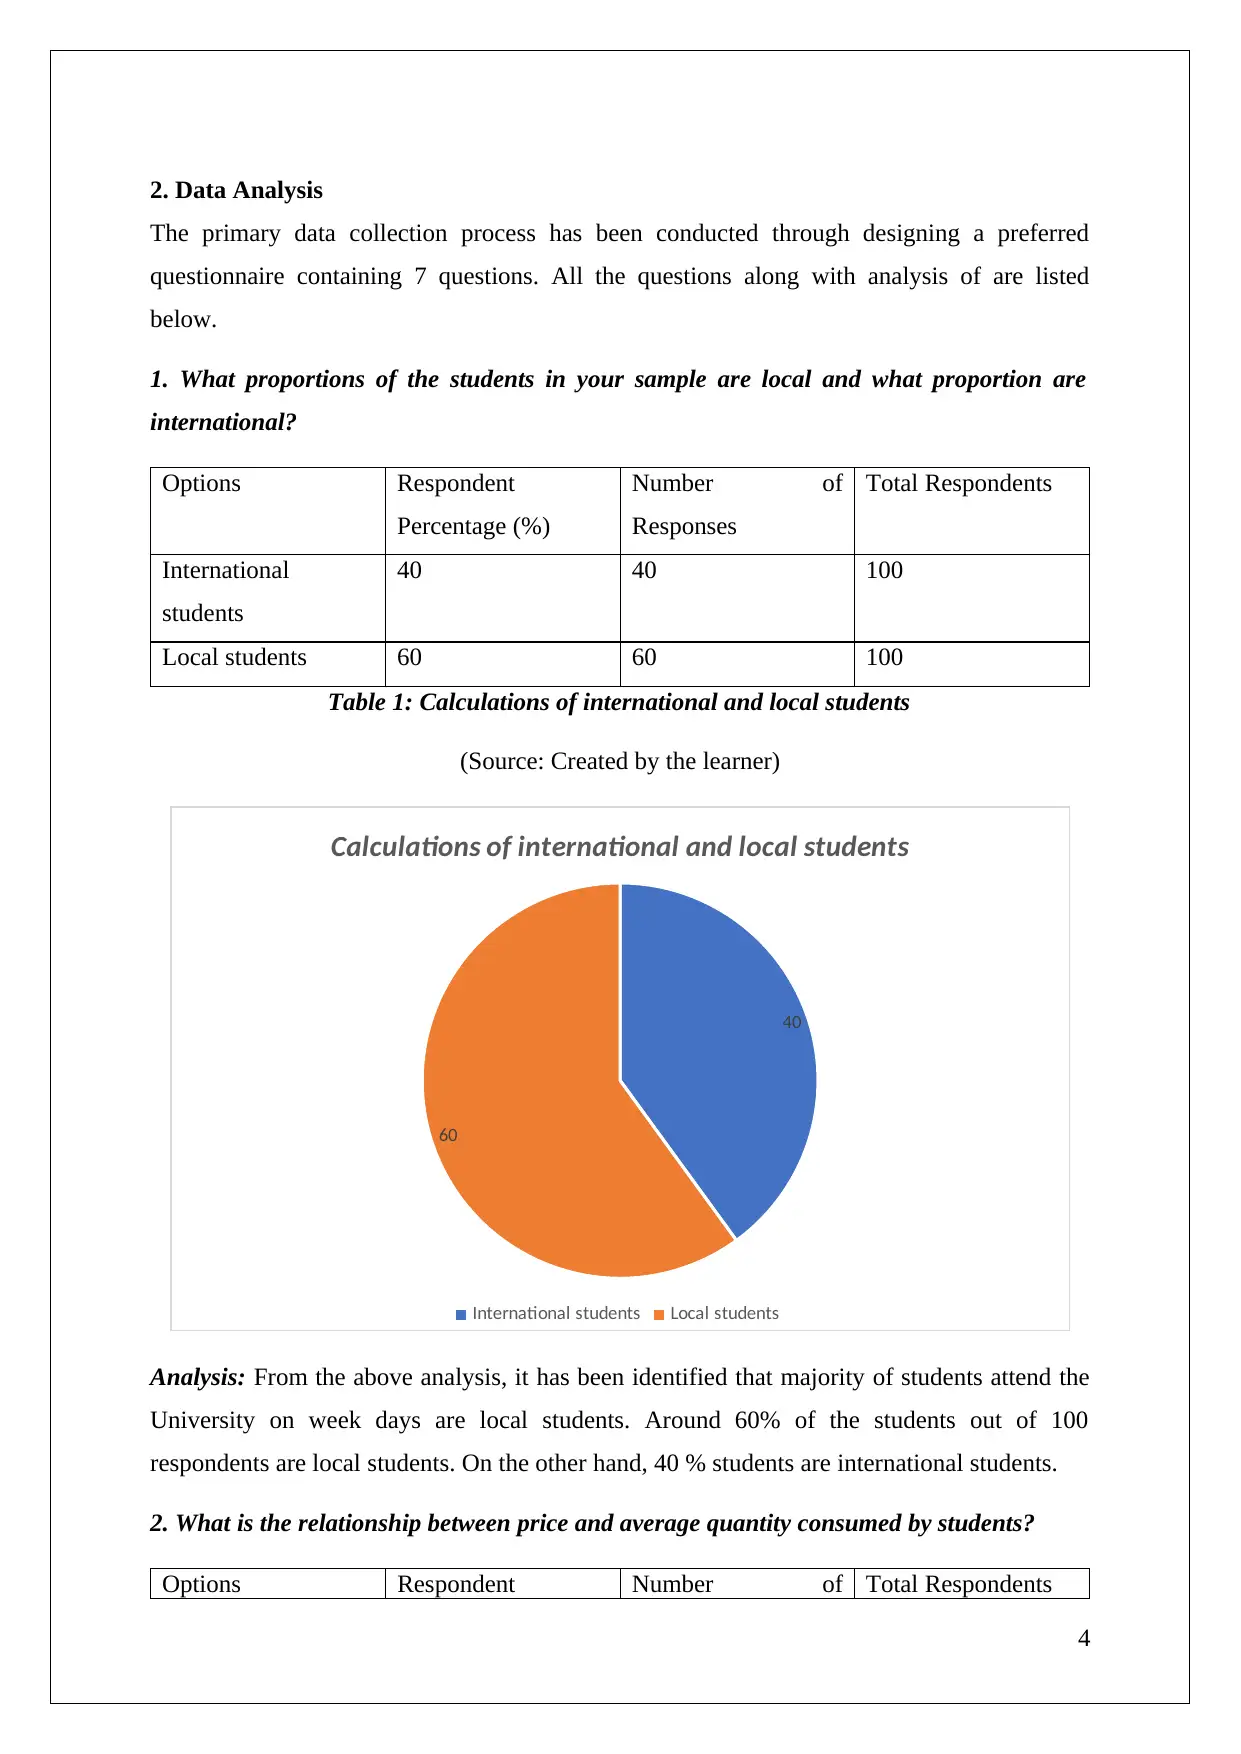
Table 1: Calculations of international and local students
(Source: Created by the learner)
40
60
Calculations of international and local students
International students Local students
Analysis: From the above analysis, it has been identified that majority of students attend the
University on week days are local students. Around 60% of the students out of 100
respondents are local students. On the other hand, 40 % students are international students.
2. What is the relationship between price and average quantity consumed by students?
Options Respondent Number of Total Respondents
4
The primary data collection process has been conducted through designing a preferred
questionnaire containing 7 questions. All the questions along with analysis of are listed
below.
1. What proportions of the students in your sample are local and what proportion are
international?
Options Respondent
Percentage (%)
Number of
Responses
Total Respondents
International
students
40 40 100
Local students 60 60 100
Table 1: Calculations of international and local students
(Source: Created by the learner)
40
60
Calculations of international and local students
International students Local students
Analysis: From the above analysis, it has been identified that majority of students attend the
University on week days are local students. Around 60% of the students out of 100
respondents are local students. On the other hand, 40 % students are international students.
2. What is the relationship between price and average quantity consumed by students?
Options Respondent Number of Total Respondents
4
Paraphrase This Document
Need a fresh take? Get an instant paraphrase of this document with our AI Paraphraser
Percentage (%) Responses
High price rate and
low consumption
rate
35 35 100
Low price and high
consumption rates
65 65 100
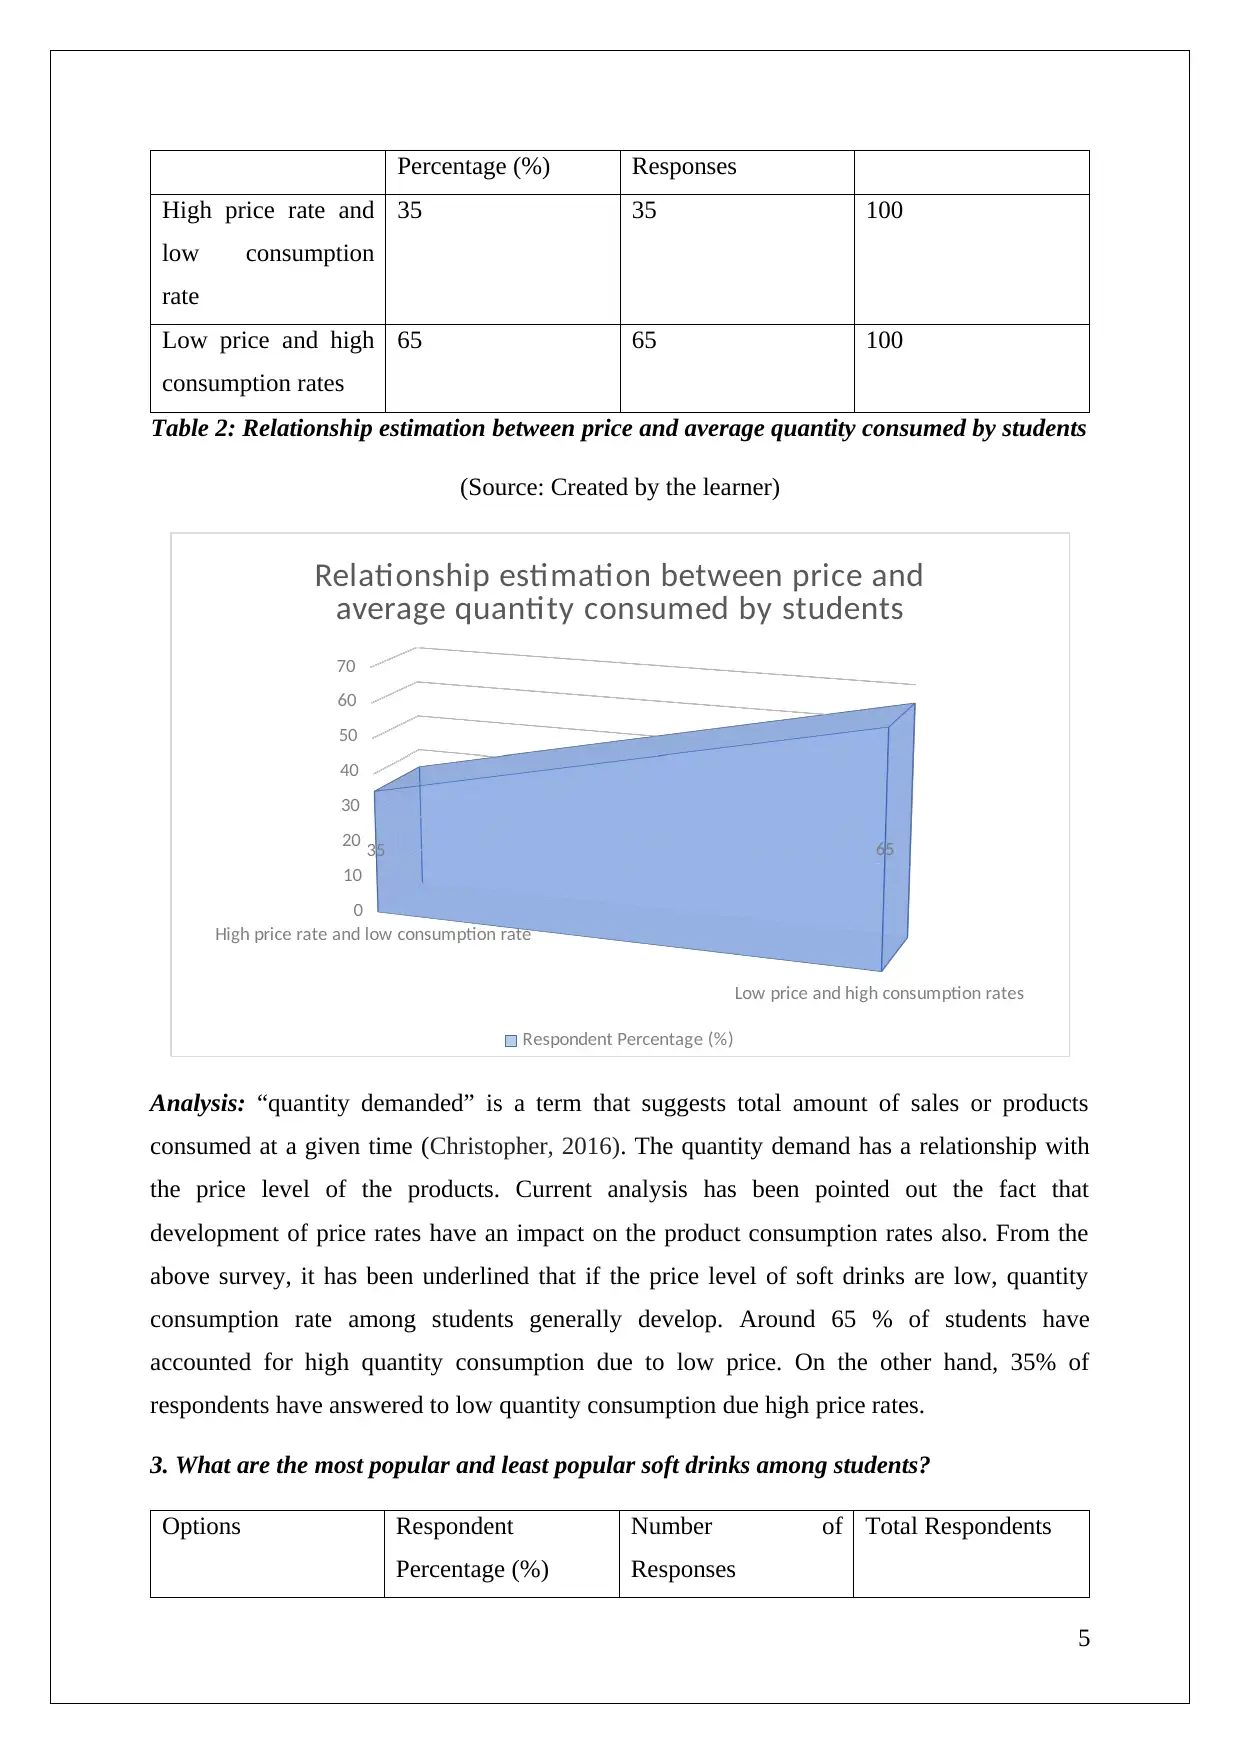
Table 2: Relationship estimation between price and average quantity consumed by students
(Source: Created by the learner)
High price rate and low consumption rate
Low price and high consumption rates
0
10
20
30
40
50
60
70
35 65
Relationship estimation between price and
average quantity consumed by students
Respondent Percentage (%)
Analysis: “quantity demanded” is a term that suggests total amount of sales or products
consumed at a given time (Christopher, 2016). The quantity demand has a relationship with
the price level of the products. Current analysis has been pointed out the fact that
development of price rates have an impact on the product consumption rates also. From the
above survey, it has been underlined that if the price level of soft drinks are low, quantity
consumption rate among students generally develop. Around 65 % of students have
accounted for high quantity consumption due to low price. On the other hand, 35% of
respondents have answered to low quantity consumption due high price rates.
3. What are the most popular and least popular soft drinks among students?
Options Respondent
Percentage (%)
Number of
Responses
Total Respondents
5
High price rate and
low consumption
rate
35 35 100
Low price and high
consumption rates
65 65 100
Table 2: Relationship estimation between price and average quantity consumed by students
(Source: Created by the learner)
High price rate and low consumption rate
Low price and high consumption rates
0
10
20
30
40
50
60
70
35 65
Relationship estimation between price and
average quantity consumed by students
Respondent Percentage (%)
Analysis: “quantity demanded” is a term that suggests total amount of sales or products
consumed at a given time (Christopher, 2016). The quantity demand has a relationship with
the price level of the products. Current analysis has been pointed out the fact that
development of price rates have an impact on the product consumption rates also. From the
above survey, it has been underlined that if the price level of soft drinks are low, quantity
consumption rate among students generally develop. Around 65 % of students have
accounted for high quantity consumption due to low price. On the other hand, 35% of
respondents have answered to low quantity consumption due high price rates.
3. What are the most popular and least popular soft drinks among students?
Options Respondent
Percentage (%)
Number of
Responses
Total Respondents
5
Coca Cola 20 20 100
Pepsi-Cola 10 10 100
Mountain Dew 10 10 100
Diet Cola 30 30 100
Dr Pepper 10 10 100
Diet Pepsi 20 20 100
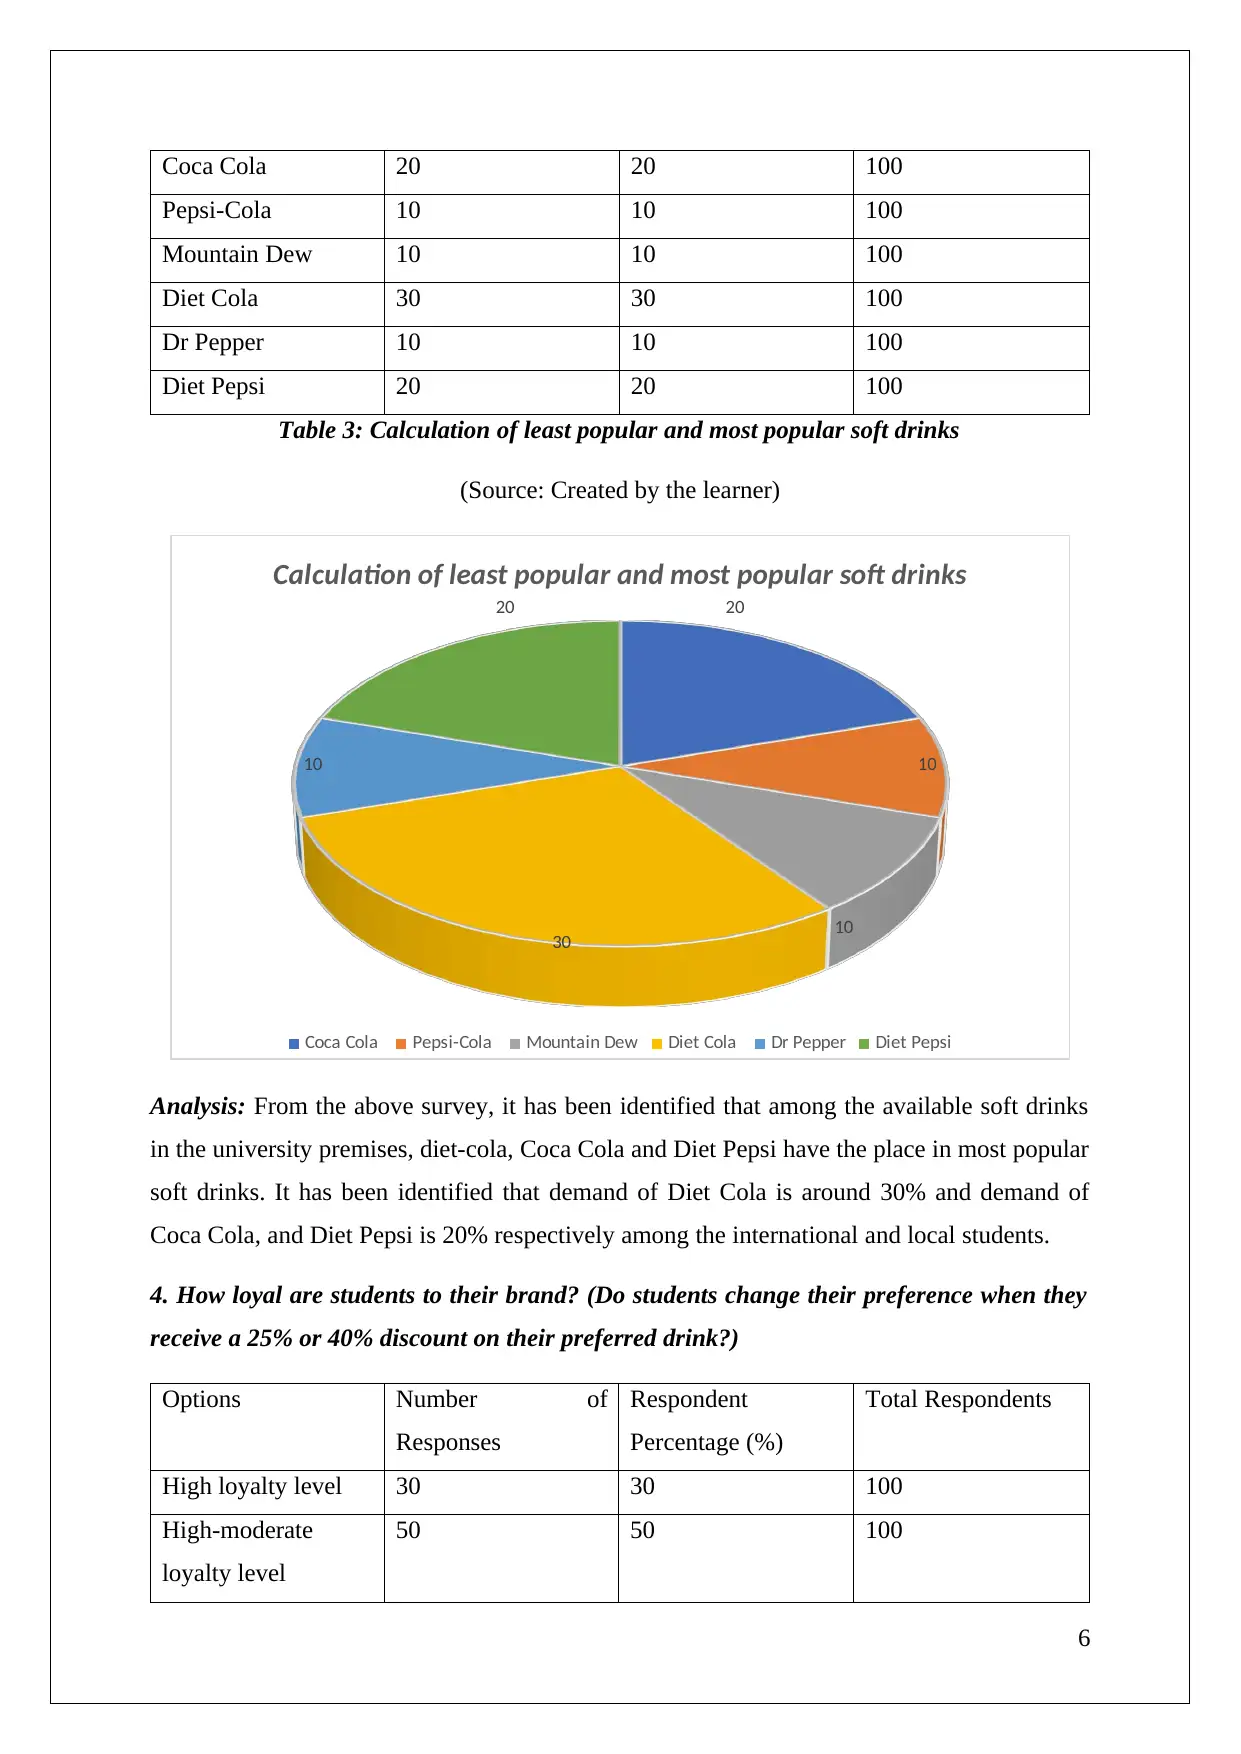
Table 3: Calculation of least popular and most popular soft drinks
(Source: Created by the learner)
20
10
10
30
10
20
Calculation of least popular and most popular soft drinks
Coca Cola Pepsi-Cola Mountain Dew Diet Cola Dr Pepper Diet Pepsi
Analysis: From the above survey, it has been identified that among the available soft drinks
in the university premises, diet-cola, Coca Cola and Diet Pepsi have the place in most popular
soft drinks. It has been identified that demand of Diet Cola is around 30% and demand of
Coca Cola, and Diet Pepsi is 20% respectively among the international and local students.
4. How loyal are students to their brand? (Do students change their preference when they
receive a 25% or 40% discount on their preferred drink?)
Options Number of
Responses
Respondent
Percentage (%)
Total Respondents
High loyalty level 30 30 100
High-moderate
loyalty level
50 50 100
6
Pepsi-Cola 10 10 100
Mountain Dew 10 10 100
Diet Cola 30 30 100
Dr Pepper 10 10 100
Diet Pepsi 20 20 100
Table 3: Calculation of least popular and most popular soft drinks
(Source: Created by the learner)
20
10
10
30
10
20
Calculation of least popular and most popular soft drinks
Coca Cola Pepsi-Cola Mountain Dew Diet Cola Dr Pepper Diet Pepsi
Analysis: From the above survey, it has been identified that among the available soft drinks
in the university premises, diet-cola, Coca Cola and Diet Pepsi have the place in most popular
soft drinks. It has been identified that demand of Diet Cola is around 30% and demand of
Coca Cola, and Diet Pepsi is 20% respectively among the international and local students.
4. How loyal are students to their brand? (Do students change their preference when they
receive a 25% or 40% discount on their preferred drink?)
Options Number of
Responses
Respondent
Percentage (%)
Total Respondents
High loyalty level 30 30 100
High-moderate
loyalty level
50 50 100
6
⊘ This is a preview!⊘
Do you want full access?
Subscribe today to unlock all pages.
Trusted by 1+ million students worldwide
Low loyalty level 20 20 100
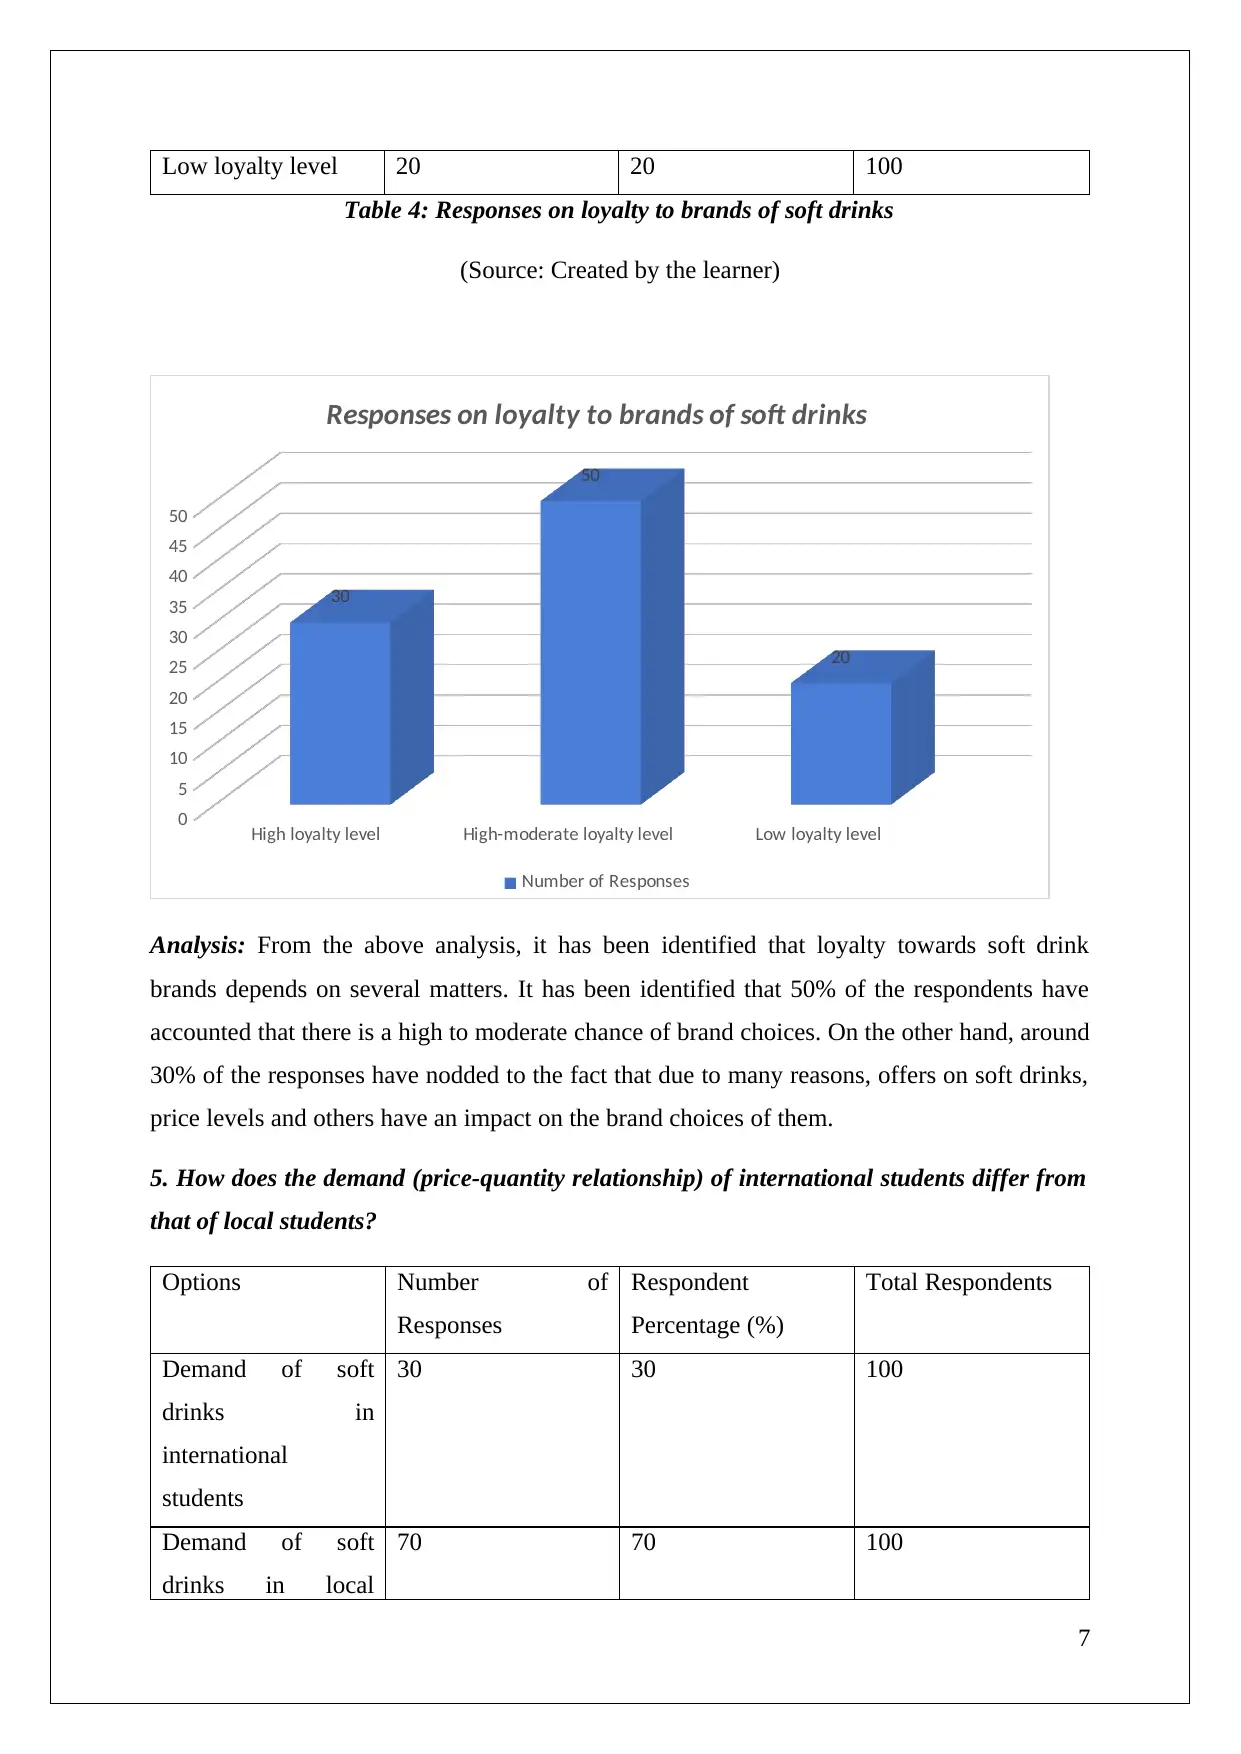
Table 4: Responses on loyalty to brands of soft drinks
(Source: Created by the learner)
High loyalty level High-moderate loyalty level Low loyalty level
0
5
10
15
20
25
30
35
40
45
50
30
50
20
Responses on loyalty to brands of soft drinks
Number of Responses
Analysis: From the above analysis, it has been identified that loyalty towards soft drink
brands depends on several matters. It has been identified that 50% of the respondents have
accounted that there is a high to moderate chance of brand choices. On the other hand, around
30% of the responses have nodded to the fact that due to many reasons, offers on soft drinks,
price levels and others have an impact on the brand choices of them.
5. How does the demand (price-quantity relationship) of international students differ from
that of local students?
Options Number of
Responses
Respondent
Percentage (%)
Total Respondents
Demand of soft
drinks in
international
students
30 30 100
Demand of soft
drinks in local
70 70 100
7
Paraphrase This Document
Need a fresh take? Get an instant paraphrase of this document with our AI Paraphraser
students
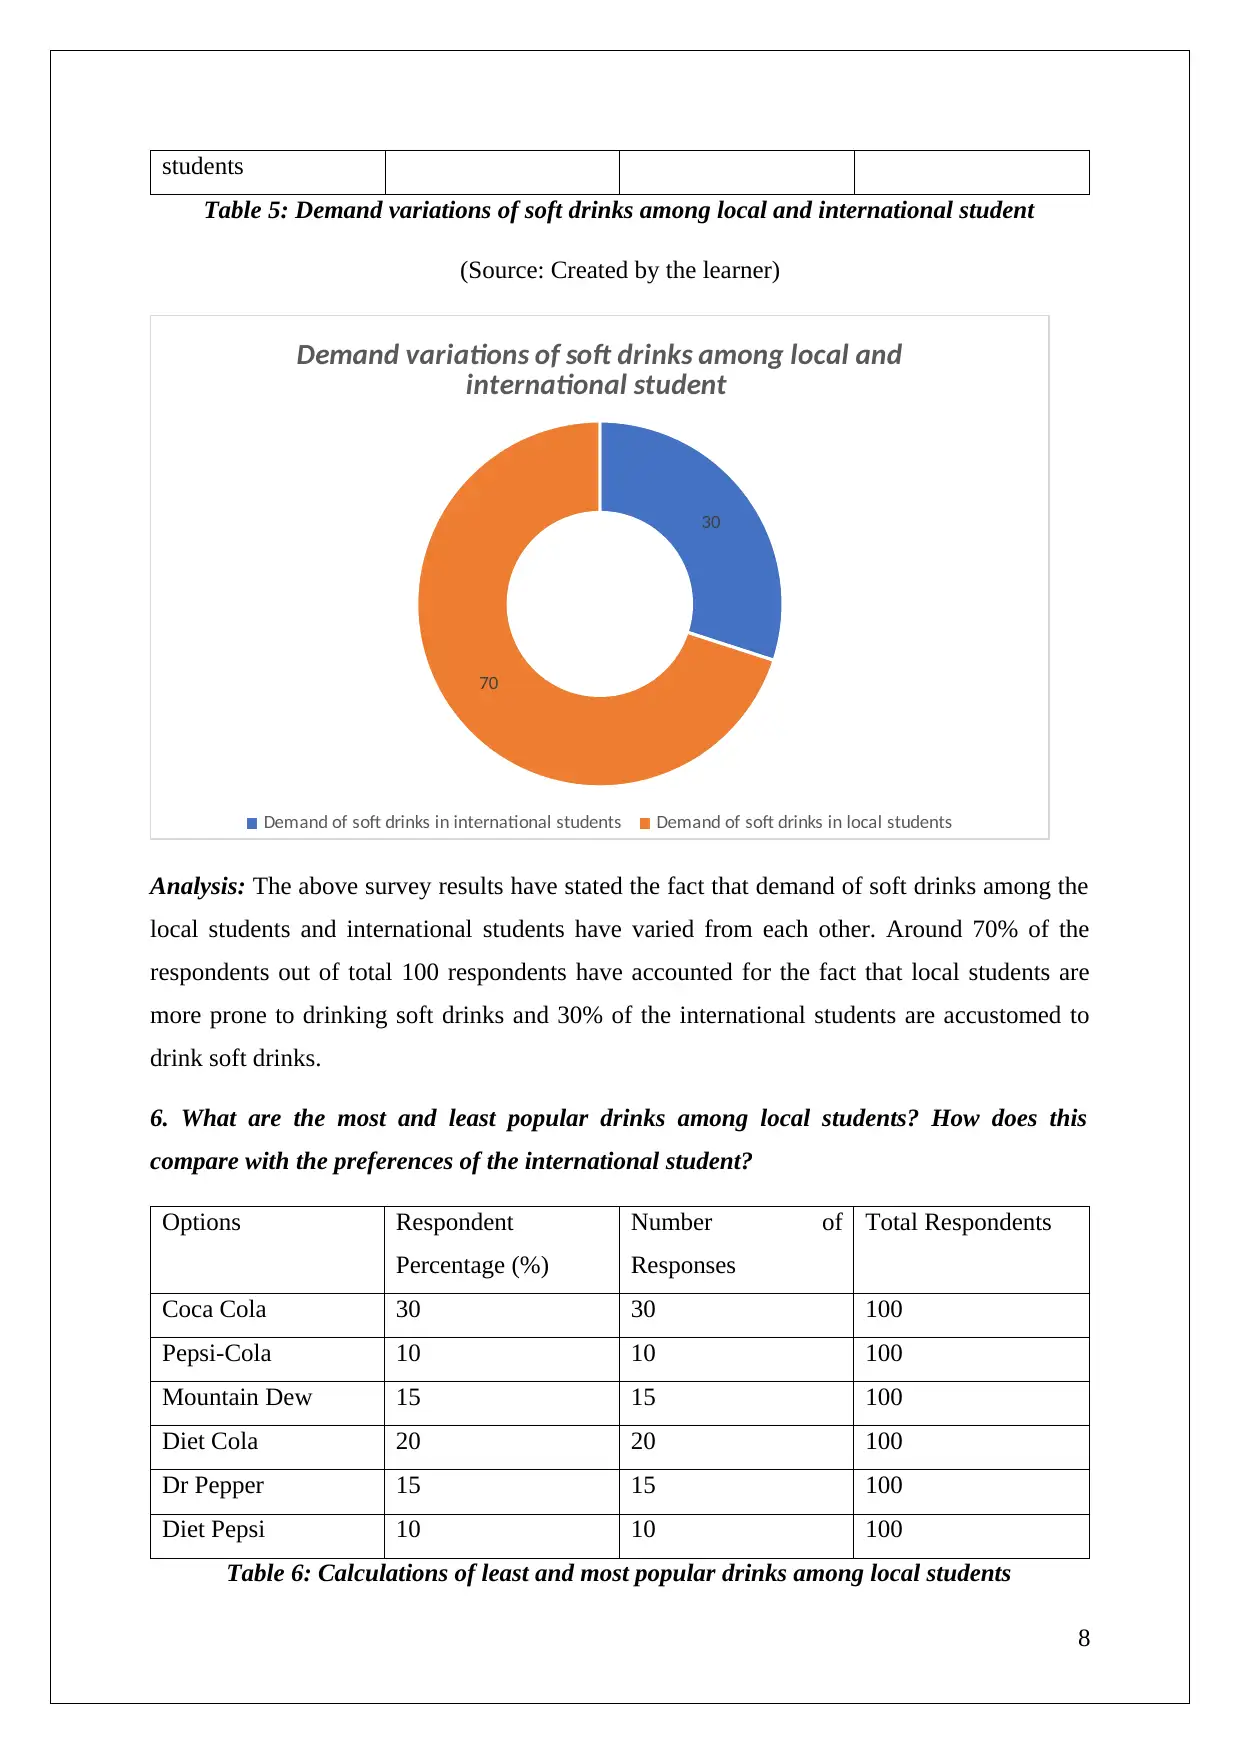
Table 5: Demand variations of soft drinks among local and international student
(Source: Created by the learner)
30
70
Demand variations of soft drinks among local and
international student
Demand of soft drinks in international students Demand of soft drinks in local students
Analysis: The above survey results have stated the fact that demand of soft drinks among the
local students and international students have varied from each other. Around 70% of the
respondents out of total 100 respondents have accounted for the fact that local students are
more prone to drinking soft drinks and 30% of the international students are accustomed to
drink soft drinks.
6. What are the most and least popular drinks among local students? How does this
compare with the preferences of the international student?
Options Respondent
Percentage (%)
Number of
Responses
Total Respondents
Coca Cola 30 30 100
Pepsi-Cola 10 10 100
Mountain Dew 15 15 100
Diet Cola 20 20 100
Dr Pepper 15 15 100
Diet Pepsi 10 10 100
Table 6: Calculations of least and most popular drinks among local students
8
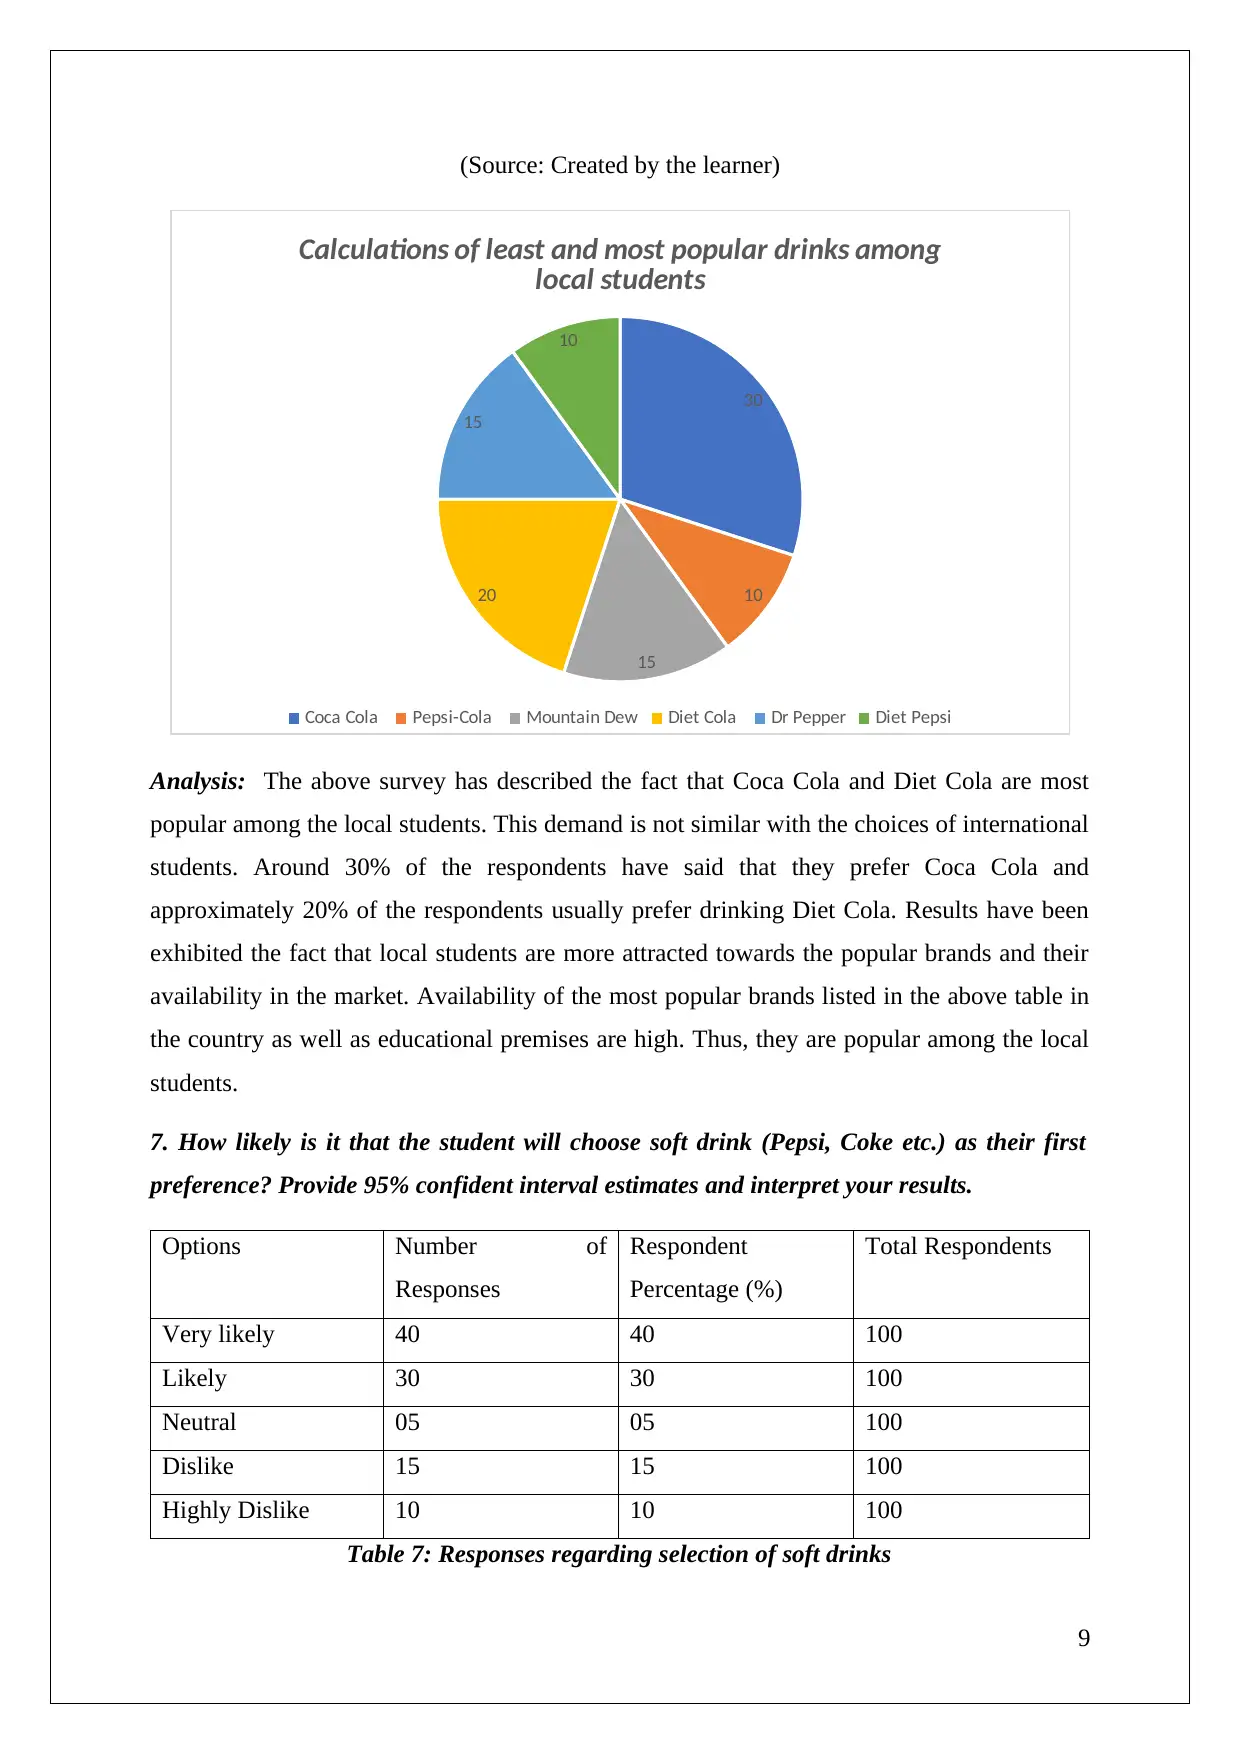
(Source: Created by the learner)
30
10
15
20
15
10
Calculations of least and most popular drinks among
local students
Coca Cola Pepsi-Cola Mountain Dew Diet Cola Dr Pepper Diet Pepsi
Analysis: The above survey has described the fact that Coca Cola and Diet Cola are most
popular among the local students. This demand is not similar with the choices of international
students. Around 30% of the respondents have said that they prefer Coca Cola and
approximately 20% of the respondents usually prefer drinking Diet Cola. Results have been
exhibited the fact that local students are more attracted towards the popular brands and their
availability in the market. Availability of the most popular brands listed in the above table in
the country as well as educational premises are high. Thus, they are popular among the local
students.
7. How likely is it that the student will choose soft drink (Pepsi, Coke etc.) as their first
preference? Provide 95% confident interval estimates and interpret your results.
Options Number of
Responses
Respondent
Percentage (%)
Total Respondents
Very likely 40 40 100
Likely 30 30 100
Neutral 05 05 100
Dislike 15 15 100
Highly Dislike 10 10 100
Table 7: Responses regarding selection of soft drinks
9
⊘ This is a preview!⊘
Do you want full access?
Subscribe today to unlock all pages.
Trusted by 1+ million students worldwide
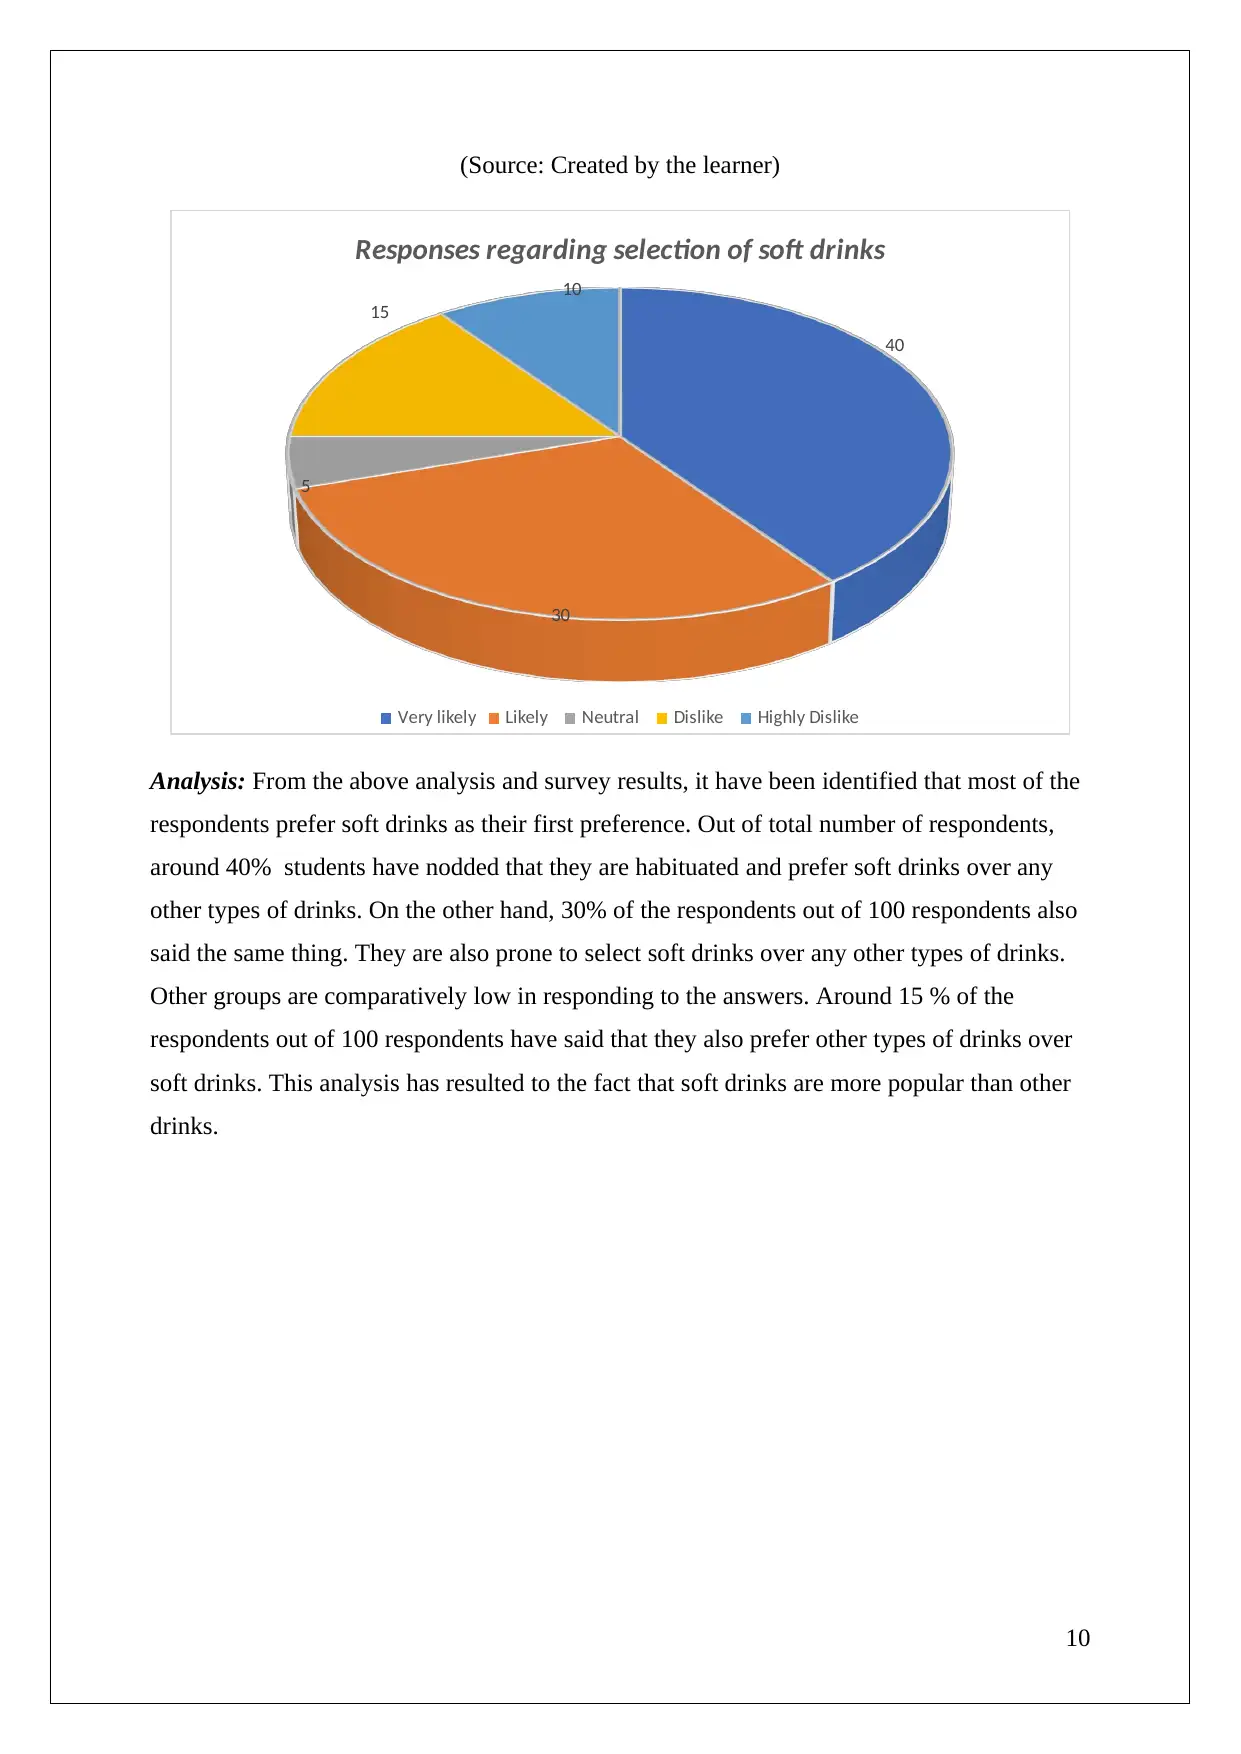
(Source: Created by the learner)
40
30
5
15
10
Responses regarding selection of soft drinks
Very likely Likely Neutral Dislike Highly Dislike
Analysis: From the above analysis and survey results, it have been identified that most of the
respondents prefer soft drinks as their first preference. Out of total number of respondents,
around 40% students have nodded that they are habituated and prefer soft drinks over any
other types of drinks. On the other hand, 30% of the respondents out of 100 respondents also
said the same thing. They are also prone to select soft drinks over any other types of drinks.
Other groups are comparatively low in responding to the answers. Around 15 % of the
respondents out of 100 respondents have said that they also prefer other types of drinks over
soft drinks. This analysis has resulted to the fact that soft drinks are more popular than other
drinks.
10
Paraphrase This Document
Need a fresh take? Get an instant paraphrase of this document with our AI Paraphraser
3. Summary
Above survey results and questions have documented various facts about the soft drink sale
and preferences of soft drinks among the students. Around fifty percent of the responses are
accounted as positive. The behaviours and preferences of both local and international
students in the aforesaid University are accounted effectively. The soft drink consumption
rates among students are quite good. They are attracted towards the brand value (Deliens et
al., 2015). Therefore, companies and market players in the soft drink industry should take
care about their brand value. On the other hand, consumption rate of soft drinks among
students also depend on the price variety. They are prone to switch brands of drinks if they
get interesting offers on the daily beverages. On the other hand, from the above analysis, it
could be said that choice of soft drinks among local and international students also varies.
International students prefer Diet soft drinks whereas the local students chose the usual soft
drinks. This is due to the fact that choices and drinking habits of local students are influenced
by the preferences of major popularity of the country. Companies should take care of the
healthy habits and nutritious drinks and their availability in the University premises
(Schneider, 2016). They should provide offers on the healthy soft drinks so that students get
attracted towards them and purchase them.
In this way, sale and demand of the healthy soft drinks could develop in the future. All the
results have been calculated through proper student numbers and their responses. On the
other hand, through this survey consumption rates and demand variables of soft drinks have
been successfully identified, which show the fact that pricing strategy and advertisement
strategies are one of the important factors to increase sale of products and services. Validity
of the research in survey process relates to the extent at which measurements involve in the
process are right. According to the sampling validity process it could be said that a specific
pattern has been identified for the entire sample design and sample number of the students as
well as the size of the sample also has been identified through specific methods of sampling
(Leung, 2015). All the analysis and results are valid as they are as documented as per the
responses of the students surveyed.
11
Reference list
Christopher, M., 2016. Logistics & supply chain management. Pearson UK.
Deliens, T., Clarys, P., De Bourdeaudhuij, I. and Deforche, B., 2015. Correlates of university
students’ soft and energy drink consumption according to gender and
residency. Nutrients, 7(8), pp.6550-6566.
Leung, L., 2015. Validity, reliability, and generalizability in qualitative research. Journal of
family medicine and primary care, 4(3), p.324.
Lewis, S., 2015. Qualitative inquiry and research design: Choosing among five
approaches. Health promotion practice, 16(4), pp.473-475.
Schneider, M.J., 2016. Introduction to public health. Jones & Bartlett Publishers.
Taylor, S.J., Bogdan, R. and DeVault, M., 2015. Introduction to qualitative research
methods: A guidebook and resource. John Wiley & Sons.
12
⊘ This is a preview!⊘
Do you want full access?
Subscribe today to unlock all pages.
Trusted by 1+ million students worldwide
1 out of 12
Related Documents


Your All-in-One AI-Powered Toolkit for Academic Success.
+13062052269
info@desklib.com
Available 24*7 on WhatsApp / Email
![[object Object]](/_next/static/media/star-bottom.7253800d.svg)
Unlock your academic potential
Copyright © 2020–2026 A2Z Services. All Rights Reserved. Developed and managed by ZUCOL.