Project Report: Analysis of USCOM Limited's Financial Performance
VerifiedAdded on 2020/05/11
|9
|1974
|120
Project
AI Summary
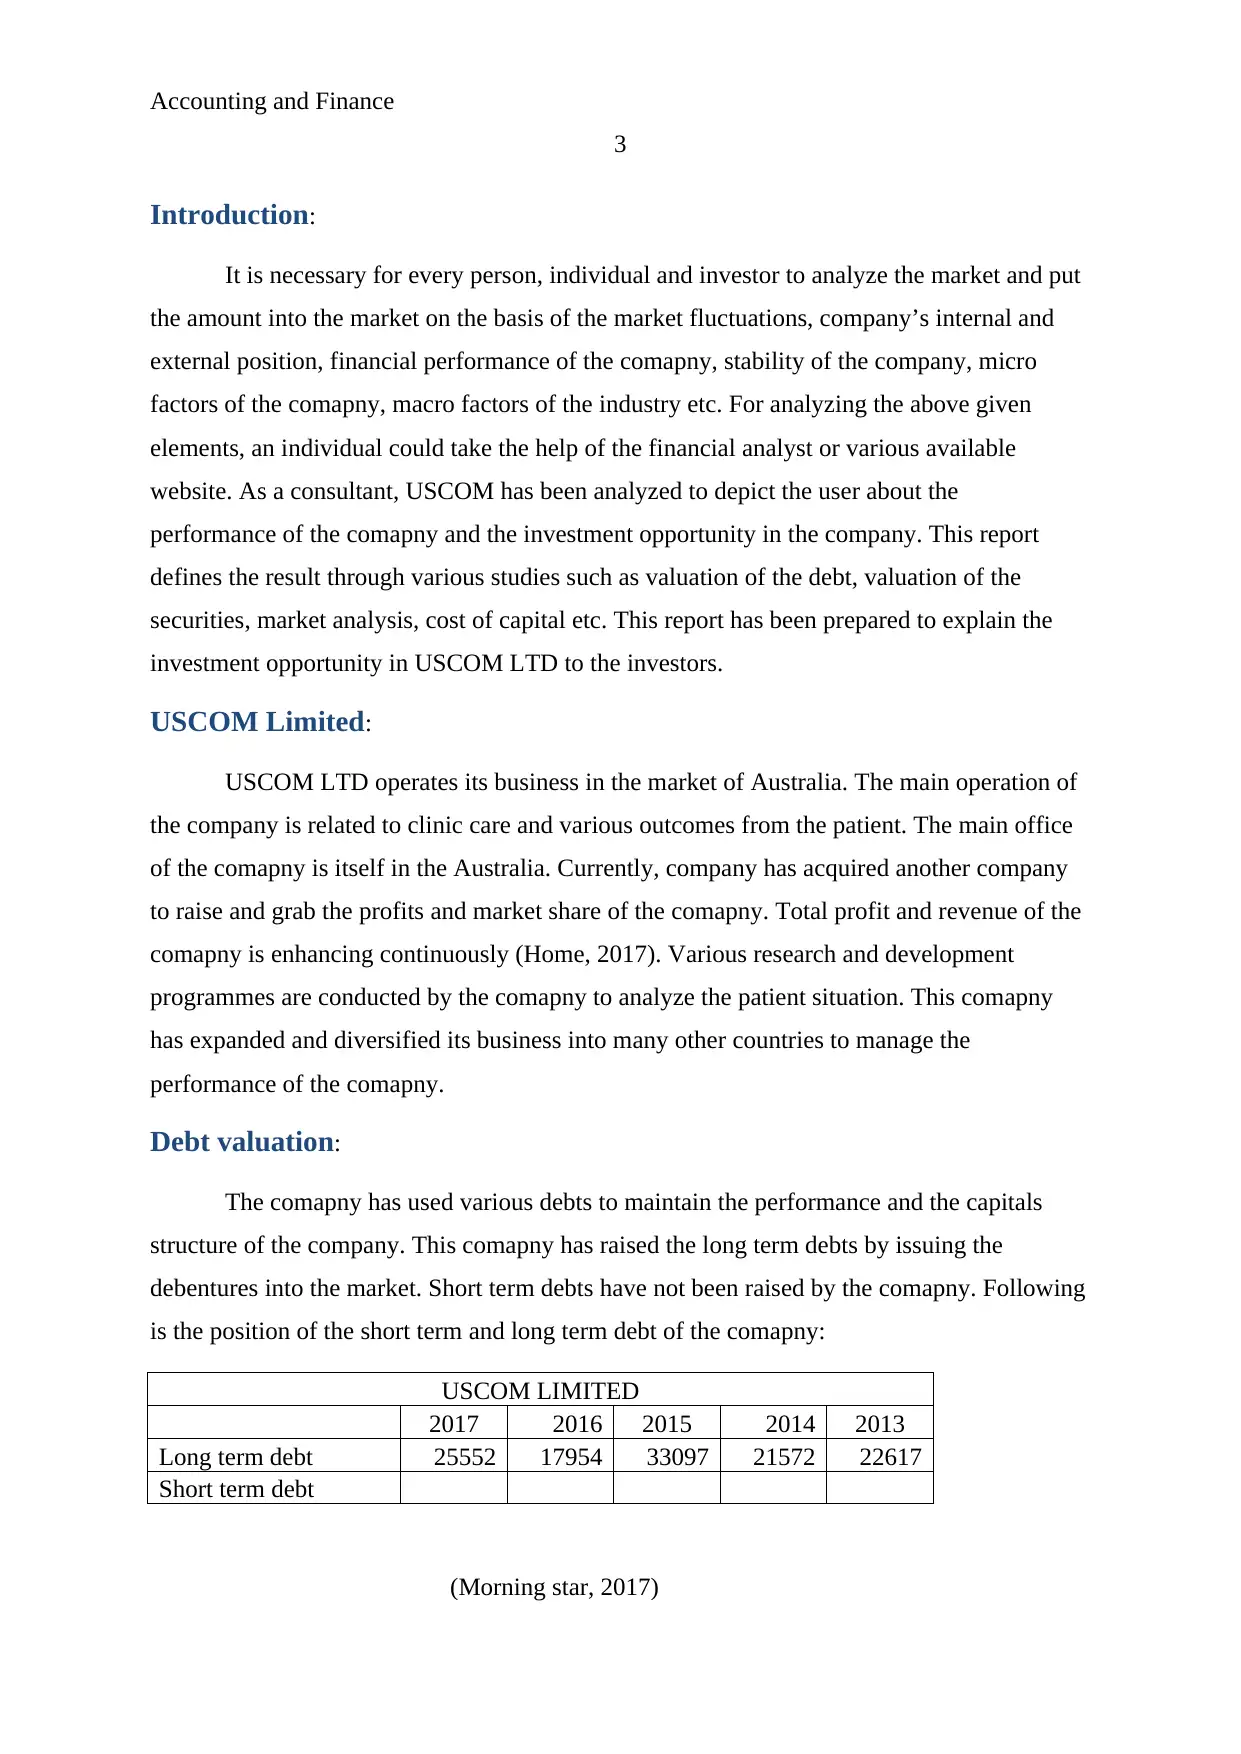
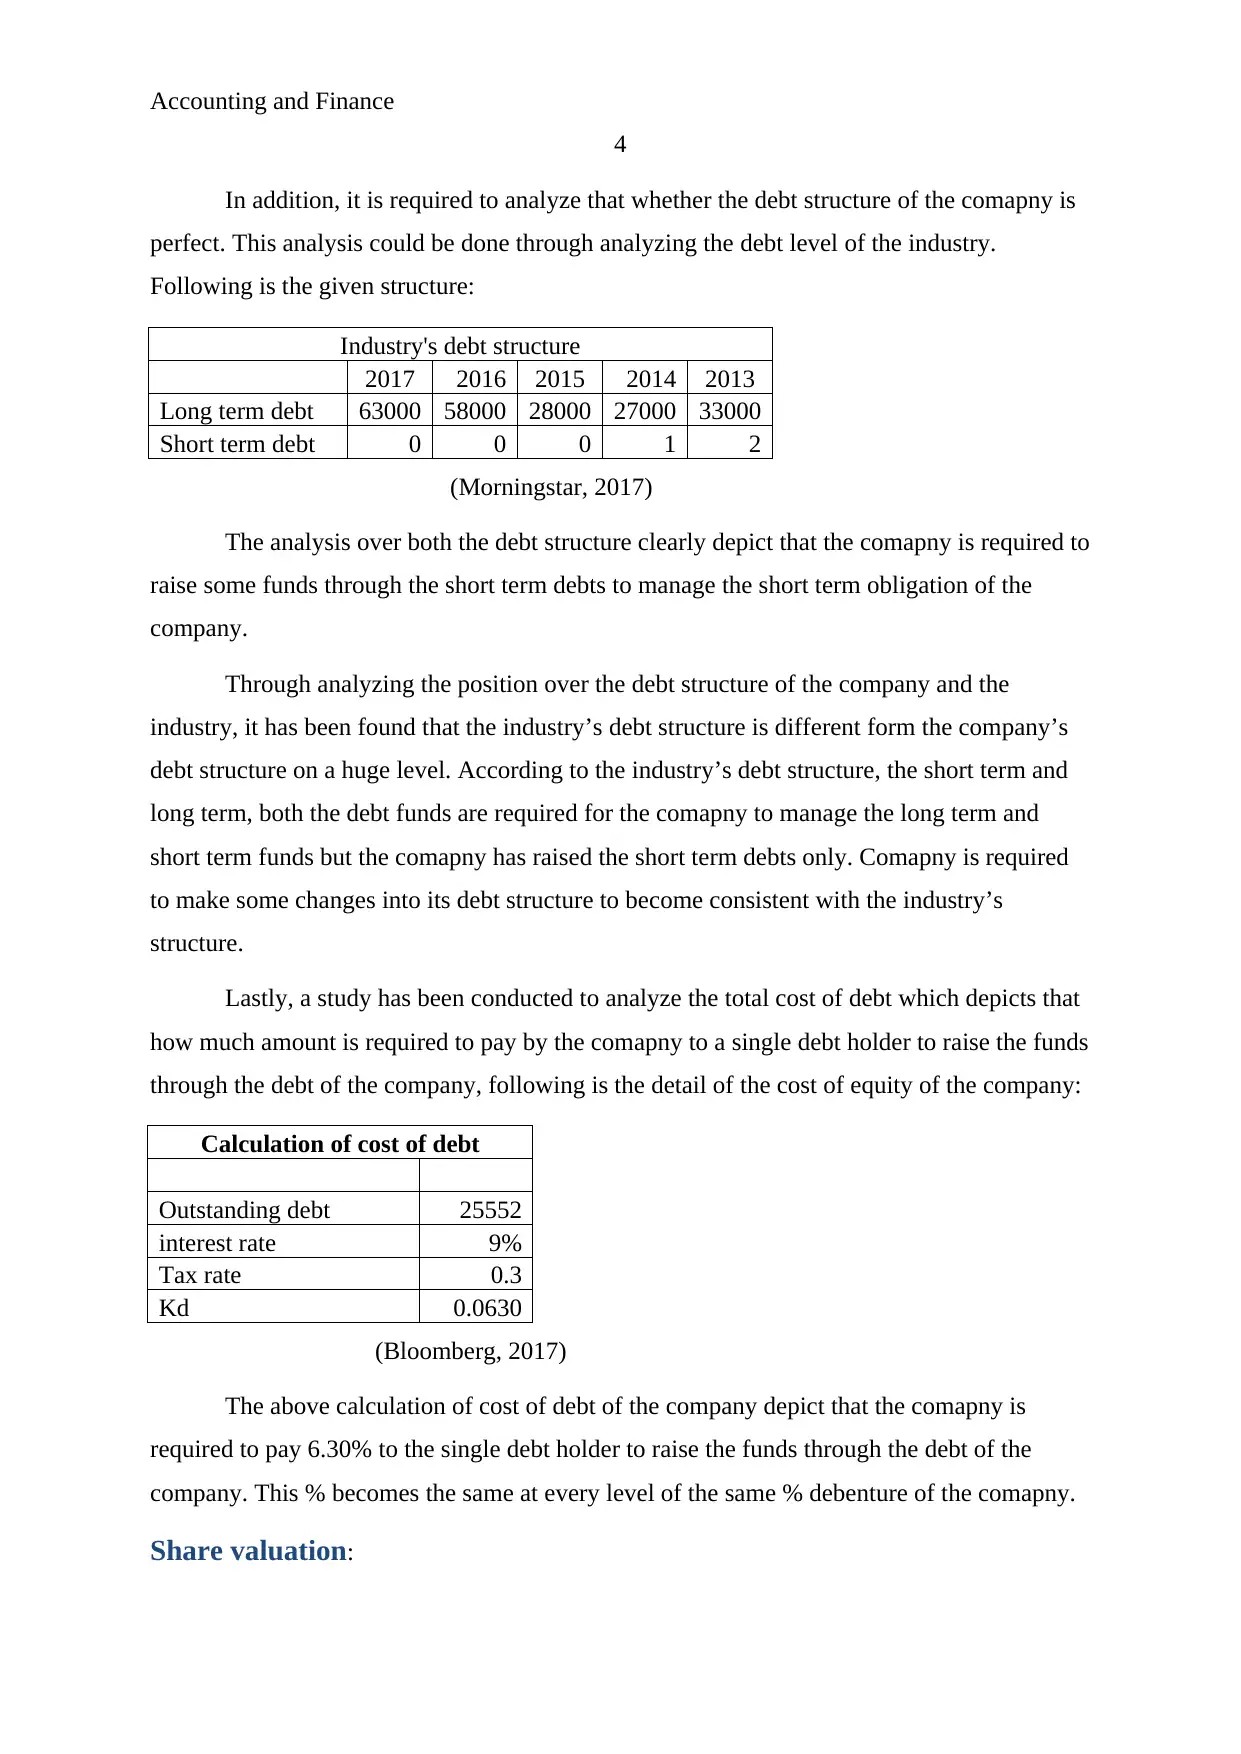
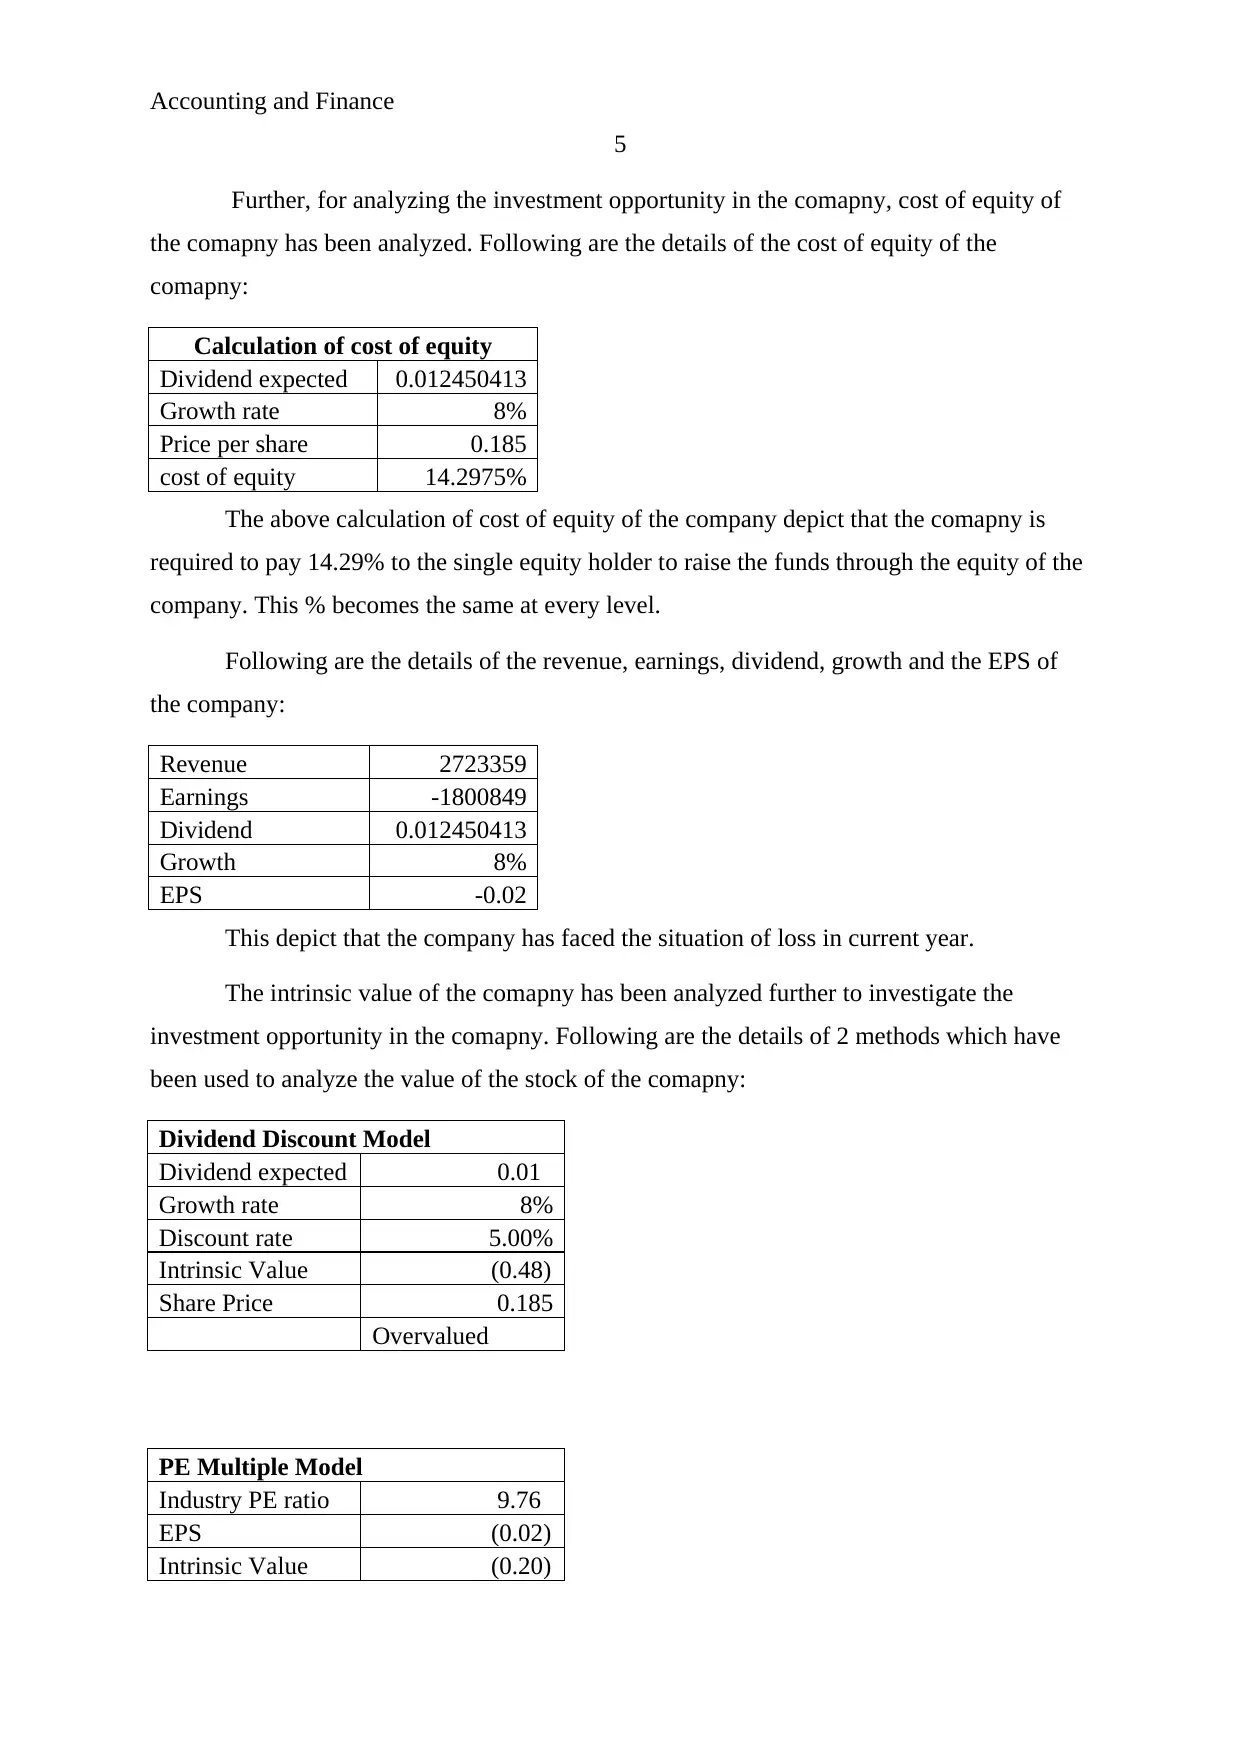
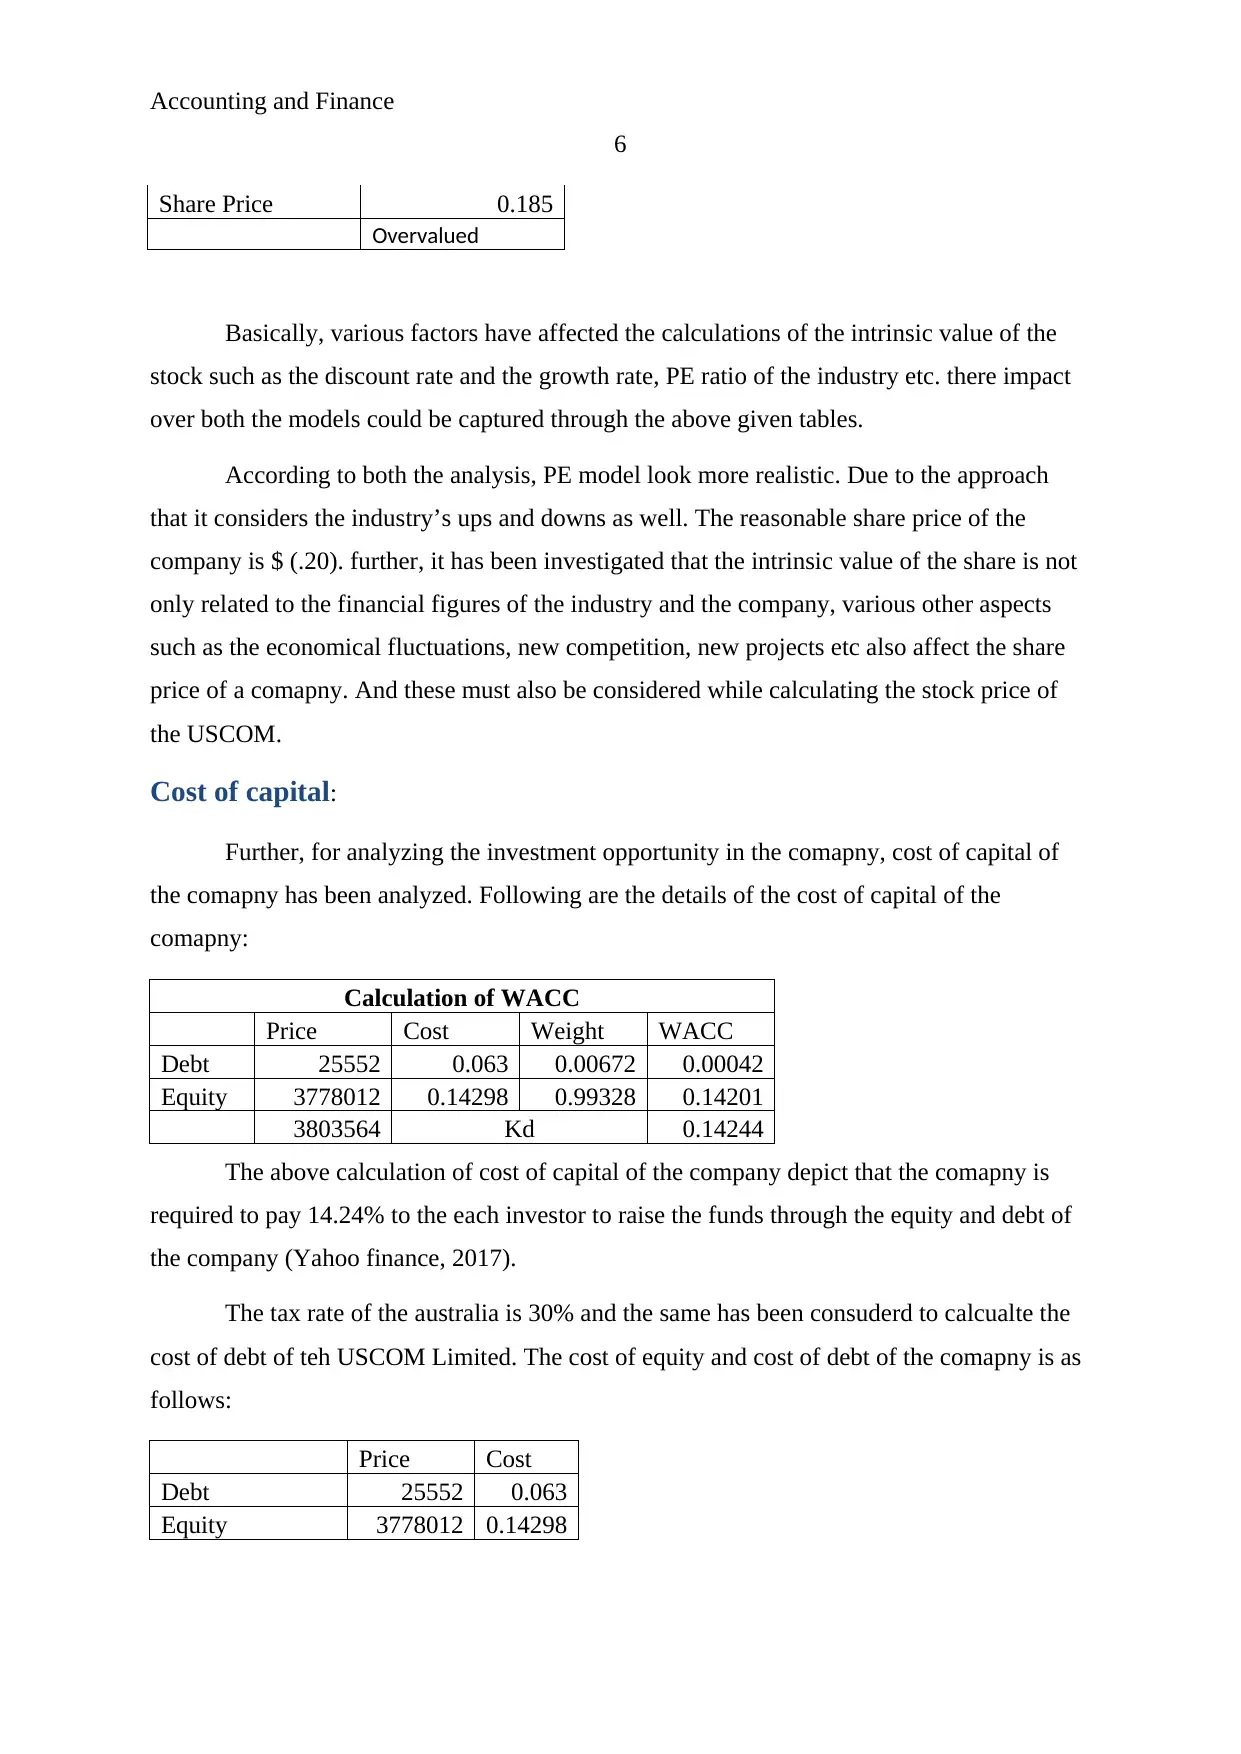
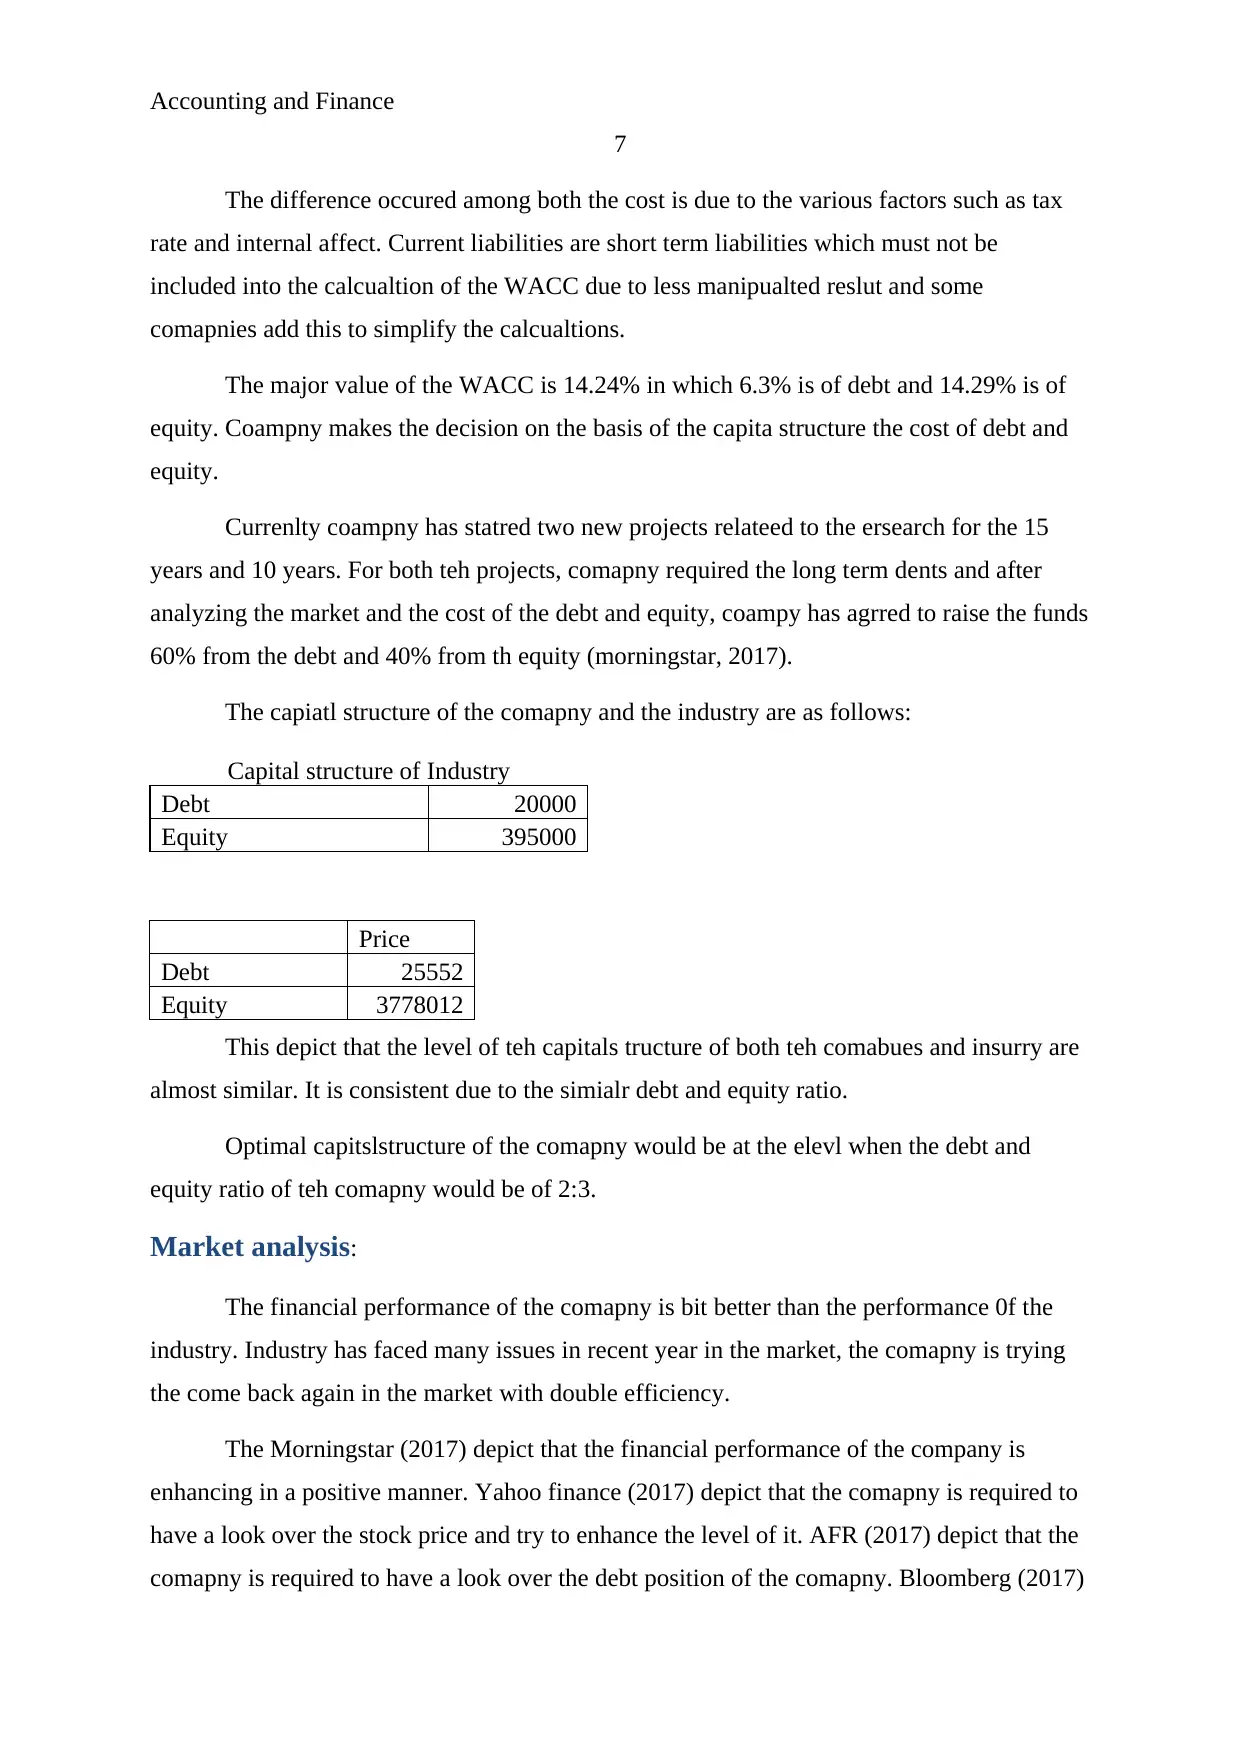
This project report provides a comprehensive financial analysis of USCOM Limited (USCOM LTD), an Australian company operating in the clinic care sector. The report begins with an introduction to the analysis of market fluctuations and company performance, emphasizing the importance of financial analysis for investment decisions. It examines USCOM LTD's debt valuation, comparing its debt structure to industry standards and calculating the cost of debt. The report then moves on to share valuation, including the calculation of the cost of equity, analysis of revenue, earnings, dividends, and EPS, and the application of dividend discount and PE multiple models to determine the intrinsic value of the stock. The analysis also covers the company's cost of capital, including the weighted average cost of capital (WACC), and compares the company's capital structure to the industry. Finally, the report provides a market analysis, discussing the company's financial performance, external factors impacting the company, and potential investment opportunities, referencing various financial sources.

Running Head: Accouting and Finance
1
Project Report: Introduction to Accounting and Finance
1
Project Report: Introduction to Accounting and Finance
Paraphrase This Document
Need a fresh take? Get an instant paraphrase of this document with our AI Paraphraser

Accounting and Finance
2
Contents
Introduction.......................................................................................................................3
USCOM Limited..............................................................................................................3
Debt valuation...................................................................................................................3
Share valuation.................................................................................................................4
Cost of capital...................................................................................................................6
Market analysis.................................................................................................................7
References.........................................................................................................................9

Accounting and Finance
3
Introduction:
It is necessary for every person, individual and investor to analyze the market and put
the amount into the market on the basis of the market fluctuations, company’s internal and
external position, financial performance of the comapny, stability of the company, micro
factors of the comapny, macro factors of the industry etc. For analyzing the above given
elements, an individual could take the help of the financial analyst or various available
website. As a consultant, USCOM has been analyzed to depict the user about the
performance of the comapny and the investment opportunity in the company. This report
defines the result through various studies such as valuation of the debt, valuation of the
securities, market analysis, cost of capital etc. This report has been prepared to explain the
investment opportunity in USCOM LTD to the investors.
USCOM Limited:
USCOM LTD operates its business in the market of Australia. The main operation of
the company is related to clinic care and various outcomes from the patient. The main office
of the comapny is itself in the Australia. Currently, company has acquired another company
to raise and grab the profits and market share of the comapny. Total profit and revenue of the
comapny is enhancing continuously (Home, 2017). Various research and development
programmes are conducted by the comapny to analyze the patient situation. This comapny
has expanded and diversified its business into many other countries to manage the
performance of the comapny.
Debt valuation:
The comapny has used various debts to maintain the performance and the capitals
structure of the company. This comapny has raised the long term debts by issuing the
debentures into the market. Short term debts have not been raised by the comapny. Following
is the position of the short term and long term debt of the comapny:
USCOM LIMITED
2017 2016 2015 2014 2013
Long term debt 25552 17954 33097 21572 22617
Short term debt
(Morning star, 2017)
⊘ This is a preview!⊘
Do you want full access?
Subscribe today to unlock all pages.

Trusted by 1+ million students worldwide

Accounting and Finance
4
In addition, it is required to analyze that whether the debt structure of the comapny is
perfect. This analysis could be done through analyzing the debt level of the industry.
Following is the given structure:
Industry's debt structure
2017 2016 2015 2014 2013
Long term debt 63000 58000 28000 27000 33000
Short term debt 0 0 0 1 2
(Morningstar, 2017)
The analysis over both the debt structure clearly depict that the comapny is required to
raise some funds through the short term debts to manage the short term obligation of the
company.
Through analyzing the position over the debt structure of the company and the
industry, it has been found that the industry’s debt structure is different form the company’s
debt structure on a huge level. According to the industry’s debt structure, the short term and
long term, both the debt funds are required for the comapny to manage the long term and
short term funds but the comapny has raised the short term debts only. Comapny is required
to make some changes into its debt structure to become consistent with the industry’s
structure.
Lastly, a study has been conducted to analyze the total cost of debt which depicts that
how much amount is required to pay by the comapny to a single debt holder to raise the funds
through the debt of the company, following is the detail of the cost of equity of the company:
Calculation of cost of debt
Outstanding debt 25552
interest rate 9%
Tax rate 0.3
Kd 0.0630
(Bloomberg, 2017)
The above calculation of cost of debt of the company depict that the comapny is
required to pay 6.30% to the single debt holder to raise the funds through the debt of the
company. This % becomes the same at every level of the same % debenture of the comapny.
Share valuation:
Paraphrase This Document
Need a fresh take? Get an instant paraphrase of this document with our AI Paraphraser

Accounting and Finance
5
Further, for analyzing the investment opportunity in the comapny, cost of equity of
the comapny has been analyzed. Following are the details of the cost of equity of the
comapny:
Calculation of cost of equity
Dividend expected 0.012450413
Growth rate 8%
Price per share 0.185
cost of equity 14.2975%
The above calculation of cost of equity of the company depict that the comapny is
required to pay 14.29% to the single equity holder to raise the funds through the equity of the
company. This % becomes the same at every level.
Following are the details of the revenue, earnings, dividend, growth and the EPS of
the company:
Revenue 2723359
Earnings -1800849
Dividend 0.012450413
Growth 8%
EPS -0.02
This depict that the company has faced the situation of loss in current year.
The intrinsic value of the comapny has been analyzed further to investigate the
investment opportunity in the comapny. Following are the details of 2 methods which have
been used to analyze the value of the stock of the comapny:
Dividend Discount Model
Dividend expected 0.01
Growth rate 8%
Discount rate 5.00%
Intrinsic Value (0.48)
Share Price 0.185
Overvalued
PE Multiple Model
Industry PE ratio 9.76
EPS (0.02)
Intrinsic Value (0.20)

Accounting and Finance
6
Share Price 0.185
Overvalued
Basically, various factors have affected the calculations of the intrinsic value of the
stock such as the discount rate and the growth rate, PE ratio of the industry etc. there impact
over both the models could be captured through the above given tables.
According to both the analysis, PE model look more realistic. Due to the approach
that it considers the industry’s ups and downs as well. The reasonable share price of the
company is $ (.20). further, it has been investigated that the intrinsic value of the share is not
only related to the financial figures of the industry and the company, various other aspects
such as the economical fluctuations, new competition, new projects etc also affect the share
price of a comapny. And these must also be considered while calculating the stock price of
the USCOM.
Cost of capital:
Further, for analyzing the investment opportunity in the comapny, cost of capital of
the comapny has been analyzed. Following are the details of the cost of capital of the
comapny:
Calculation of WACC
Price Cost Weight WACC
Debt 25552 0.063 0.00672 0.00042
Equity 3778012 0.14298 0.99328 0.14201
3803564 Kd 0.14244
The above calculation of cost of capital of the company depict that the comapny is
required to pay 14.24% to the each investor to raise the funds through the equity and debt of
the company (Yahoo finance, 2017).
The tax rate of the australia is 30% and the same has been consuderd to calcualte the
cost of debt of teh USCOM Limited. The cost of equity and cost of debt of the comapny is as
follows:
Price Cost
Debt 25552 0.063
Equity 3778012 0.14298
⊘ This is a preview!⊘
Do you want full access?
Subscribe today to unlock all pages.

Trusted by 1+ million students worldwide

Accounting and Finance
7
The difference occured among both the cost is due to the various factors such as tax
rate and internal affect. Current liabilities are short term liabilities which must not be
included into the calcualtion of the WACC due to less manipualted reslut and some
comapnies add this to simplify the calcualtions.
The major value of the WACC is 14.24% in which 6.3% is of debt and 14.29% is of
equity. Coampny makes the decision on the basis of the capita structure the cost of debt and
equity.
Currenlty coampny has statred two new projects relateed to the ersearch for the 15
years and 10 years. For both teh projects, comapny required the long term dents and after
analyzing the market and the cost of the debt and equity, coampy has agrred to raise the funds
60% from the debt and 40% from th equity (morningstar, 2017).
The capiatl structure of the comapny and the industry are as follows:
Capital structure of Industry
Debt 20000
Equity 395000
Price
Debt 25552
Equity 3778012
This depict that the level of teh capitals tructure of both teh comabues and insurry are
almost similar. It is consistent due to the simialr debt and equity ratio.
Optimal capitslstructure of the comapny would be at the elevl when the debt and
equity ratio of teh comapny would be of 2:3.
Market analysis:
The financial performance of the comapny is bit better than the performance 0f the
industry. Industry has faced many issues in recent year in the market, the comapny is trying
the come back again in the market with double efficiency.
The Morningstar (2017) depict that the financial performance of the company is
enhancing in a positive manner. Yahoo finance (2017) depict that the comapny is required to
have a look over the stock price and try to enhance the level of it. AFR (2017) depict that the
comapny is required to have a look over the debt position of the comapny. Bloomberg (2017)
Paraphrase This Document
Need a fresh take? Get an instant paraphrase of this document with our AI Paraphraser

Accounting and Finance
8
depict that the company is required to manage the optimal capital structure to maintain the
level of the risk and the cost in an efficient manner (Google finance, 2017). The position of
the comapny could be better through changing the capital structure of the comapny. It has
also been said about the company that the financial crisis has impacted the operations and the
activities of the comapny.
According to the report, it has been analyzed that the comapny is required to make
some changes into its current policies to make the financial performance bit better. The
investors could invest in the comapny for the long term as according to the prediction, the
performance of the comapny would be better in near future.

Accounting and Finance
9
References:
AFR. 2017. USCOM LTD. Retrieved from
http://www.afr.com/research-tools/UCM/company-profile/operational-history available on
17th Oct 2017.
Bloomberg. 2017. USCOM LTD. Retrieved from
https://www.bloomberg.com/quote/UCM:AU available on 17th Oct 2017.
Google finance. 2017. USCOM LTD. Retrieved from http://finance.google.com/finance?
q=ASX:UCM available on 17th Oct 2017.
Home. 2017. USCOM LTD. Retrieved from http://www.uscom.com/ available on 17th Oct
2017.
Morningstar. 2017. USCOM LTD. Reterived from
http://financials.morningstar.com/company-profile/c.action?
t=UCM®ion=usa&culture=en-US available on 17th Oct 2017.
Yahoo finance. 2017. USCOM LTD. Retrieved from
https://finance.yahoo.com/quote/ucm.ax?ltr=1 available on 17th Oct 2017.
⊘ This is a preview!⊘
Do you want full access?
Subscribe today to unlock all pages.

Trusted by 1+ million students worldwide
1 out of 9
Related Documents

Your All-in-One AI-Powered Toolkit for Academic Success.
+13062052269
info@desklib.com
Available 24*7 on WhatsApp / Email
Unlock your academic potential
Copyright © 2020–2025 A2Z Services. All Rights Reserved. Developed and managed by ZUCOL.