Statistical Analysis of Used Car Prices: Regression Assignment

Verified

Added on  2020/05/08

|3
|769
|40
Homework Assignment
AI Summary
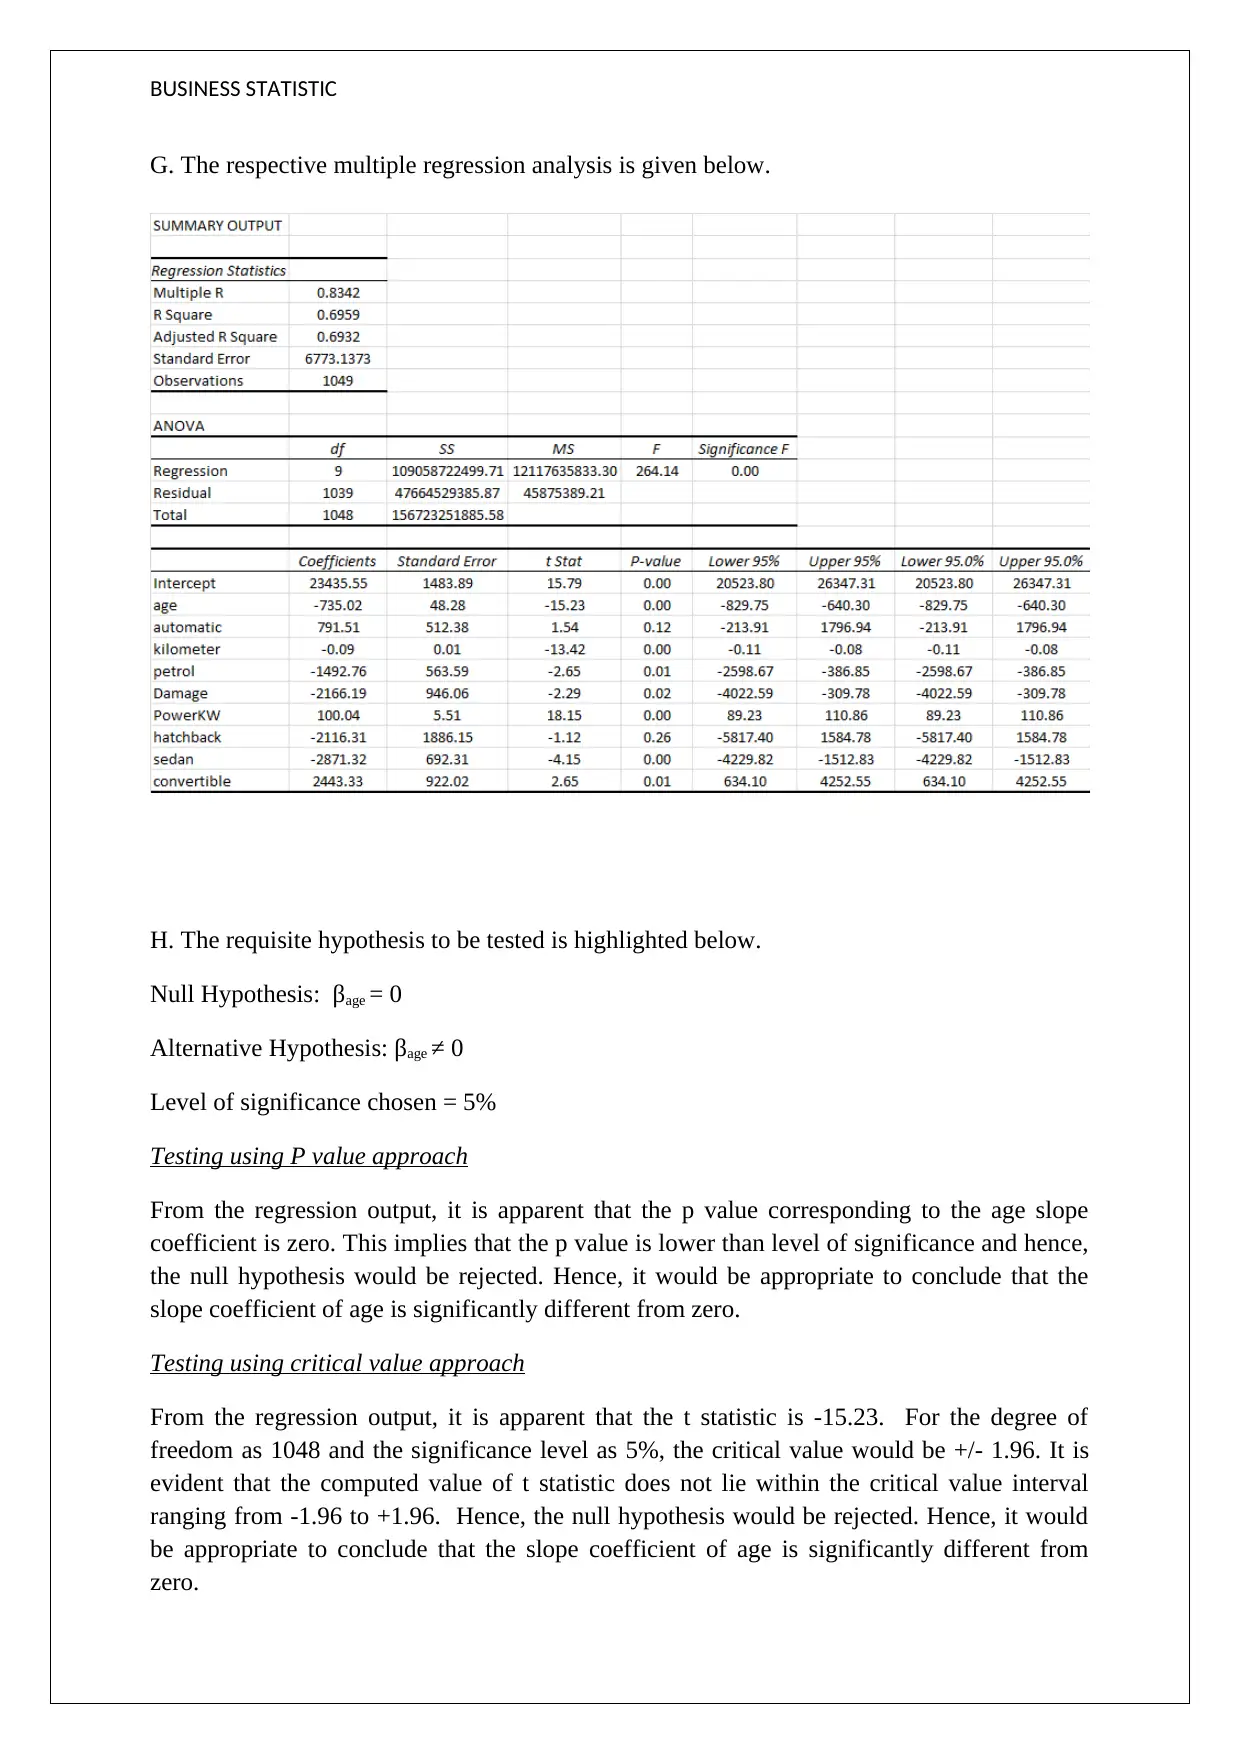
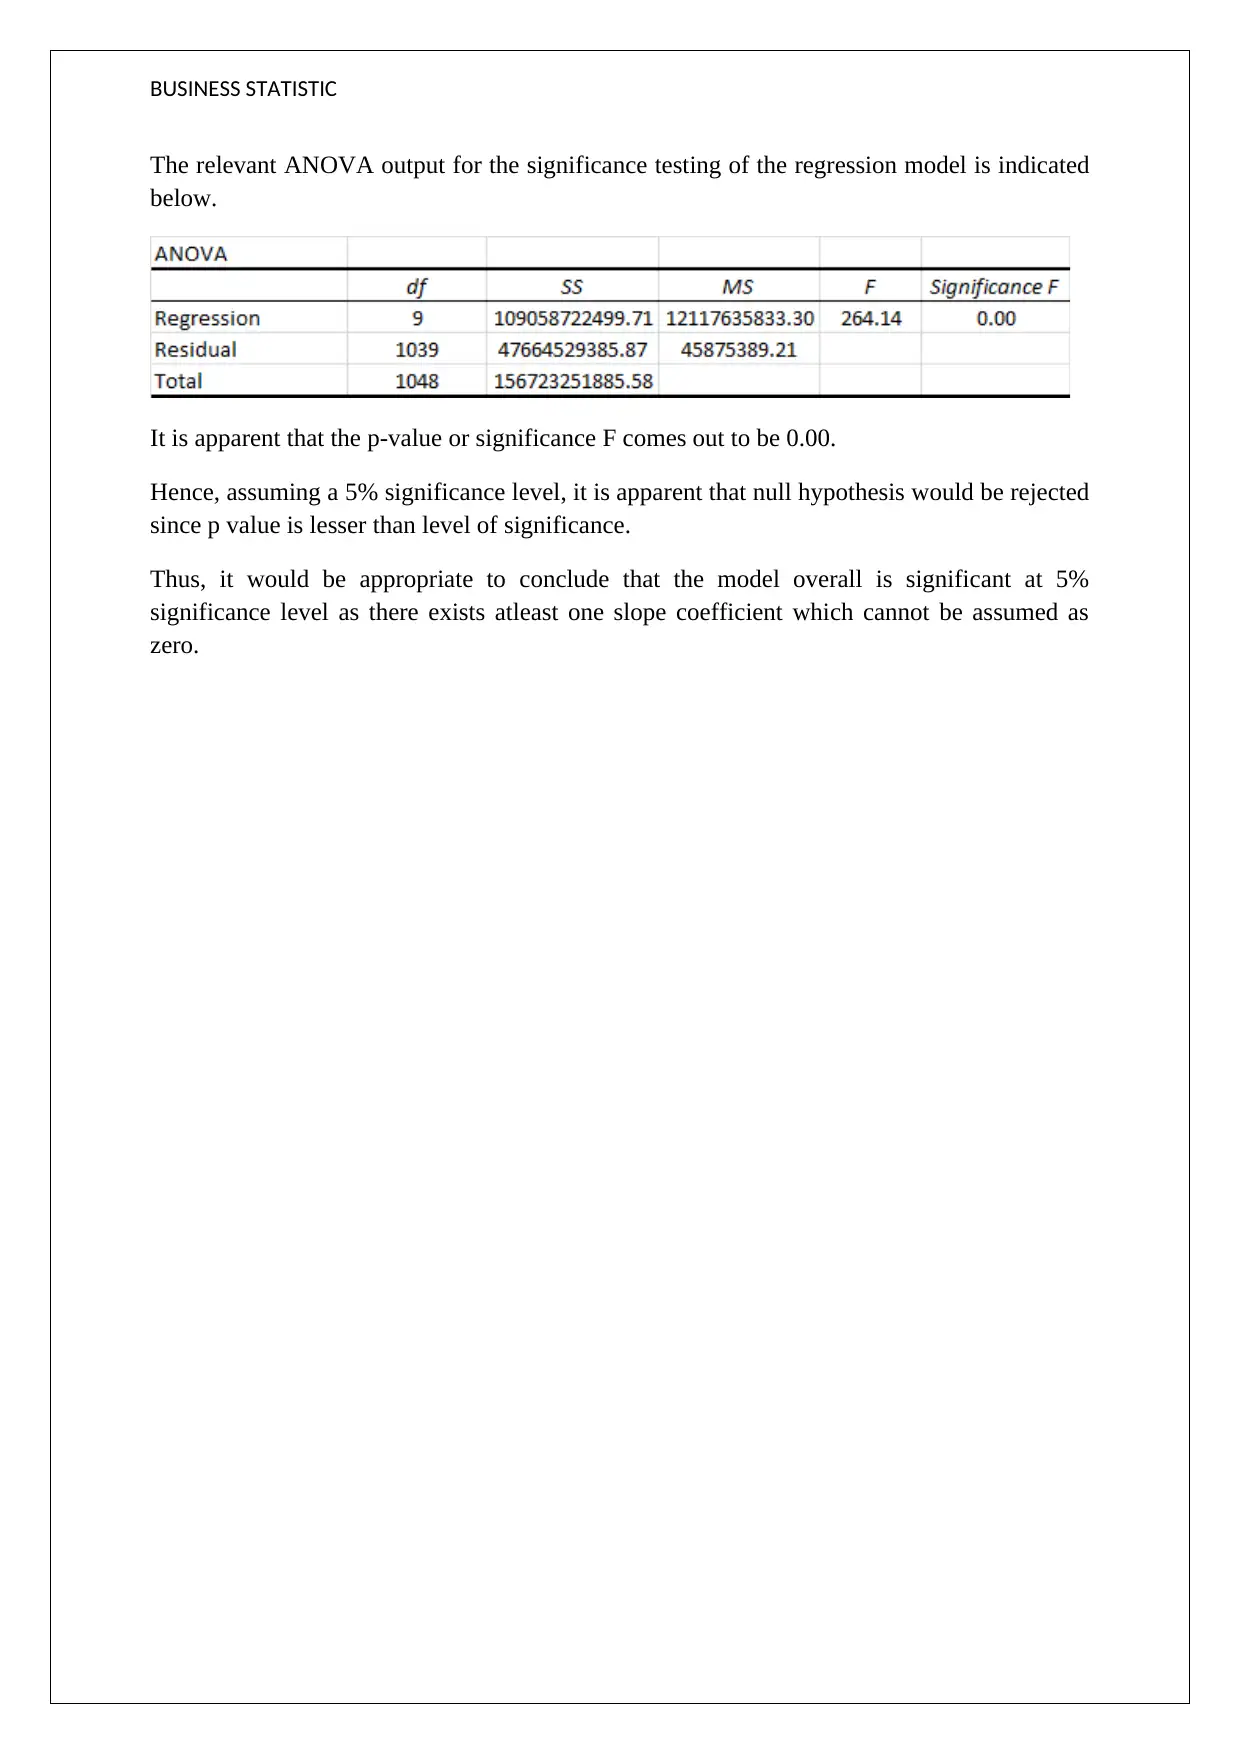
This assignment presents a comprehensive regression analysis of used car prices, exploring the relationship between various independent variables and the dependent variable, price. The analysis includes hypothesis testing using both p-value and critical value approaches to assess the significance of the age variable's slope coefficient. The interpretation of the coefficients for variables such as age, transmission type, mileage, fuel type, damage, engine power, and car body styles (hatchback, sedan, convertible) is provided, detailing how each variable impacts the used car price. The assignment also discusses the adjusted R-squared value, indicating the model's explanatory power, and tests the overall significance of the regression model using ANOVA. The null hypothesis, that all slope coefficients are zero, is tested against the alternative hypothesis, that at least one coefficient is non-zero, demonstrating the model's statistical significance.
Document Page
BUSINESS STATISTIC
G. The respective multiple regression analysis is given below.
H. The requisite hypothesis to be tested is highlighted below.
Null Hypothesis: βage = 0
Alternative Hypothesis: βage ≠ 0
Level of significance chosen = 5%
Testing using P value approach
From the regression output, it is apparent that the p value corresponding to the age slope
coefficient is zero. This implies that the p value is lower than level of significance and hence,
the null hypothesis would be rejected. Hence, it would be appropriate to conclude that the
slope coefficient of age is significantly different from zero.
Testing using critical value approach
From the regression output, it is apparent that the t statistic is -15.23. For the degree of
freedom as 1048 and the significance level as 5%, the critical value would be +/- 1.96. It is
evident that the computed value of t statistic does not lie within the critical value interval
ranging from -1.96 to +1.96. Hence, the null hypothesis would be rejected. Hence, it would
be appropriate to conclude that the slope coefficient of age is significantly different from
zero.
tabler-icon-diamond-filled.svg

Paraphrase This Document

Need a fresh take? Get an instant paraphrase of this document with our AI Paraphraser
Document Page
BUSINESS STATISTIC
Interpretation of coefficient
As the age of the vehicle increases by 1 year, the price of the used car would come down by $
735.02. Alternatively, if the age of the vehicle decreases by 1 year, the price of the used car
would increase by $ 735.02.
I. The interpretation of the remaining slope coefficients are outlined below.
Automatic – A car having automatic transmission would command a higher price by $
791.51 as compared to a car having manual transmission. This is on expected lines as
automatic transmission involves incremental capital expenditure.
Kilometre – If the distance travelled by the used car is increased by 1 km, then the price of
the used car would reduce by $ 0.09. This is on expected lines as higher distance implies
greater wear and tear.
Petrol – If the car is run on petrol and not diesel, then the price of the used car would
decrease by $ 1,492.76. This is on expected lines as diesel is cheaper in comparison to
petrol.
Damage – If the car has damage, then the price of used car would decrease by $ 2,166.19.
This is on expected lines since damaged cars would have lesser value.
PowerKW – If the power rating of the engine increases by 1 KW, then the price of the
used car would increase by $ 100.04. This is on expected lines since cars with higher
power rating of engine typically demand higher prices.
Hatchback – If the car is a hatchback, then the price of the used car tends to reduce by $
2,116.31. This is not on expected lines since hatchbacks typically demand a premium.
Sedan – If the car is a Sedan, then the price of the used car would reduce by $ 2,871.32.
This is rather unexpected as Sedan tends to be quite popular.
Convertible – If the car is convertible, then the price of the used car would increase by $
2,443.33. This is on expected lines since a higher price is demanded by a convertible
vehicle.
J. The value of adjusted R2 is 0.6932. It implies that 69.32 % of the price alteration are
explained by the various significant independent variables considered in the given regression
model. The difference between adjusted R2 and R2 is not very large. This is because barring
automatic and hatchback, the other variables are quite significant.
K. The requisite hypothesis is as stated below.
Null Hypothesis: All the slope coefficients can be assumed to be zero
Alternative Hypothesis: There exists at least one slope coefficient which cannot be assumed
to be zero.
Document Page
BUSINESS STATISTIC
The relevant ANOVA output for the significance testing of the regression model is indicated
below.
It is apparent that the p-value or significance F comes out to be 0.00.
Hence, assuming a 5% significance level, it is apparent that null hypothesis would be rejected
since p value is lesser than level of significance.
Thus, it would be appropriate to conclude that the model overall is significant at 5%
significance level as there exists atleast one slope coefficient which cannot be assumed as
zero.
chevron_up_icon
1 out of 3
circle_padding
hide_on_mobile
zoom_out_icon
[object Object]