Using and Managing Data and Information Analysis Assignment - BA3020QA

Verified

Added on  2022/12/19

|15
|658
|74
Homework Assignment
AI Summary
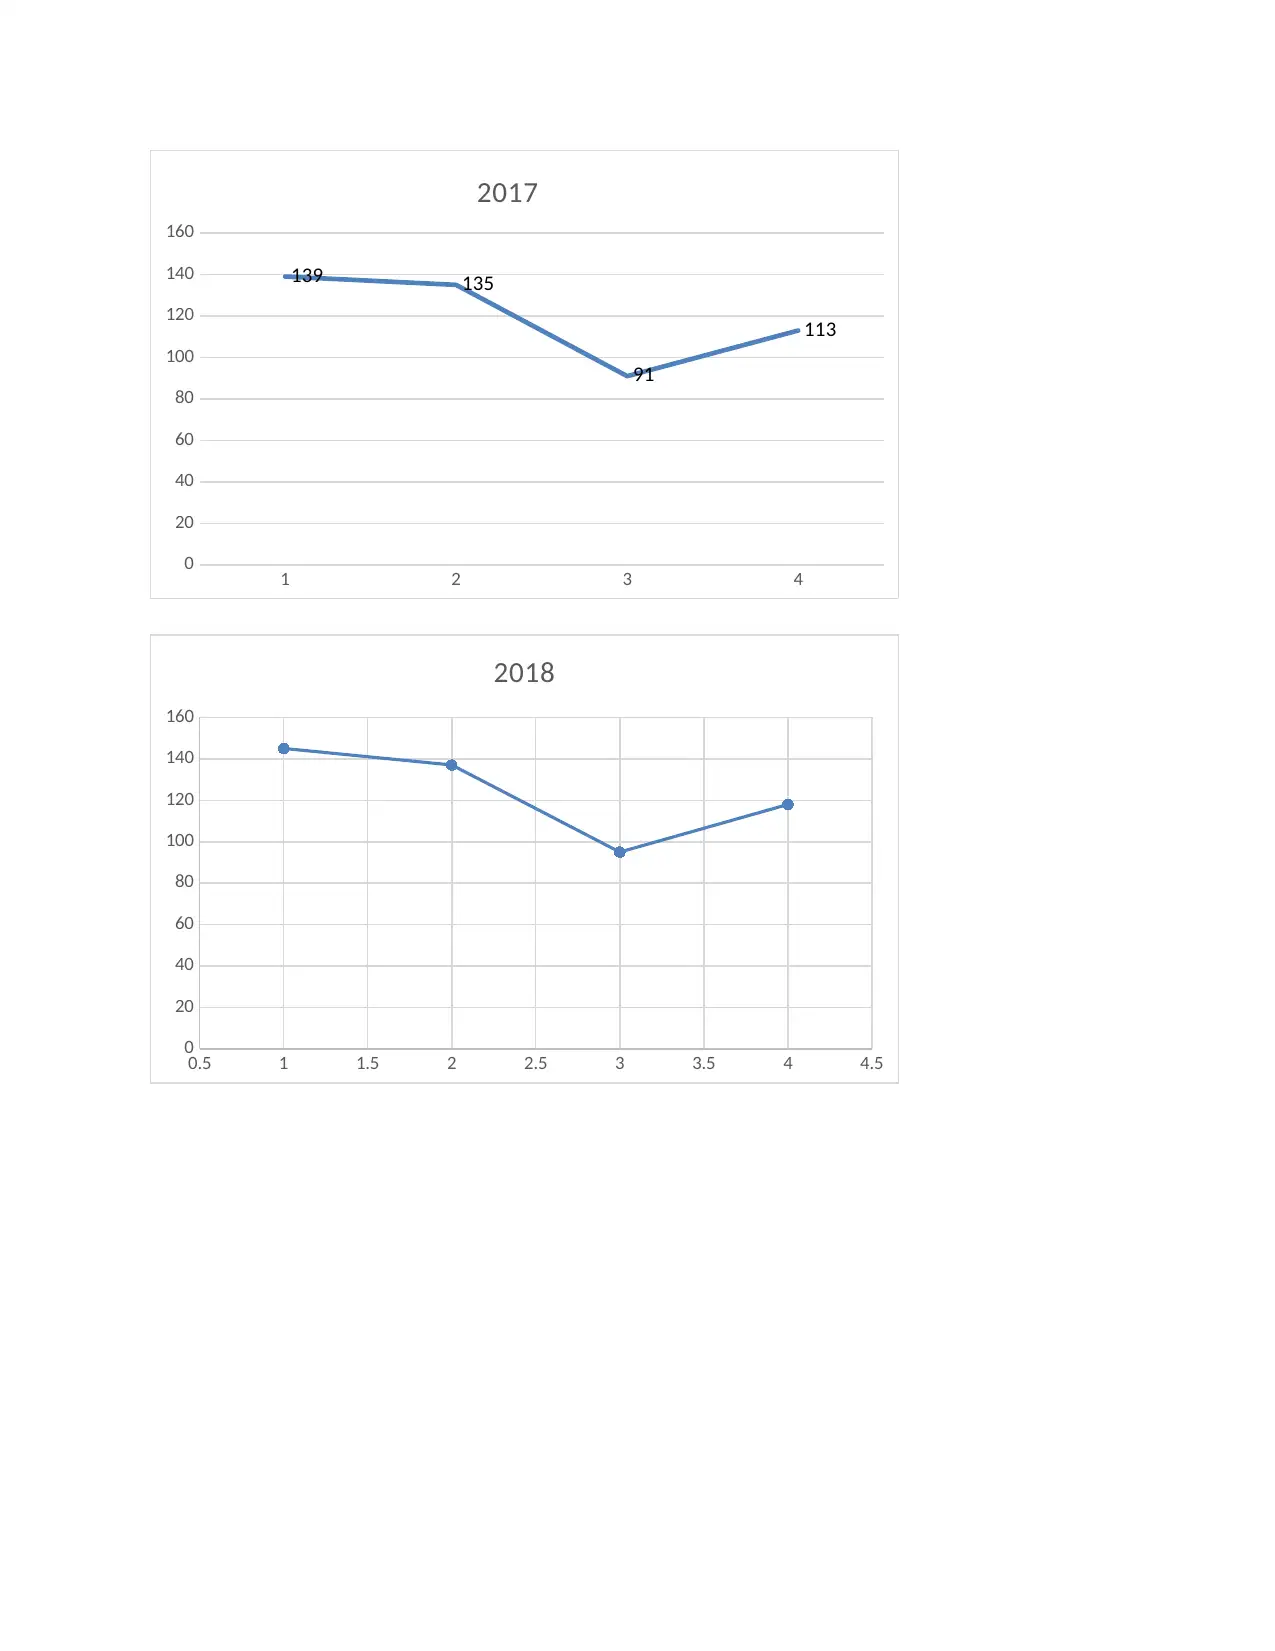
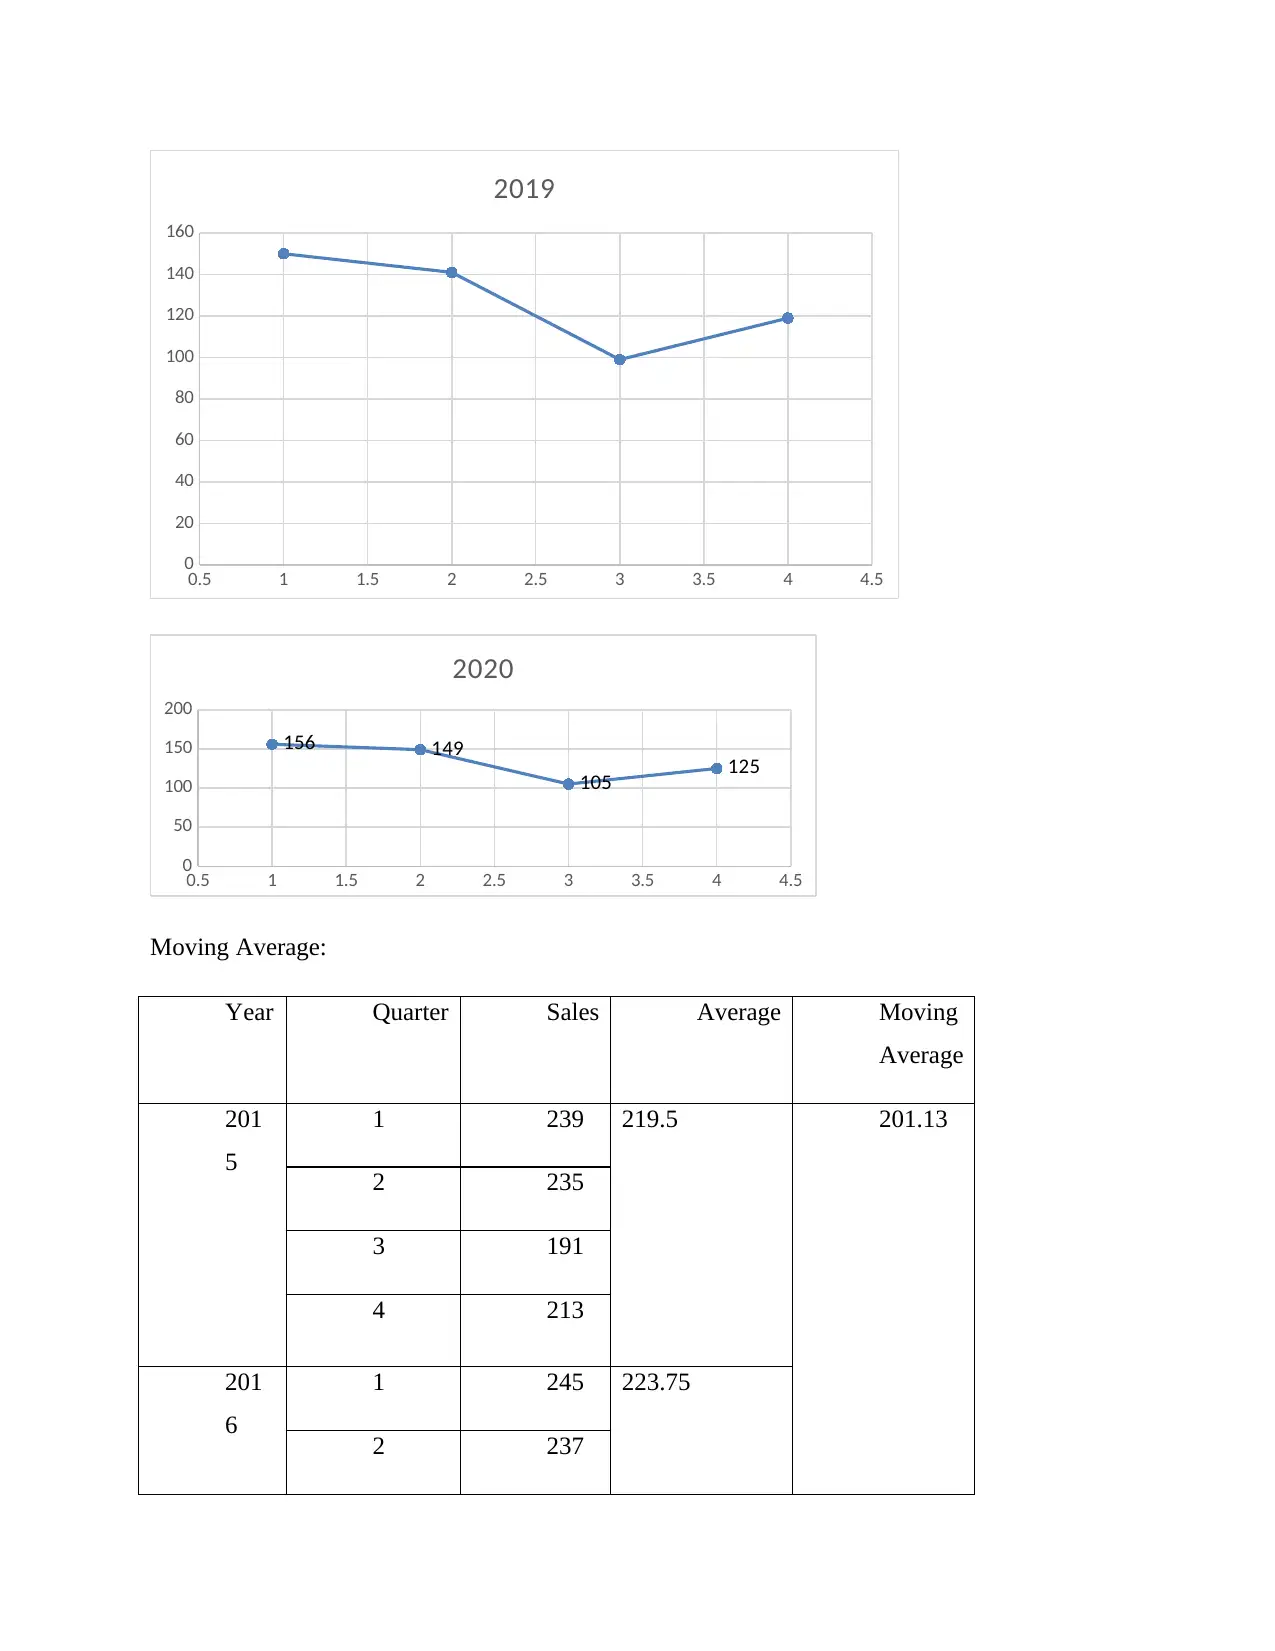
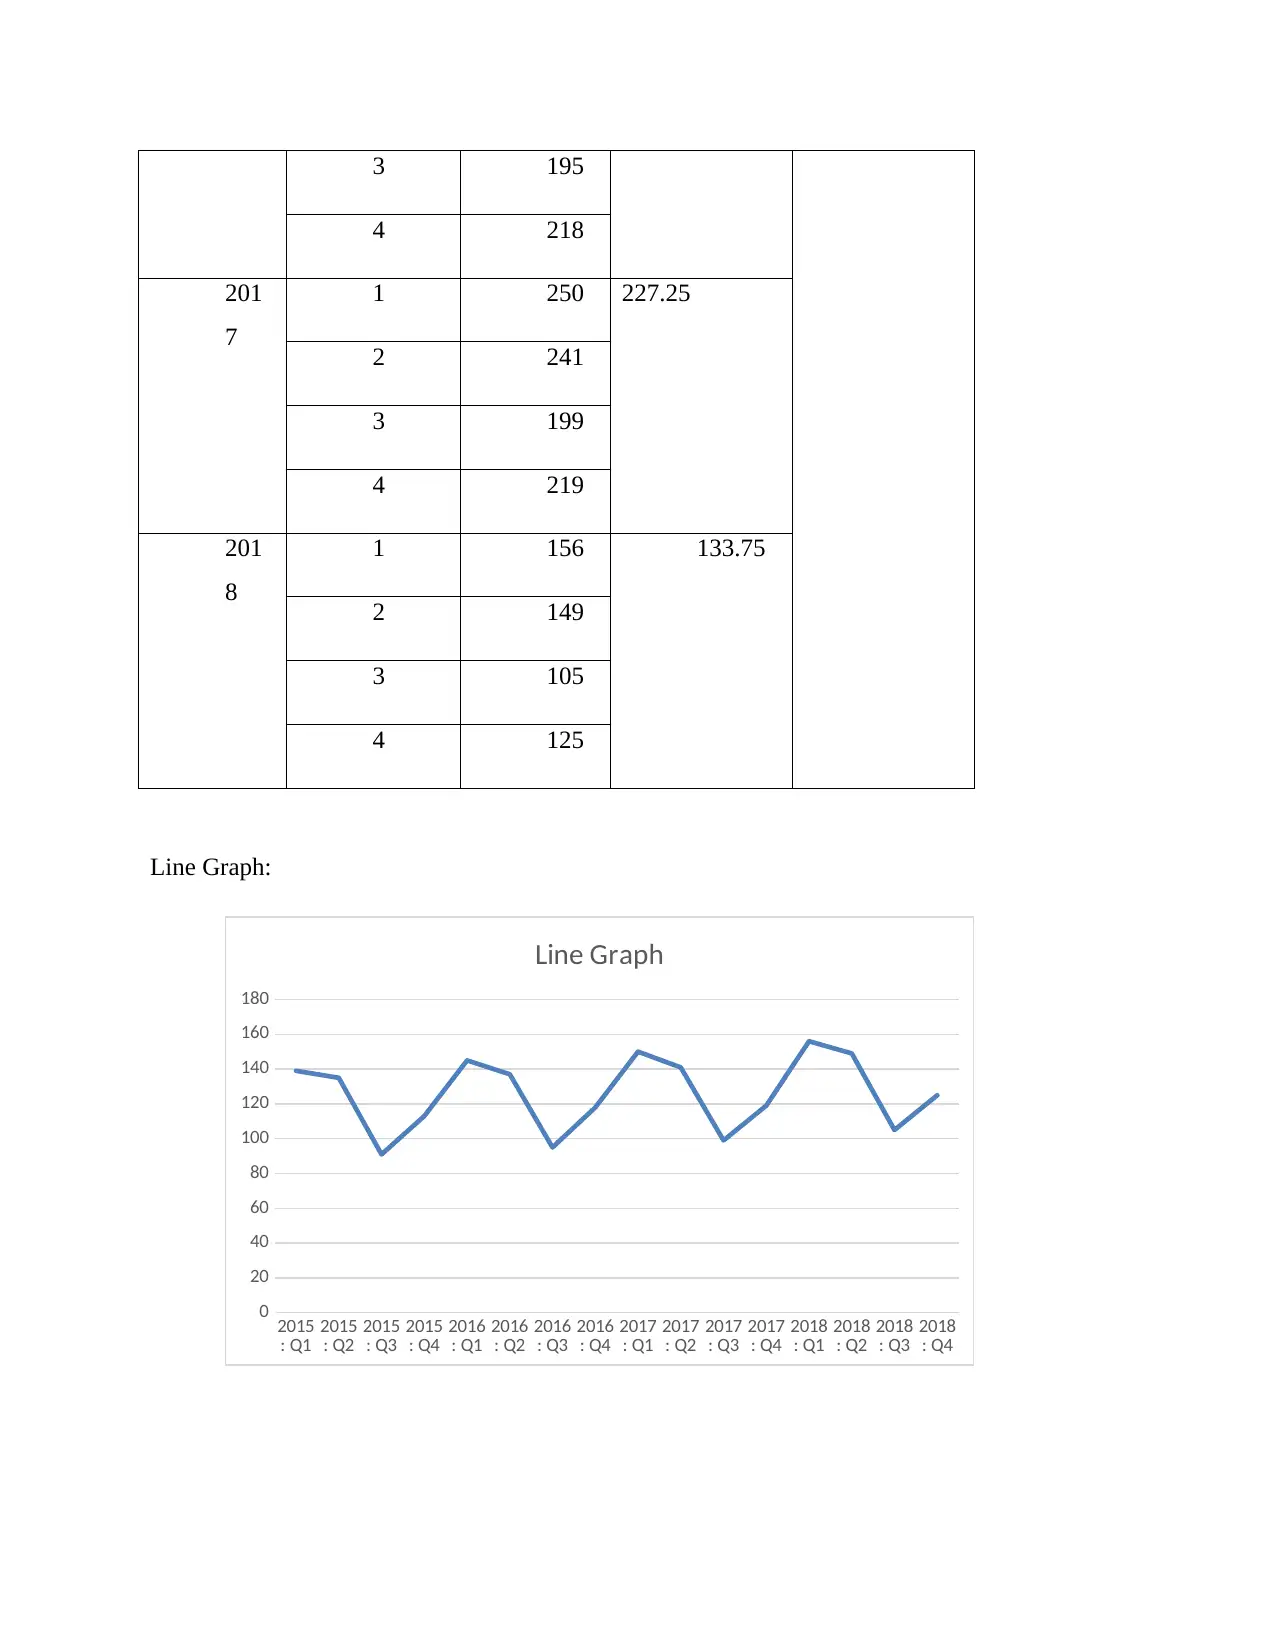
This assignment comprehensively addresses data and information management, encompassing various analytical techniques. Task 1 focuses on a supermarket survey, including data categorization, frequency tables, and graphical representations of customer demographics and self-checkout usage. Task 2 involves constructing and interpreting a network diagram to represent project timelines. Task 3 requires the creation of a line graph and calculation of a moving average to analyze sales figures over several years. Task 4 delves into decision-making using a decision tree to analyze potential outcomes. Finally, Task 5 utilizes linear programming to optimize cheese production based on resource constraints and profit maximization. The assignment demonstrates a strong understanding of data analysis, visualization, and decision-making methodologies.
Document Page
Using and Managing Data and Information
tabler-icon-diamond-filled.svg

Paraphrase This Document

Need a fresh take? Get an instant paraphrase of this document with our AI Paraphraser
Document Page
Contents
TASK 1.......................................................................................................................................................3
TASK 2.......................................................................................................................................................8
TASK 3.......................................................................................................................................................9
Task 4........................................................................................................................................................13
Task 5........................................................................................................................................................13
REFERENCES..........................................................................................................................................15
Document Page
TASK 1
1. Label the codes for categories:
ï‚· Gender:
1. Male? 2. Female? 3. Prefer not to say
ï‚· Age:
1. Less than 21 2. 21 to 34 3. 35 to 47 4. 48 to 60 5. 61 and over
ï‚· Education:
1. GCSE or below 2. A’ level or Diploma 3. Degree or further
ï‚· Are you a regular user of self-checkout user?
1. Yes 2. No
2. Frequency and percentage frequency tables:
Document Page
tabler-icon-diamond-filled.svg

Paraphrase This Document

Need a fresh take? Get an instant paraphrase of this document with our AI Paraphraser
Document Page
Document Page
3. Graphical representation:
Male
Female
Prefer not to
say Total
0%
20%
40%
60%
80%
100%
Gender
Percentage
Document Page
Less than
21 21 to 34 35 to 47 48 to 60 61 and over Total
0
10
20
30
40
50
60
70
80
90
100
Age
tabler-icon-diamond-filled.svg

Paraphrase This Document

Need a fresh take? Get an instant paraphrase of this document with our AI Paraphraser
Document Page
4. Spending
TASK 2
Network diagram- A network diagram is an illustration of a project that consists of a set of linked
arrow and frames that define the interdependence of the project tasks (Pearlson, Saunders, and
Galletta, 2019). Packages or arrows display activity descriptions, and arrows indicate the
association between the operations.
Document Page
2. Total time period:
3+2+3+2+1+2+2+1 = 16
3. Critical path method:
TASK 3
1. Draw a line graph to represent the sales figures.
Document Page
1 2 3 4
0
20
40
60
80
100
120
140
160
139 135
91
113
2017
0.5 1 1.5 2 2.5 3 3.5 4 4.5
0
20
40
60
80
100
120
140
160
2018
tabler-icon-diamond-filled.svg

Paraphrase This Document

Need a fresh take? Get an instant paraphrase of this document with our AI Paraphraser
Document Page
0.5 1 1.5 2 2.5 3 3.5 4 4.5
0
20
40
60
80
100
120
140
160
2019
0.5 1 1.5 2 2.5 3 3.5 4 4.5
0
50
100
150
200
156 149
105 125
2020
Moving Average:
Year Quarter Sales Average Moving
Average
201
5
1 239 219.5 201.13
2 235
3 191
4 213
201
6
1 245 223.75
2 237
Document Page
3 195
4 218
201
7
1 250 227.25
2 241
3 199
4 219
201
8
1 156 133.75
2 149
3 105
4 125
Line Graph:
2015
: Q1 2015
: Q2 2015
: Q3 2015
: Q4 2016
: Q1 2016
: Q2 2016
: Q3 2016
: Q4 2017
: Q1 2017
: Q2 2017
: Q3 2017
: Q4 2018
: Q1 2018
: Q2 2018
: Q3 2018
: Q4
0
20
40
60
80
100
120
140
160
180
Line Graph
chevron_up_icon
1 out of 15
circle_padding
hide_on_mobile
zoom_out_icon
[object Object]