KIT714 Semester 2: Car Parking Problems at UTAS Report Analysis
VerifiedAdded on 2023/06/04
|9
|3043
|408
Report
AI Summary
This report analyzes car parking issues at the University of Tasmania, utilizing data collected from traffic counters at four campus entrances over six months. The study aims to identify peak usage times and differences between in-semester and non-semester periods. The report includes descriptive statistics, t-tests, and ANOVA tests to compare car park usage across entrances and time periods. Key findings include the identification of statistically significant differences in car park usage during semester and non-semester times, with Earl Street showing the highest mean number of cars. The analysis also reveals variations in car park usage across different entrances. The report concludes by rejecting the null hypotheses and recommending potential solutions to alleviate parking problems based on the data analysis. This study demonstrates the application of quantitative research methods to address a real-world problem.
Report on the current car parking problems at the University of Tasmania
with a view to making recommendations to address these problems.
Abstract:
Using the analysis of cars through the different entrance of University of Tasmania to address and make
the recommendations to the problems of car parking.
The data which was used here were mainly from the installed devices at the main entrances to the car
parks around the main campus. The time and date each cars enters the university’s car parks for the last
six months have been recorded by these devices. The university has four car park entrances. Three of the
entrances are linked to the ring roads; Clark Road, Dobson Road and Grosvenor Crescent. The following
are the entrances to the university and their respective data labels are; Churchill Avenue to the South
Western side of the campus, Earl Street to the South Eastern side of the campus, Alexander Street to the
North western side of campus and Grace Street to the Northern side of campus and the sole entrance to
the car park.
The main goal of this study is establish ways which can used to solve the problem of car parking in the
campus compound, through studying the number of cars going through a given entrance and the time of
the semester, that is, during the in-semester and non-semester time. The study has indicated that there is
difference in mean number of cars during in-semester and non-semester times. The study also shows that
Earl Street to the South eastern side of the campus has the highest mean number of cars passing through.
Introduction
At the University of Tasmania, the type and number parking spaces is determined by the university
council. This they designate to different campus and sites in accordance to the university by-laws of 1993.
There is inadequate number of car parking spaces available on each of the campuses of the university or a
site. This has resulted to not a parking permit a guarantee of getting a parking space. The parking spaces
available in each time is therefore provided in the Campus Information website which gives the map
overview of the parking spaces locations available at the university campuses.
The parking areas at the campuses indicated by signs and colored dots marked on the roads. This can help
in identifying the parking type permitted. For example, blue color will indicate voucher parking, white
color indicate staff permit holders, green color indicating student resident permit holders as the red color
shows student parking. These colors and signs will be noted by the drivers as there are no directors, for
them to make proper parking or park accordingly. Drivers are required to be very vigilant as sometimes it
may be necessary to make some changes or close some areas in accordance to the by-laws of the
university.
Car parking is paid all year round with only public holidays and weekend exempted from that payments.
The current parking permit hold and displayed by staff make them to access voucher for parking spaces
and student parking spaces without paying any additional cost during the teaching breaks of summer
teachings and semester exclusive of periods of examination.
Besides all, there are some areas in the parking lot where parking restriction apply. These includes
Medical Science Precinct, Hobart
Domain, Brooker Avenue, Glebe
Conservatorium of Music (Tasmanian College of the Arts), Sandy Bay Road, Hobart
Tasmanian College of the Arts, Hunter Street, Hobart
Paraphrase This Document
Need a fresh take? Get an instant paraphrase of this document with our AI Paraphraser
1. Description and illustration of dataset
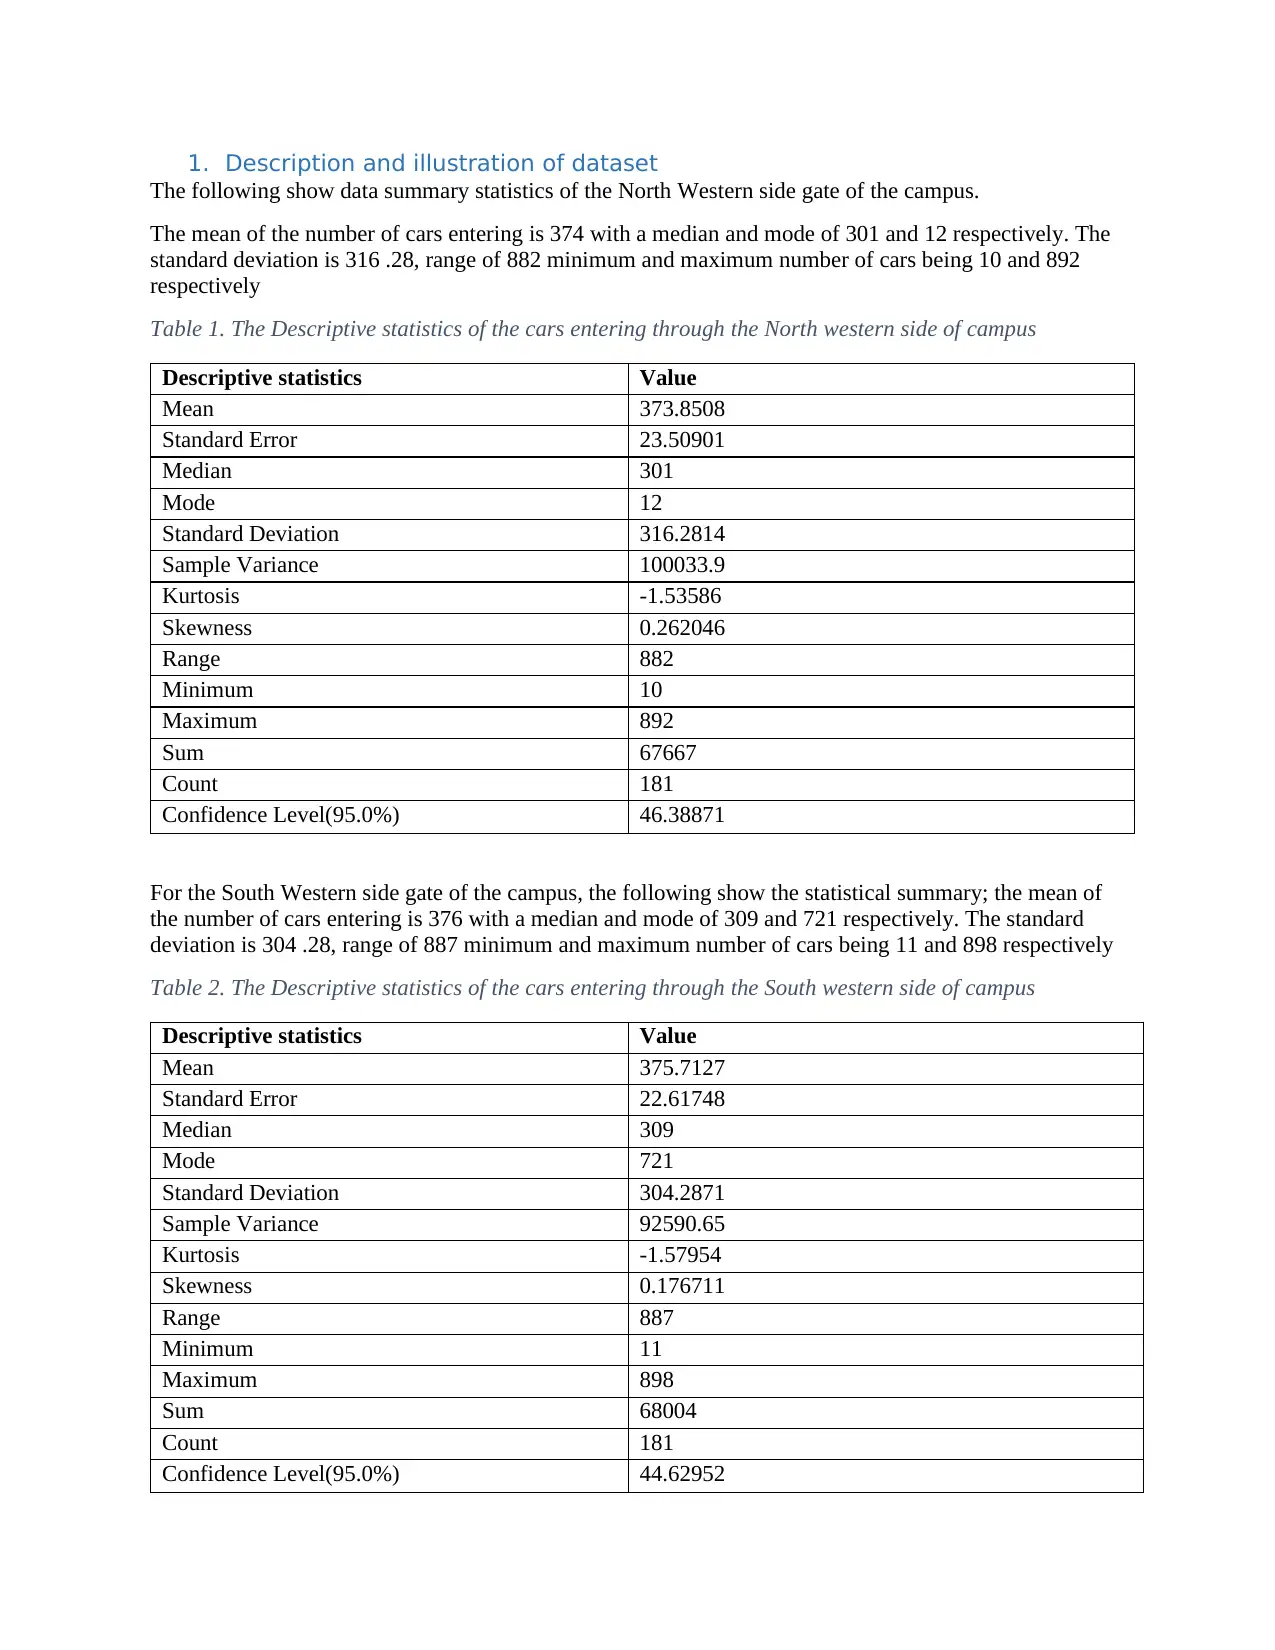
The following show data summary statistics of the North Western side gate of the campus.
The mean of the number of cars entering is 374 with a median and mode of 301 and 12 respectively. The
standard deviation is 316 .28, range of 882 minimum and maximum number of cars being 10 and 892
respectively
Table 1. The Descriptive statistics of the cars entering through the North western side of campus
Descriptive statistics Value
Mean 373.8508
Standard Error 23.50901
Median 301
Mode 12
Standard Deviation 316.2814
Sample Variance 100033.9
Kurtosis -1.53586
Skewness 0.262046
Range 882
Minimum 10
Maximum 892
Sum 67667
Count 181
Confidence Level(95.0%) 46.38871
For the South Western side gate of the campus, the following show the statistical summary; the mean of
the number of cars entering is 376 with a median and mode of 309 and 721 respectively. The standard
deviation is 304 .28, range of 887 minimum and maximum number of cars being 11 and 898 respectively
Table 2. The Descriptive statistics of the cars entering through the South western side of campus
Descriptive statistics Value
Mean 375.7127
Standard Error 22.61748
Median 309
Mode 721
Standard Deviation 304.2871
Sample Variance 92590.65
Kurtosis -1.57954
Skewness 0.176711
Range 887
Minimum 11
Maximum 898
Sum 68004
Count 181
Confidence Level(95.0%) 44.62952
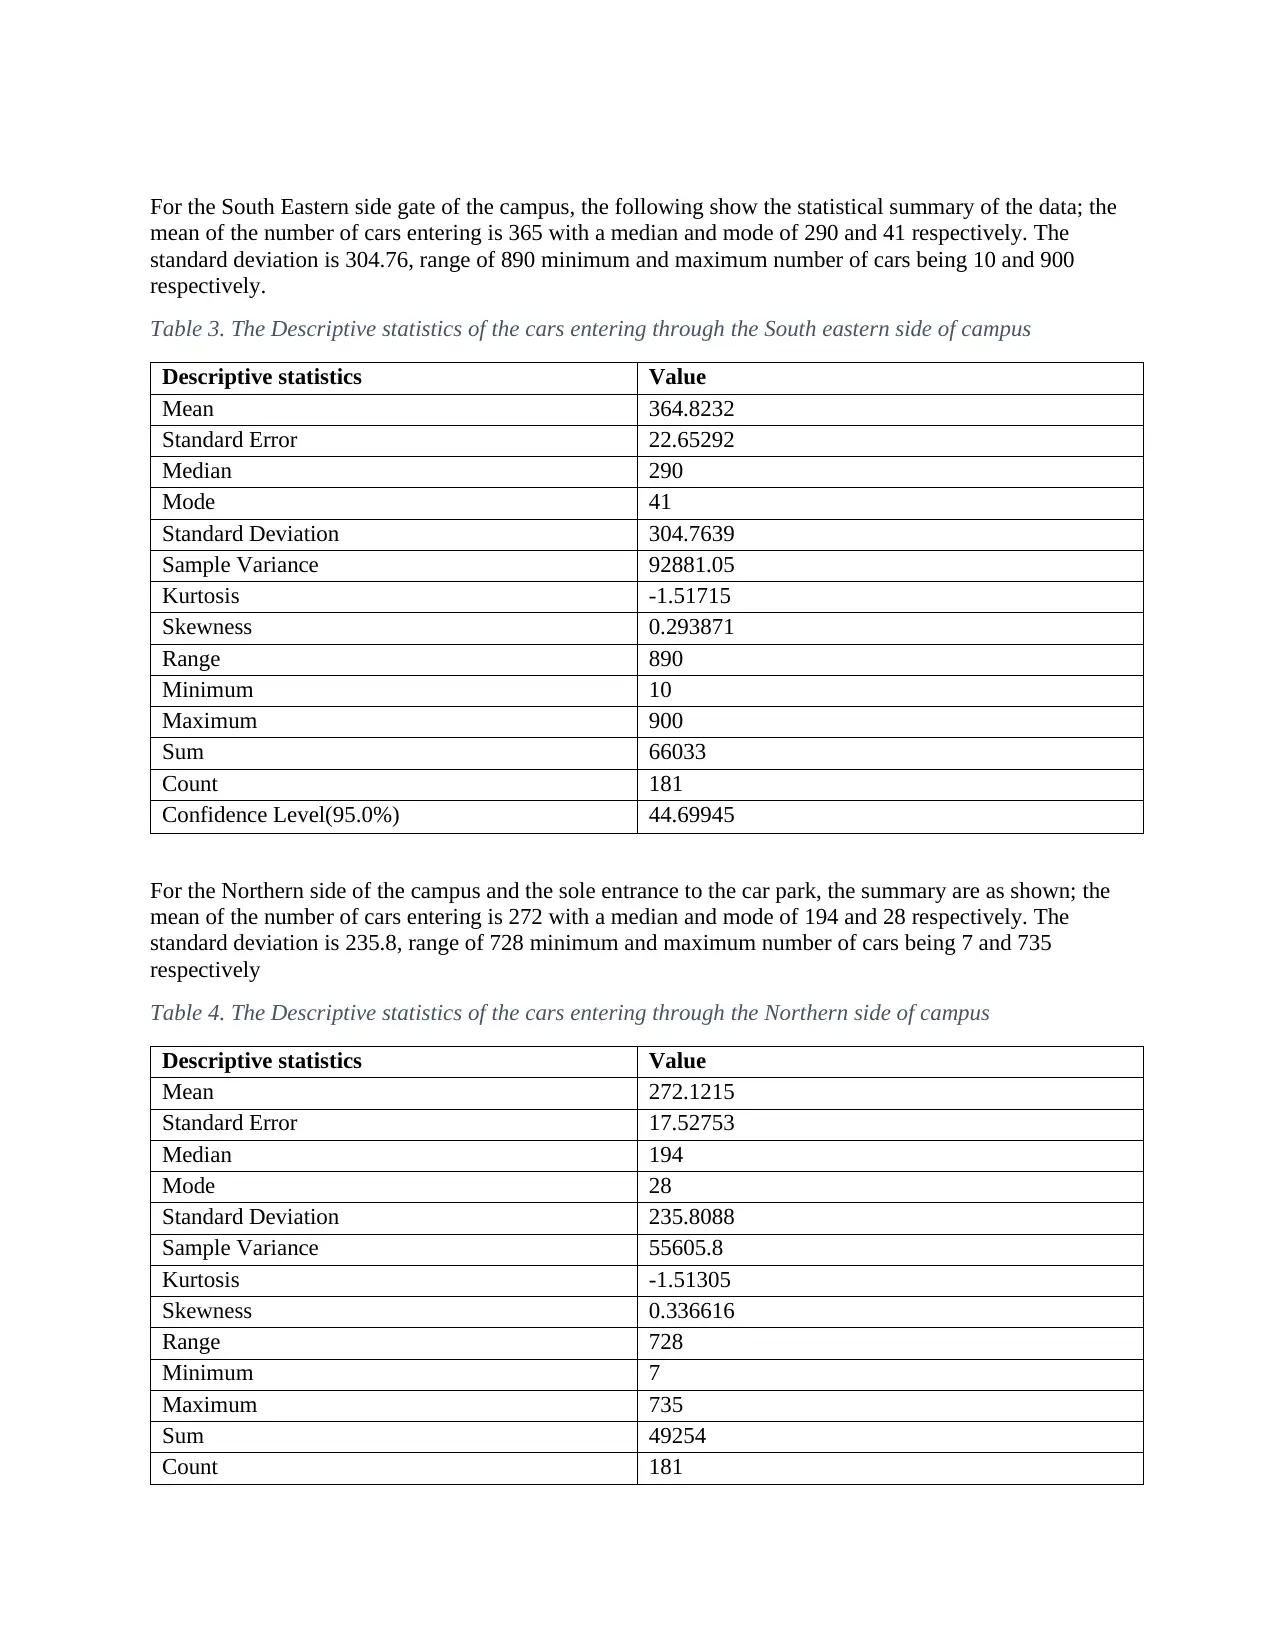
For the South Eastern side gate of the campus, the following show the statistical summary of the data; the
mean of the number of cars entering is 365 with a median and mode of 290 and 41 respectively. The
standard deviation is 304.76, range of 890 minimum and maximum number of cars being 10 and 900
respectively.
Table 3. The Descriptive statistics of the cars entering through the South eastern side of campus
Descriptive statistics Value
Mean 364.8232
Standard Error 22.65292
Median 290
Mode 41
Standard Deviation 304.7639
Sample Variance 92881.05
Kurtosis -1.51715
Skewness 0.293871
Range 890
Minimum 10
Maximum 900
Sum 66033
Count 181
Confidence Level(95.0%) 44.69945
For the Northern side of the campus and the sole entrance to the car park, the summary are as shown; the
mean of the number of cars entering is 272 with a median and mode of 194 and 28 respectively. The
standard deviation is 235.8, range of 728 minimum and maximum number of cars being 7 and 735
respectively
Table 4. The Descriptive statistics of the cars entering through the Northern side of campus
Descriptive statistics Value
Mean 272.1215
Standard Error 17.52753
Median 194
Mode 28
Standard Deviation 235.8088
Sample Variance 55605.8
Kurtosis -1.51305
Skewness 0.336616
Range 728
Minimum 7
Maximum 735
Sum 49254
Count 181
⊘ This is a preview!⊘
Do you want full access?
Subscribe today to unlock all pages.
Trusted by 1+ million students worldwide
Confidence Level(95.0%) 34.58586
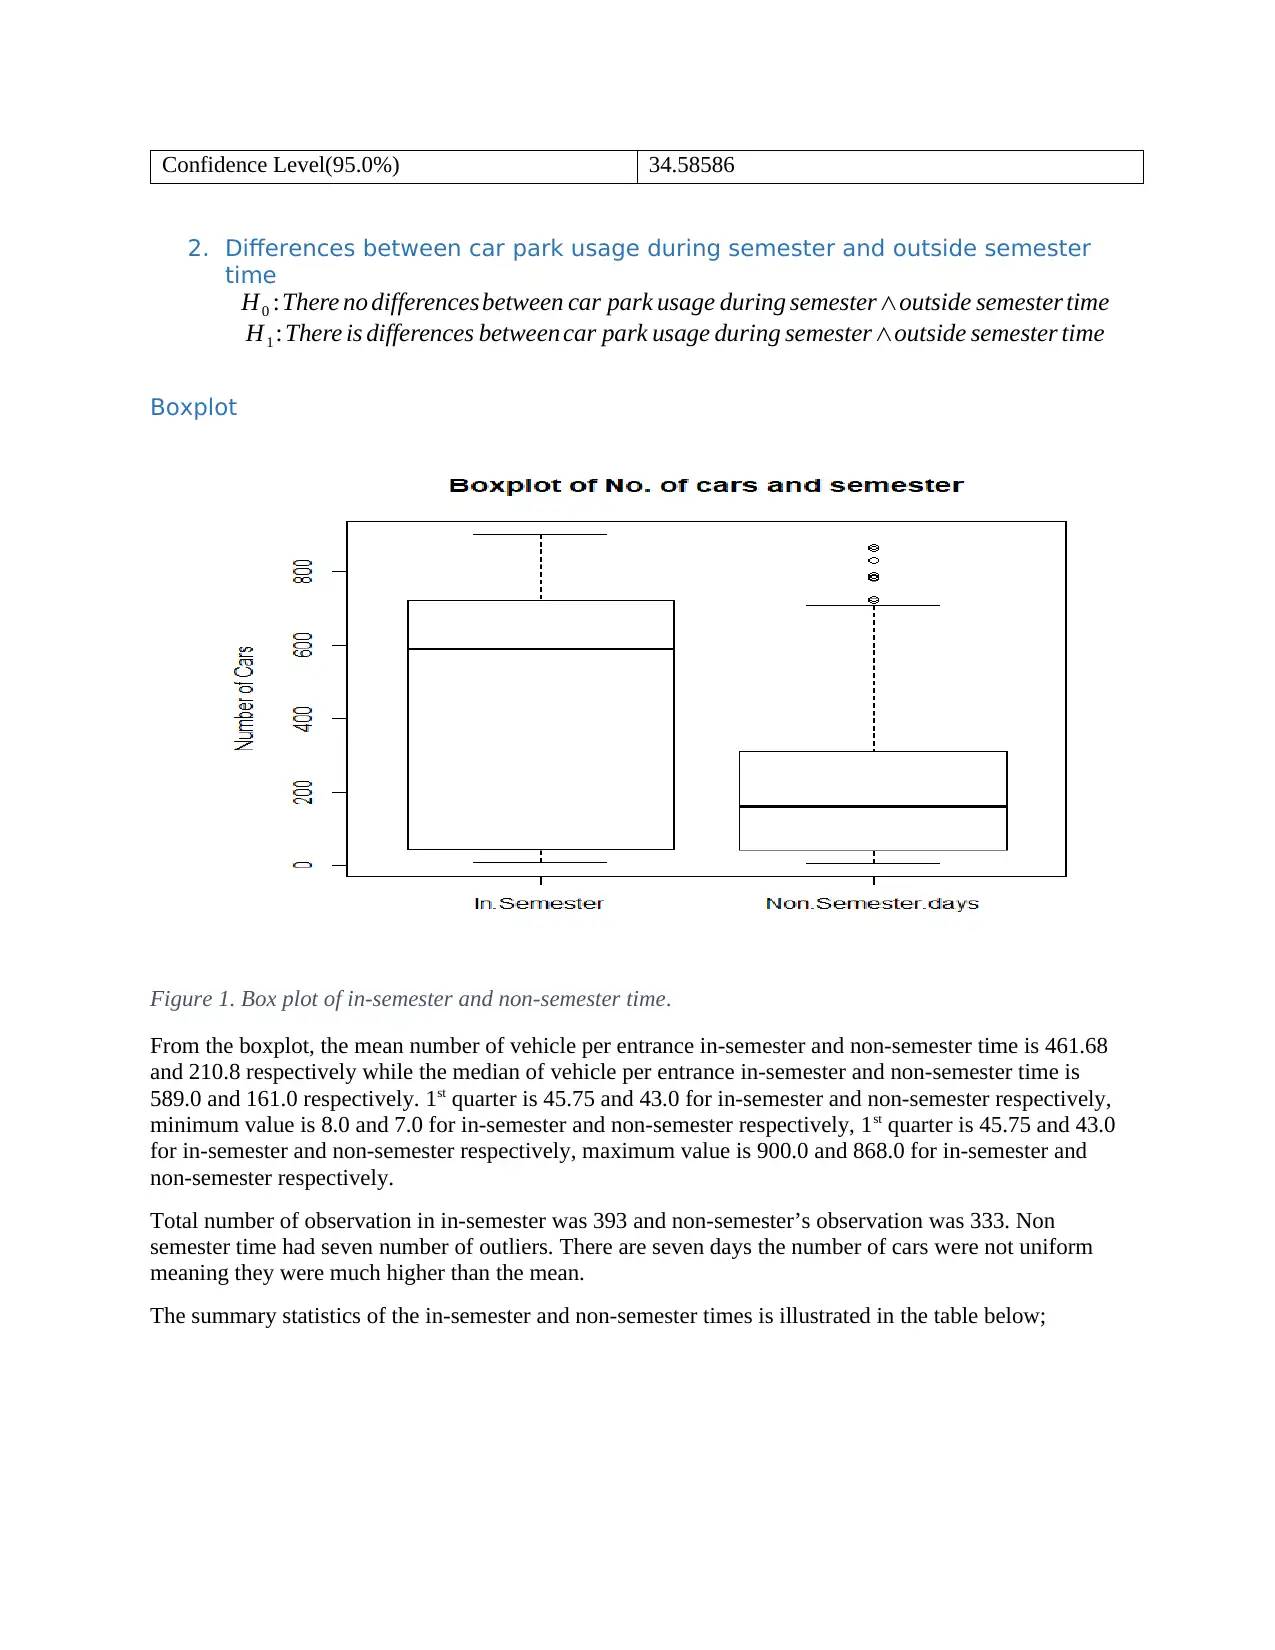
2. Differences between car park usage during semester and outside semester
time
H0 :There no differences between car park usage during semester∧outside semester time
H1 :There is differences between car park usage during semester∧outside semester time
Boxplot
Figure 1. Box plot of in-semester and non-semester time.
From the boxplot, the mean number of vehicle per entrance in-semester and non-semester time is 461.68
and 210.8 respectively while the median of vehicle per entrance in-semester and non-semester time is
589.0 and 161.0 respectively. 1st quarter is 45.75 and 43.0 for in-semester and non-semester respectively,
minimum value is 8.0 and 7.0 for in-semester and non-semester respectively, 1st quarter is 45.75 and 43.0
for in-semester and non-semester respectively, maximum value is 900.0 and 868.0 for in-semester and
non-semester respectively.
Total number of observation in in-semester was 393 and non-semester’s observation was 333. Non
semester time had seven number of outliers. There are seven days the number of cars were not uniform
meaning they were much higher than the mean.
The summary statistics of the in-semester and non-semester times is illustrated in the table below;
Paraphrase This Document
Need a fresh take? Get an instant paraphrase of this document with our AI Paraphraser
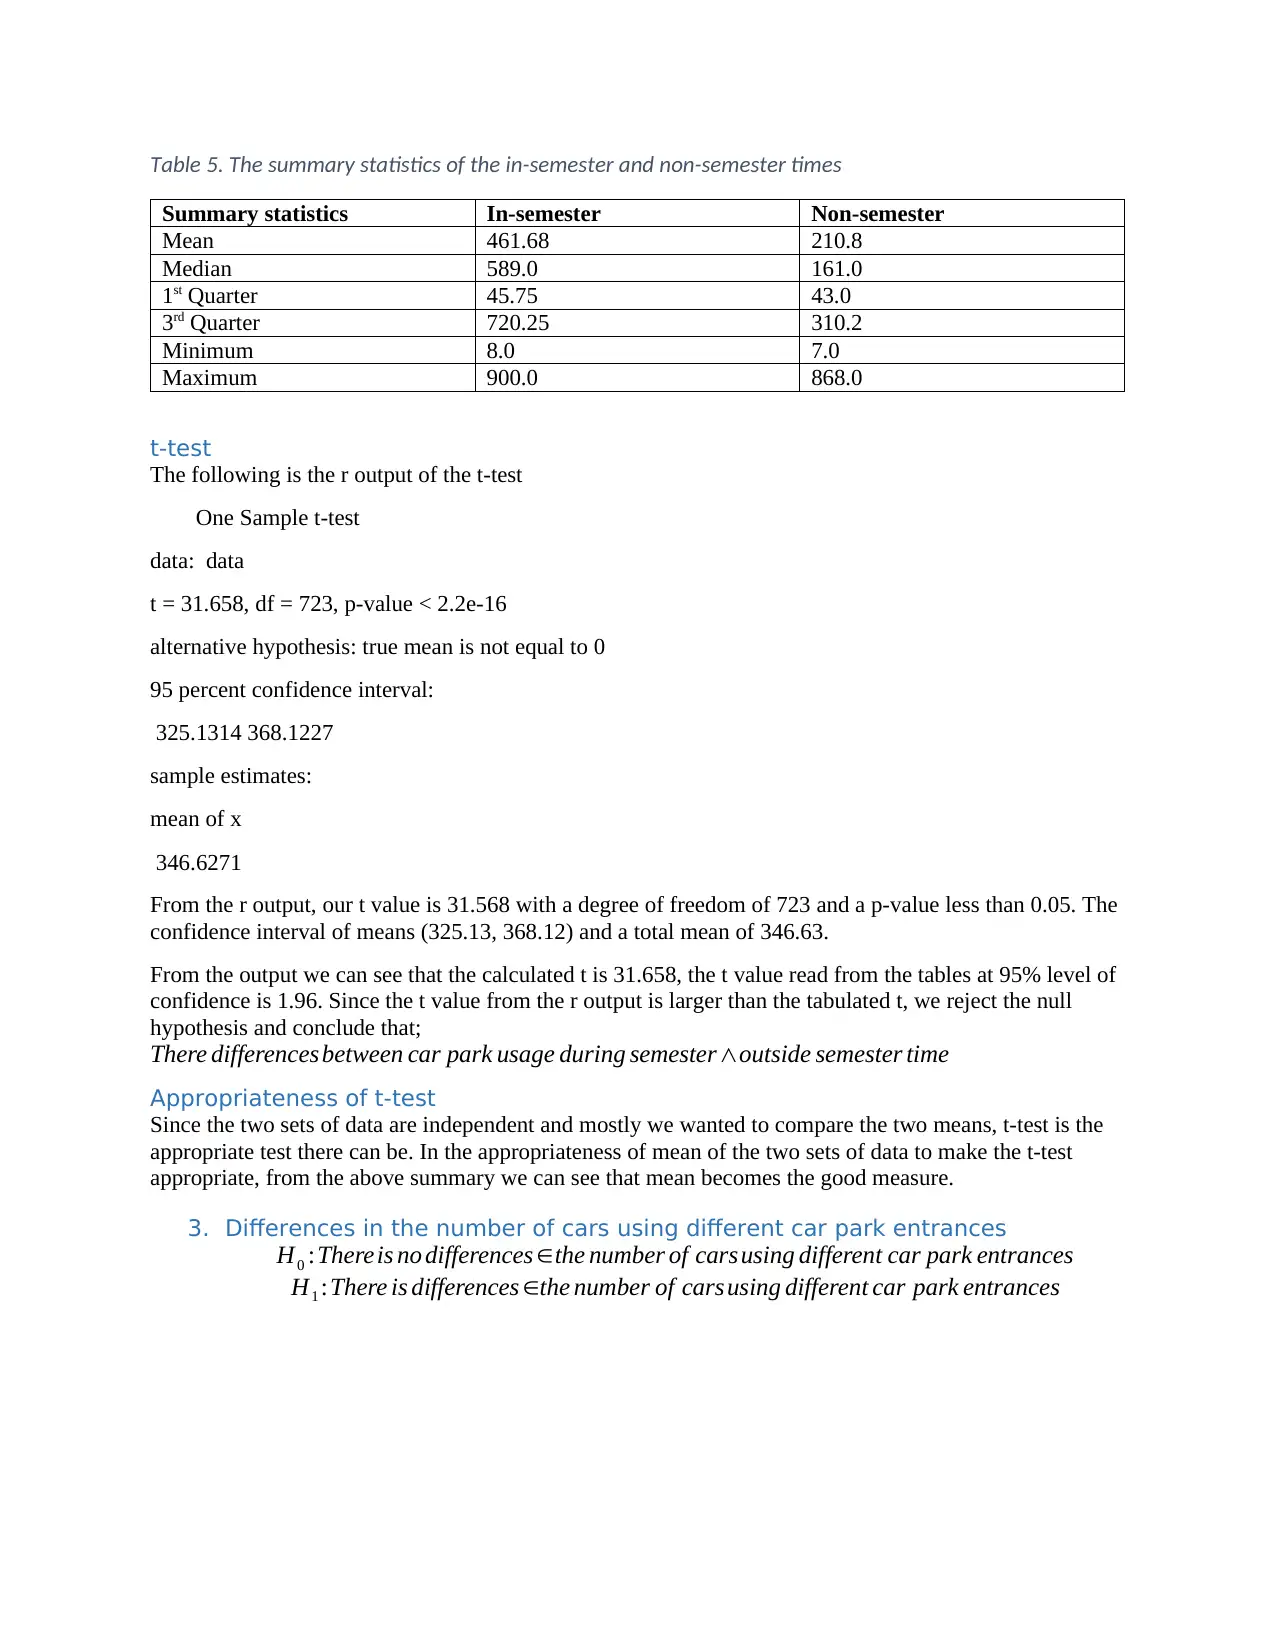
Table 5. The summary statistics of the in-semester and non-semester times
Summary statistics In-semester Non-semester
Mean 461.68 210.8
Median 589.0 161.0
1st Quarter 45.75 43.0
3rd Quarter 720.25 310.2
Minimum 8.0 7.0
Maximum 900.0 868.0
t-test
The following is the r output of the t-test
One Sample t-test
data: data
t = 31.658, df = 723, p-value < 2.2e-16
alternative hypothesis: true mean is not equal to 0
95 percent confidence interval:
325.1314 368.1227
sample estimates:
mean of x
346.6271
From the r output, our t value is 31.568 with a degree of freedom of 723 and a p-value less than 0.05. The
confidence interval of means (325.13, 368.12) and a total mean of 346.63.
From the output we can see that the calculated t is 31.658, the t value read from the tables at 95% level of
confidence is 1.96. Since the t value from the r output is larger than the tabulated t, we reject the null
hypothesis and conclude that;
There differences between car park usage during semester∧outside semester time
Appropriateness of t-test
Since the two sets of data are independent and mostly we wanted to compare the two means, t-test is the
appropriate test there can be. In the appropriateness of mean of the two sets of data to make the t-test
appropriate, from the above summary we can see that mean becomes the good measure.
3. Differences in the number of cars using different car park entrances
H0 :Thereis no differences ∈the number of cars using different car park entrances
H1 :There is differences ∈the number of carsusing different car park entrances
Boxplot
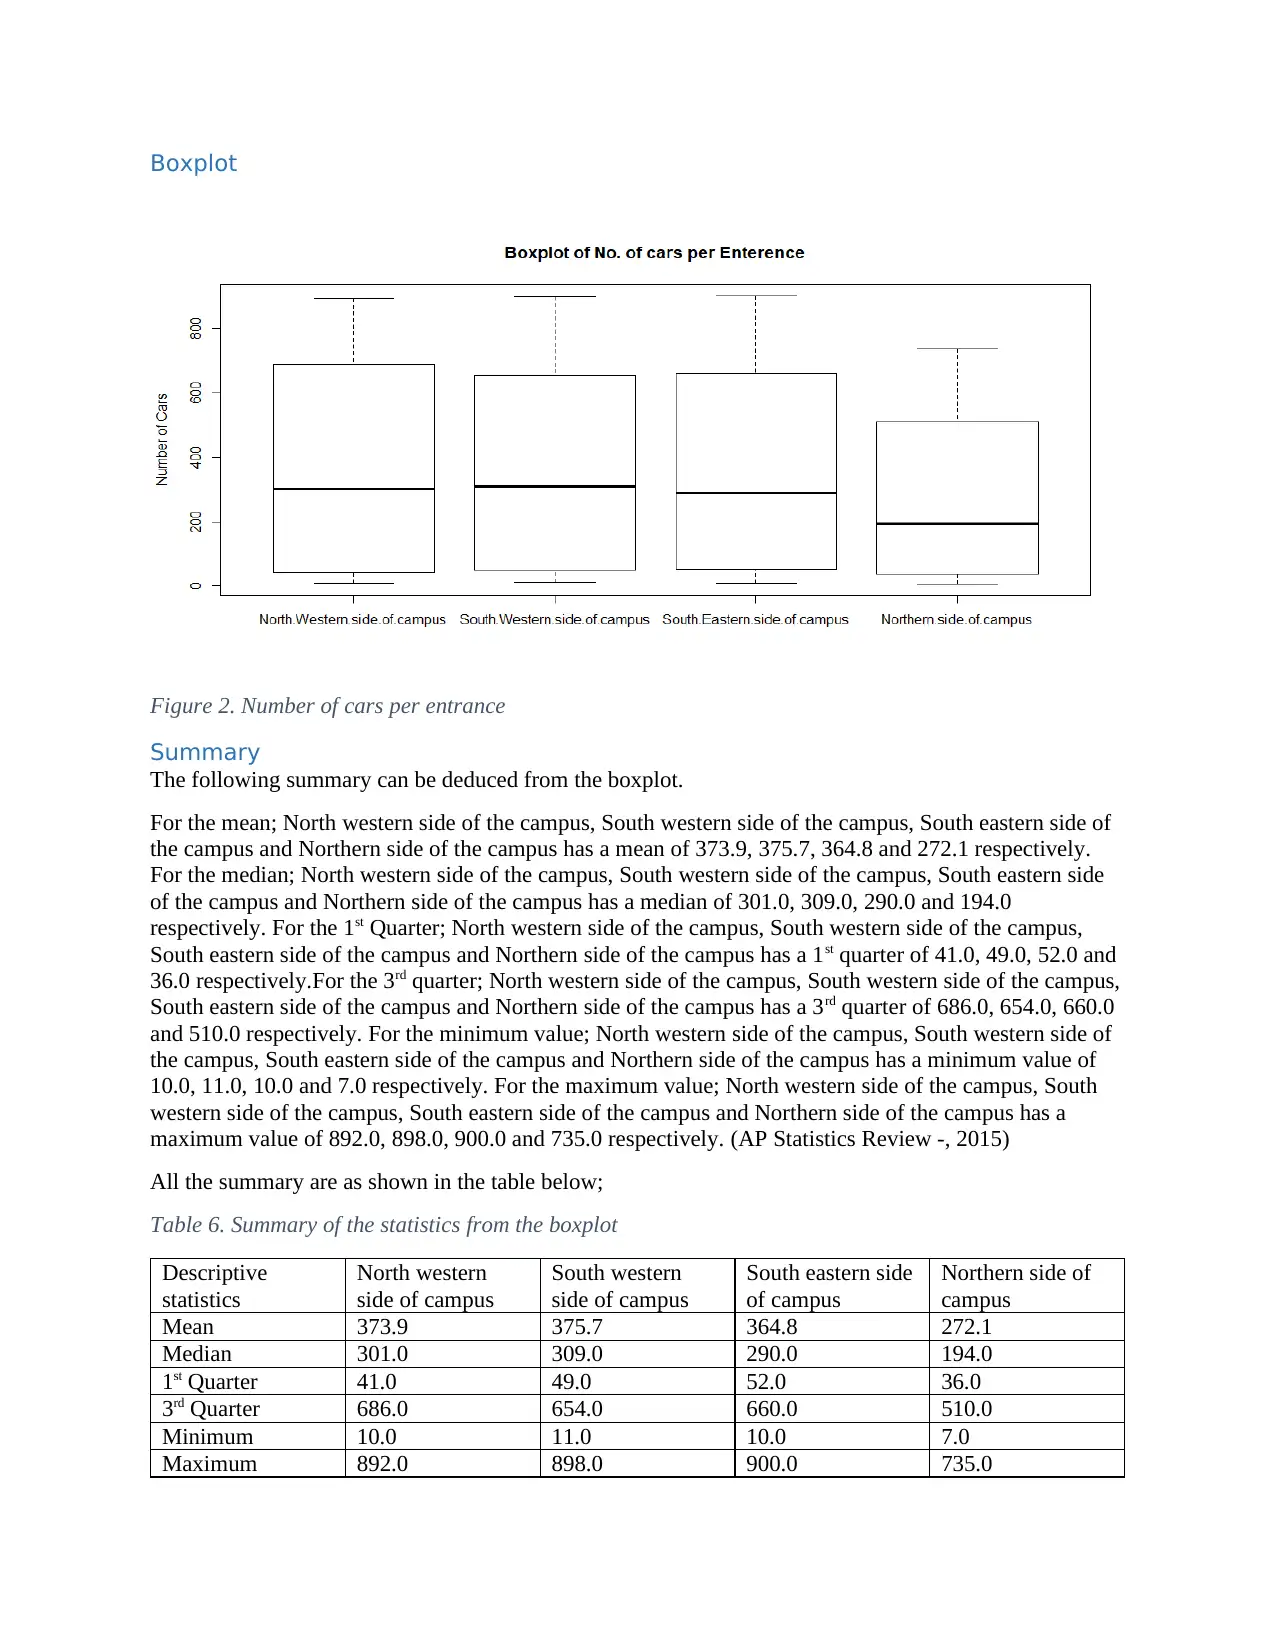
Figure 2. Number of cars per entrance
Summary
The following summary can be deduced from the boxplot.
For the mean; North western side of the campus, South western side of the campus, South eastern side of
the campus and Northern side of the campus has a mean of 373.9, 375.7, 364.8 and 272.1 respectively.
For the median; North western side of the campus, South western side of the campus, South eastern side
of the campus and Northern side of the campus has a median of 301.0, 309.0, 290.0 and 194.0
respectively. For the 1st Quarter; North western side of the campus, South western side of the campus,
South eastern side of the campus and Northern side of the campus has a 1st quarter of 41.0, 49.0, 52.0 and
36.0 respectively.For the 3rd quarter; North western side of the campus, South western side of the campus,
South eastern side of the campus and Northern side of the campus has a 3rd quarter of 686.0, 654.0, 660.0
and 510.0 respectively. For the minimum value; North western side of the campus, South western side of
the campus, South eastern side of the campus and Northern side of the campus has a minimum value of
10.0, 11.0, 10.0 and 7.0 respectively. For the maximum value; North western side of the campus, South
western side of the campus, South eastern side of the campus and Northern side of the campus has a
maximum value of 892.0, 898.0, 900.0 and 735.0 respectively. (AP Statistics Review -, 2015)
All the summary are as shown in the table below;
Table 6. Summary of the statistics from the boxplot
Descriptive
statistics
North western
side of campus
South western
side of campus
South eastern side
of campus
Northern side of
campus
Mean 373.9 375.7 364.8 272.1
Median 301.0 309.0 290.0 194.0
1st Quarter 41.0 49.0 52.0 36.0
3rd Quarter 686.0 654.0 660.0 510.0
Minimum 10.0 11.0 10.0 7.0
Maximum 892.0 898.0 900.0 735.0
⊘ This is a preview!⊘
Do you want full access?
Subscribe today to unlock all pages.
Trusted by 1+ million students worldwide
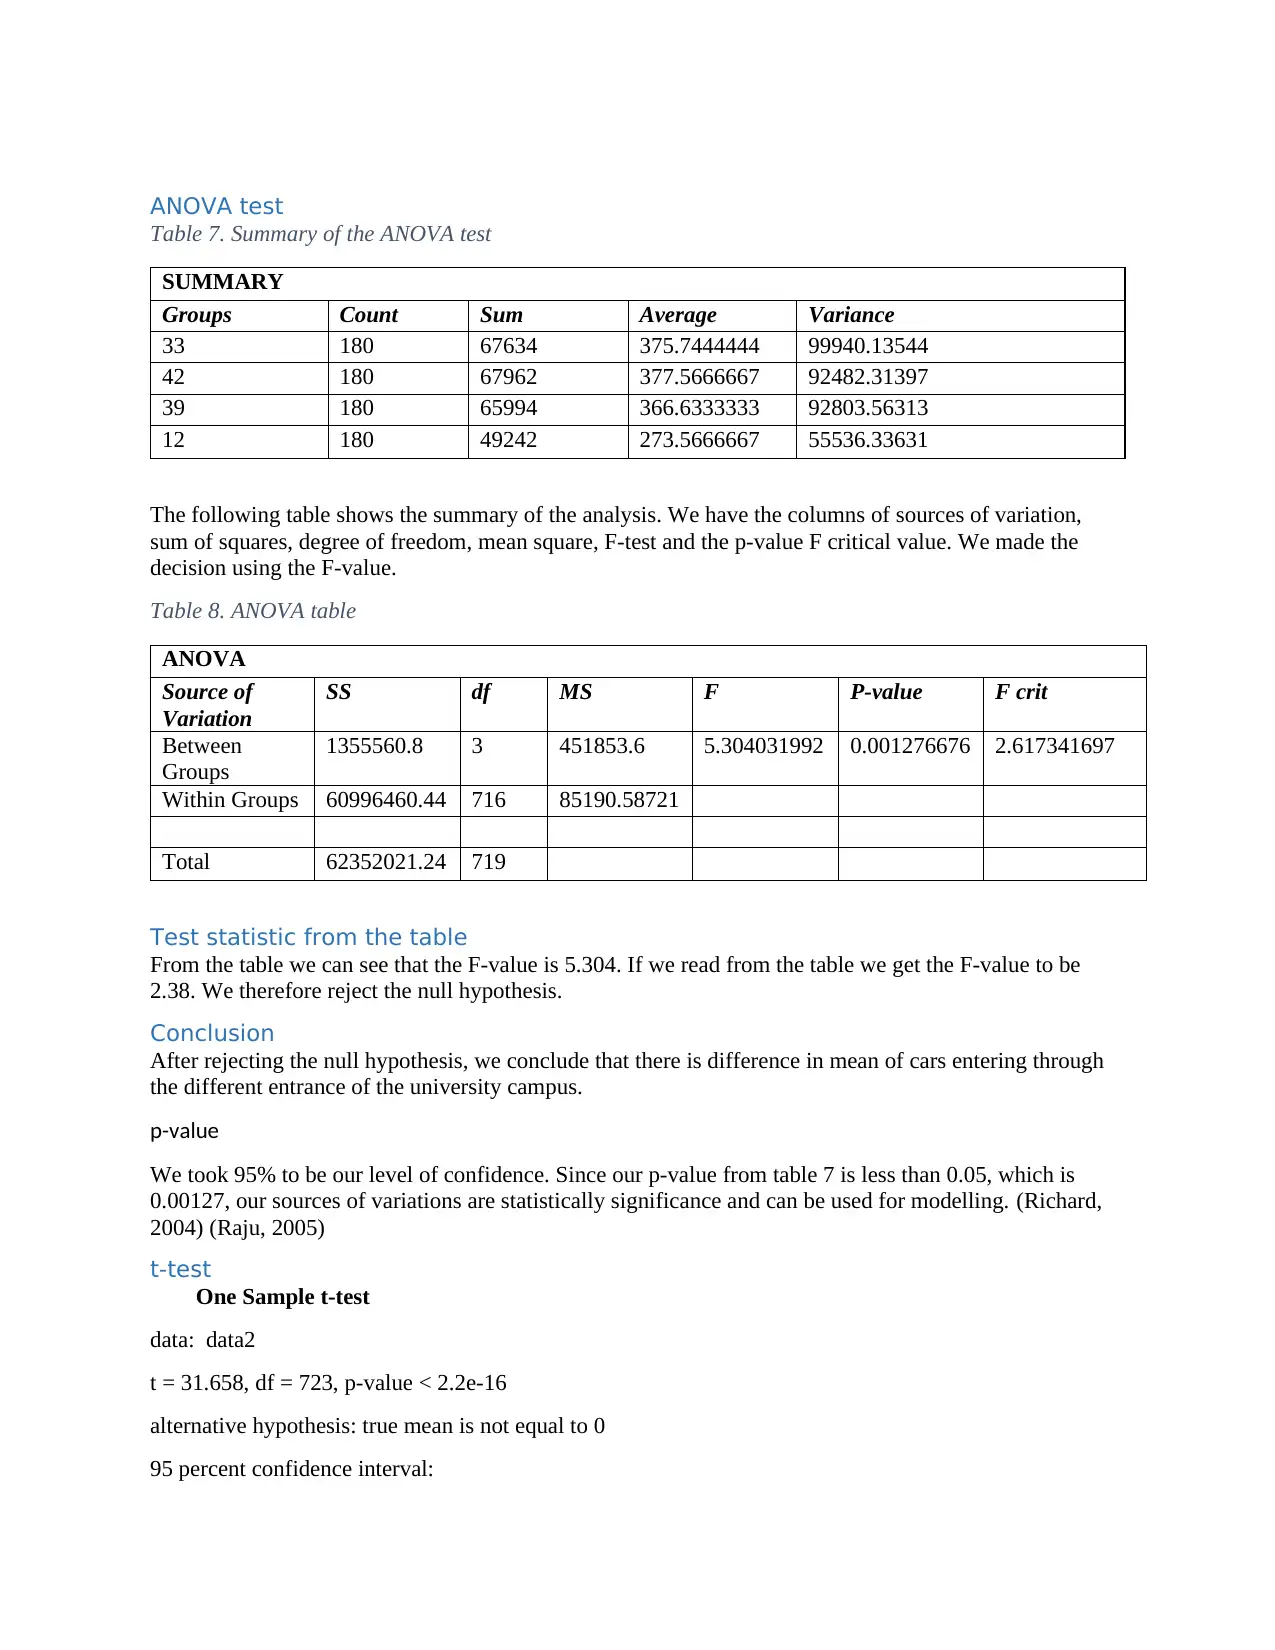
ANOVA test
Table 7. Summary of the ANOVA test
SUMMARY
Groups Count Sum Average Variance
33 180 67634 375.7444444 99940.13544
42 180 67962 377.5666667 92482.31397
39 180 65994 366.6333333 92803.56313
12 180 49242 273.5666667 55536.33631
The following table shows the summary of the analysis. We have the columns of sources of variation,
sum of squares, degree of freedom, mean square, F-test and the p-value F critical value. We made the
decision using the F-value.
Table 8. ANOVA table
ANOVA
Source of
Variation
SS df MS F P-value F crit
Between
Groups
1355560.8 3 451853.6 5.304031992 0.001276676 2.617341697
Within Groups 60996460.44 716 85190.58721
Total 62352021.24 719
Test statistic from the table
From the table we can see that the F-value is 5.304. If we read from the table we get the F-value to be
2.38. We therefore reject the null hypothesis.
Conclusion
After rejecting the null hypothesis, we conclude that there is difference in mean of cars entering through
the different entrance of the university campus.
p-value
We took 95% to be our level of confidence. Since our p-value from table 7 is less than 0.05, which is
0.00127, our sources of variations are statistically significance and can be used for modelling. (Richard,
2004) (Raju, 2005)
t-test
One Sample t-test
data: data2
t = 31.658, df = 723, p-value < 2.2e-16
alternative hypothesis: true mean is not equal to 0
95 percent confidence interval:
Paraphrase This Document
Need a fresh take? Get an instant paraphrase of this document with our AI Paraphraser
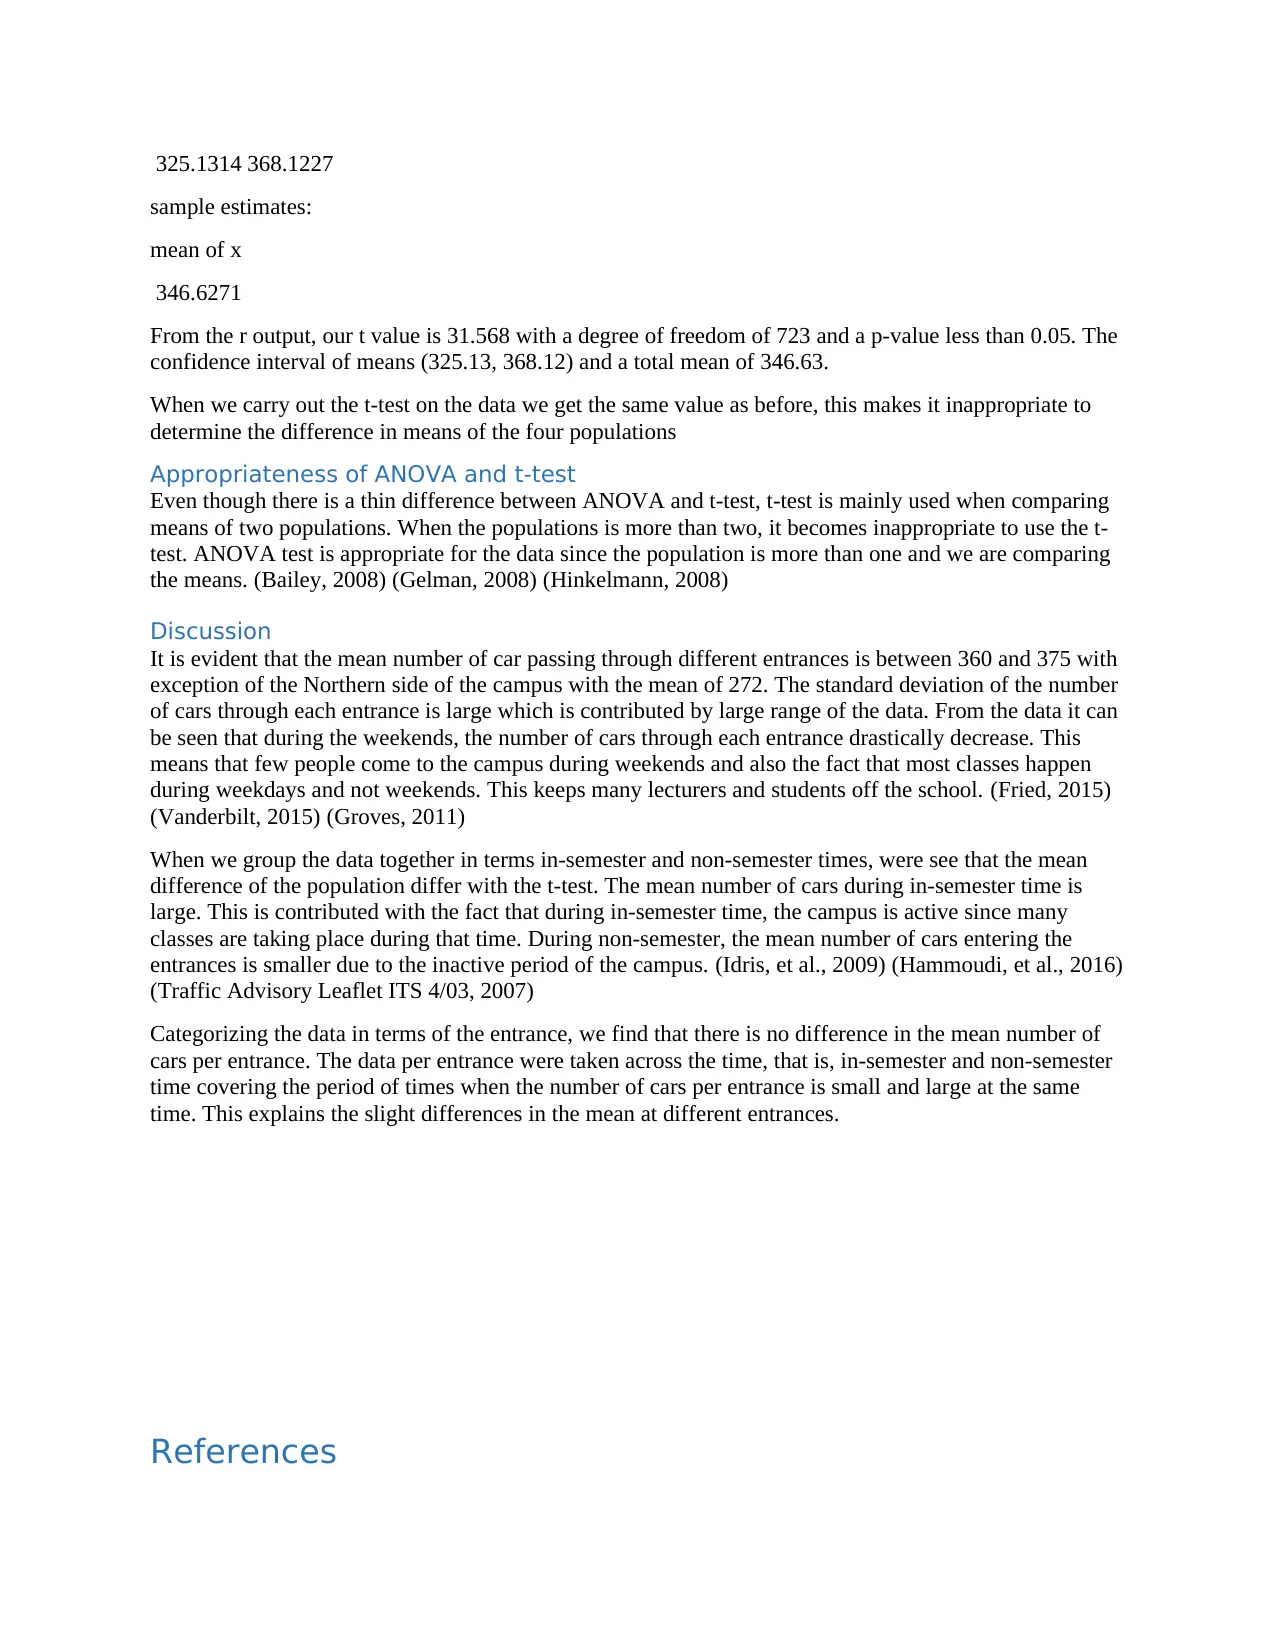
325.1314 368.1227
sample estimates:
mean of x
346.6271
From the r output, our t value is 31.568 with a degree of freedom of 723 and a p-value less than 0.05. The
confidence interval of means (325.13, 368.12) and a total mean of 346.63.
When we carry out the t-test on the data we get the same value as before, this makes it inappropriate to
determine the difference in means of the four populations
Appropriateness of ANOVA and t-test
Even though there is a thin difference between ANOVA and t-test, t-test is mainly used when comparing
means of two populations. When the populations is more than two, it becomes inappropriate to use the t-
test. ANOVA test is appropriate for the data since the population is more than one and we are comparing
the means. (Bailey, 2008) (Gelman, 2008) (Hinkelmann, 2008)
Discussion
It is evident that the mean number of car passing through different entrances is between 360 and 375 with
exception of the Northern side of the campus with the mean of 272. The standard deviation of the number
of cars through each entrance is large which is contributed by large range of the data. From the data it can
be seen that during the weekends, the number of cars through each entrance drastically decrease. This
means that few people come to the campus during weekends and also the fact that most classes happen
during weekdays and not weekends. This keeps many lecturers and students off the school. (Fried, 2015)
(Vanderbilt, 2015) (Groves, 2011)
When we group the data together in terms in-semester and non-semester times, were see that the mean
difference of the population differ with the t-test. The mean number of cars during in-semester time is
large. This is contributed with the fact that during in-semester time, the campus is active since many
classes are taking place during that time. During non-semester, the mean number of cars entering the
entrances is smaller due to the inactive period of the campus. (Idris, et al., 2009) (Hammoudi, et al., 2016)
(Traffic Advisory Leaflet ITS 4/03, 2007)
Categorizing the data in terms of the entrance, we find that there is no difference in the mean number of
cars per entrance. The data per entrance were taken across the time, that is, in-semester and non-semester
time covering the period of times when the number of cars per entrance is small and large at the same
time. This explains the slight differences in the mean at different entrances.
References
Anon., 2018. "Parking standards for new developments". www.wycombe.gov.uk. Archived from the
original on 16 January 2018. Retrieved 8 May 2018..
AP Statistics Review -, 2015. AP Statistics Review - Density Curves and the Normal Distributions".
Retrieved 16 March 2015. Density Curves and the Normal Distributions.
Bailey, R. A., 2008. Design of Comparative Experiments..
Fried, B., 2015. "How to Fix Off-Street Parking Policy, Before It's Too Late". StreetsBlog NYC. Archived
from the original on 2 April 2015. Retrieved 27 March 2015..
Gelman, A., 2008. "Variance, analysis of". The new Palgrave dictionary of economics. The new Palgrave
dictionary of economic.
Groves, M., 2011. "Servant or snoop in the parking garage?". Los Angeles Times. Archived from the
original on August 31, 2014. Retrieved August 29, 2014.
Hammoudi, K. et al., 2016. "Developing a Vision-based Adaptive Parking Space Management System"..
International Journal of Sensors, Wireless Communications and Control., p. 12.
Hinkelmann, K. &. K. O., 2008. Design and Analysis of Experiments..
Idris, M. et al., 2009. "Car Park System and its technology; A Review of Smart Parking System and its
Technology". Information Technology Journal, p. 8.
Raju, T. N., 2005. "William Sealy Gosset and William A. Silverman: Two "students" of science"..
Pediatrics, p. 3.
Richard, M., 2004. The Story of Mathematics (Paperback ed.). Princeton, NJ:. Princeton University Press.
Traffic Advisory Leaflet ITS 4/03, 2007. ". Parking Guidance and Information.
Vanderbilt, T., 2015. "There's No Such Thing as Free Parking". Archived from the original on 3 February
2012.
⊘ This is a preview!⊘
Do you want full access?
Subscribe today to unlock all pages.
Trusted by 1+ million students worldwide
1 out of 9


Your All-in-One AI-Powered Toolkit for Academic Success.
+13062052269
info@desklib.com
Available 24*7 on WhatsApp / Email
![[object Object]](/_next/static/media/star-bottom.7253800d.svg)
Unlock your academic potential
Copyright © 2020–2026 A2Z Services. All Rights Reserved. Developed and managed by ZUCOL.