Utrecht Technical University Campus Project Management Analysis
VerifiedAdded on 2019/12/03
|20
|3828
|172
Project
AI Summary
This project management assignment analyzes the construction of a new campus for Utrecht Technical University (UTU). It involves critical path analysis, Gantt chart creation, identification of critical and non-critical tasks, and float calculations. The project addresses the scheduling of building construction, including the Learning Resources Center, University Management Offices, International Business School, Science and Technology Center, The Student Village, and Student and Sports Center. It determines the latest start date for the project to meet the deadline, and evaluates whether the university president should proceed with an international conference based on building completion dates. The assignment further calculates the total number of solar panel units required, develops a month-by-month delivery schedule, estimates the cost of solar panel engineers, and compares the advantages and disadvantages of using freelance versus permanent staff. It also includes rescheduling the Gantt chart to accommodate production capacity, recalculating financial implications, and identifying the project manager's potential reluctance to accept plan changes. Finally, it implements a traffic light system for task status and cost tracking.

Operational and project
management
management
Paraphrase This Document
Need a fresh take? Get an instant paraphrase of this document with our AI Paraphraser
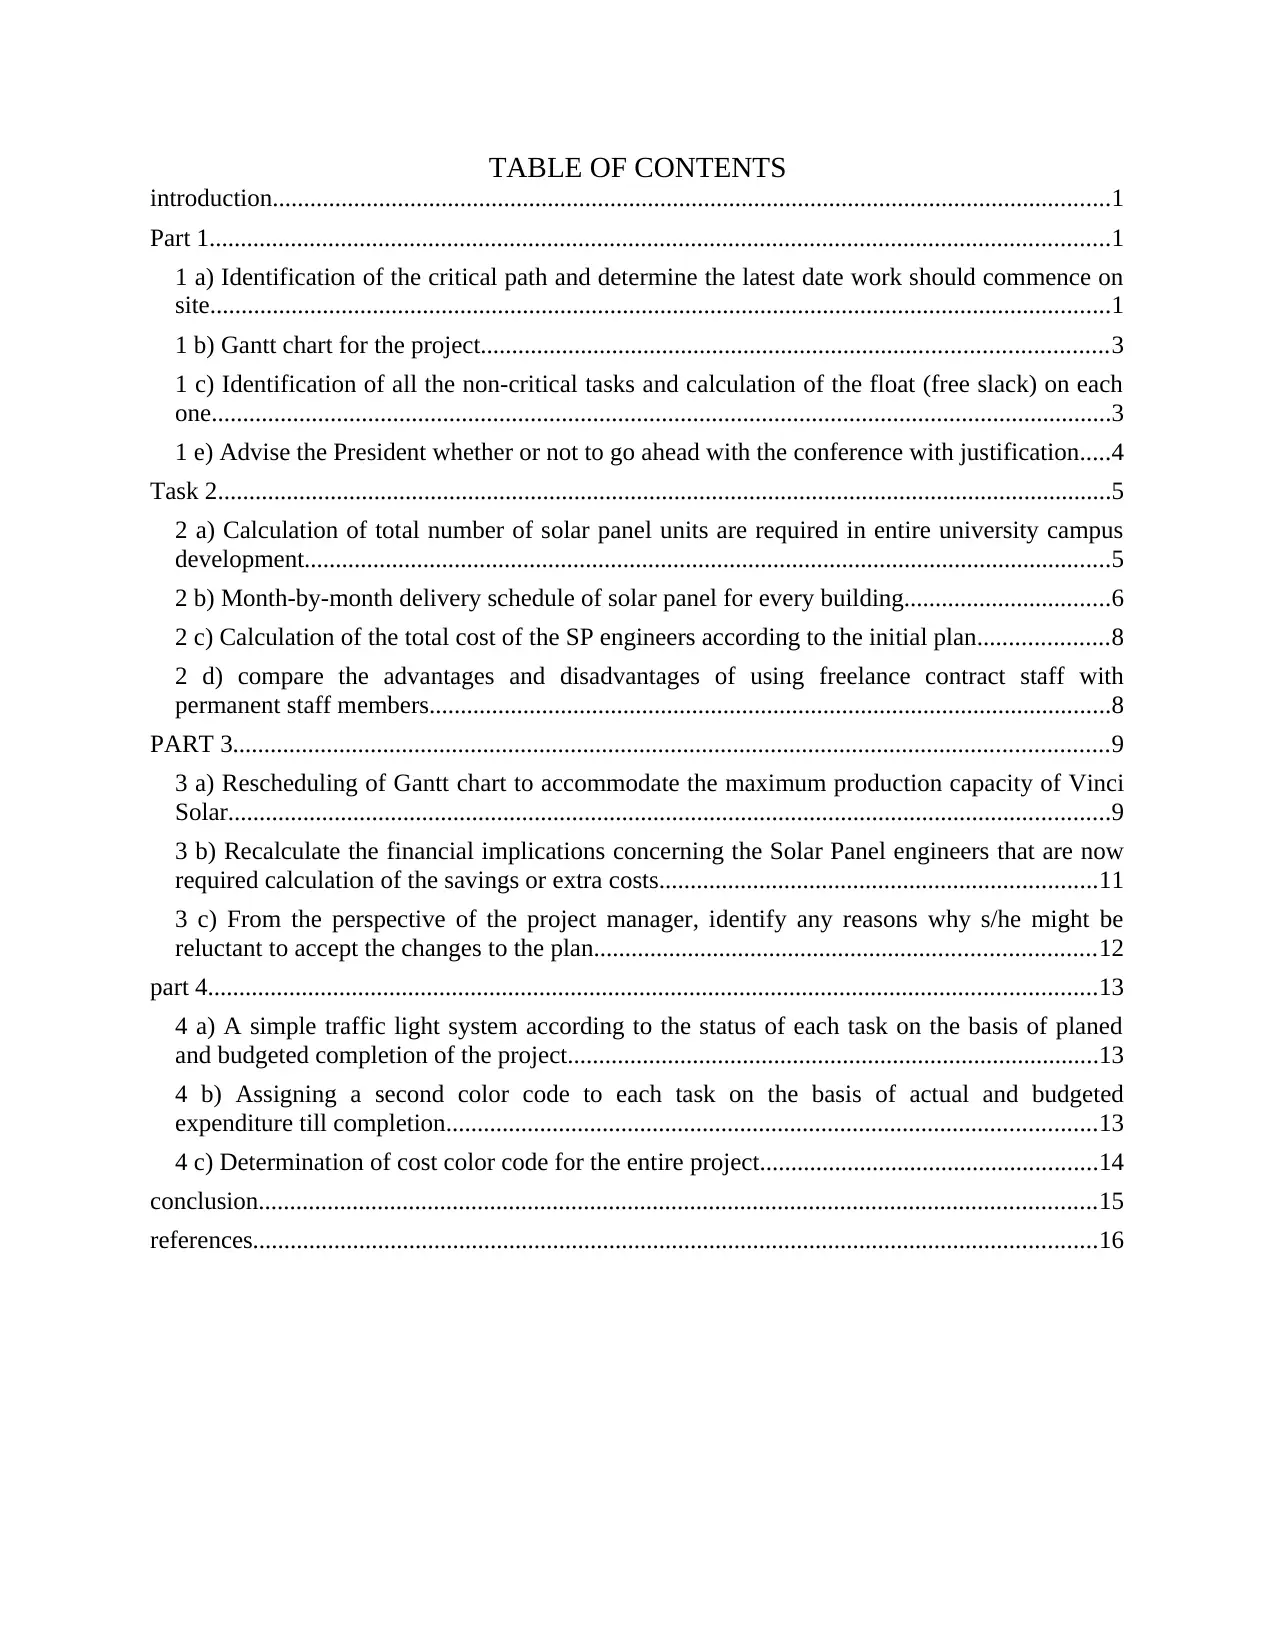
TABLE OF CONTENTS
introduction......................................................................................................................................1
Part 1................................................................................................................................................1
1 a) Identification of the critical path and determine the latest date work should commence on
site................................................................................................................................................1
1 b) Gantt chart for the project....................................................................................................3
1 c) Identification of all the non-critical tasks and calculation of the float (free slack) on each
one................................................................................................................................................3
1 e) Advise the President whether or not to go ahead with the conference with justification.....4
Task 2...............................................................................................................................................5
2 a) Calculation of total number of solar panel units are required in entire university campus
development.................................................................................................................................5
2 b) Month-by-month delivery schedule of solar panel for every building.................................6
2 c) Calculation of the total cost of the SP engineers according to the initial plan.....................8
2 d) compare the advantages and disadvantages of using freelance contract staff with
permanent staff members.............................................................................................................8
PART 3............................................................................................................................................9
3 a) Rescheduling of Gantt chart to accommodate the maximum production capacity of Vinci
Solar.............................................................................................................................................9
3 b) Recalculate the financial implications concerning the Solar Panel engineers that are now
required calculation of the savings or extra costs......................................................................11
3 c) From the perspective of the project manager, identify any reasons why s/he might be
reluctant to accept the changes to the plan................................................................................12
part 4..............................................................................................................................................13
4 a) A simple traffic light system according to the status of each task on the basis of planed
and budgeted completion of the project.....................................................................................13
4 b) Assigning a second color code to each task on the basis of actual and budgeted
expenditure till completion........................................................................................................13
4 c) Determination of cost color code for the entire project......................................................14
conclusion......................................................................................................................................15
references.......................................................................................................................................16
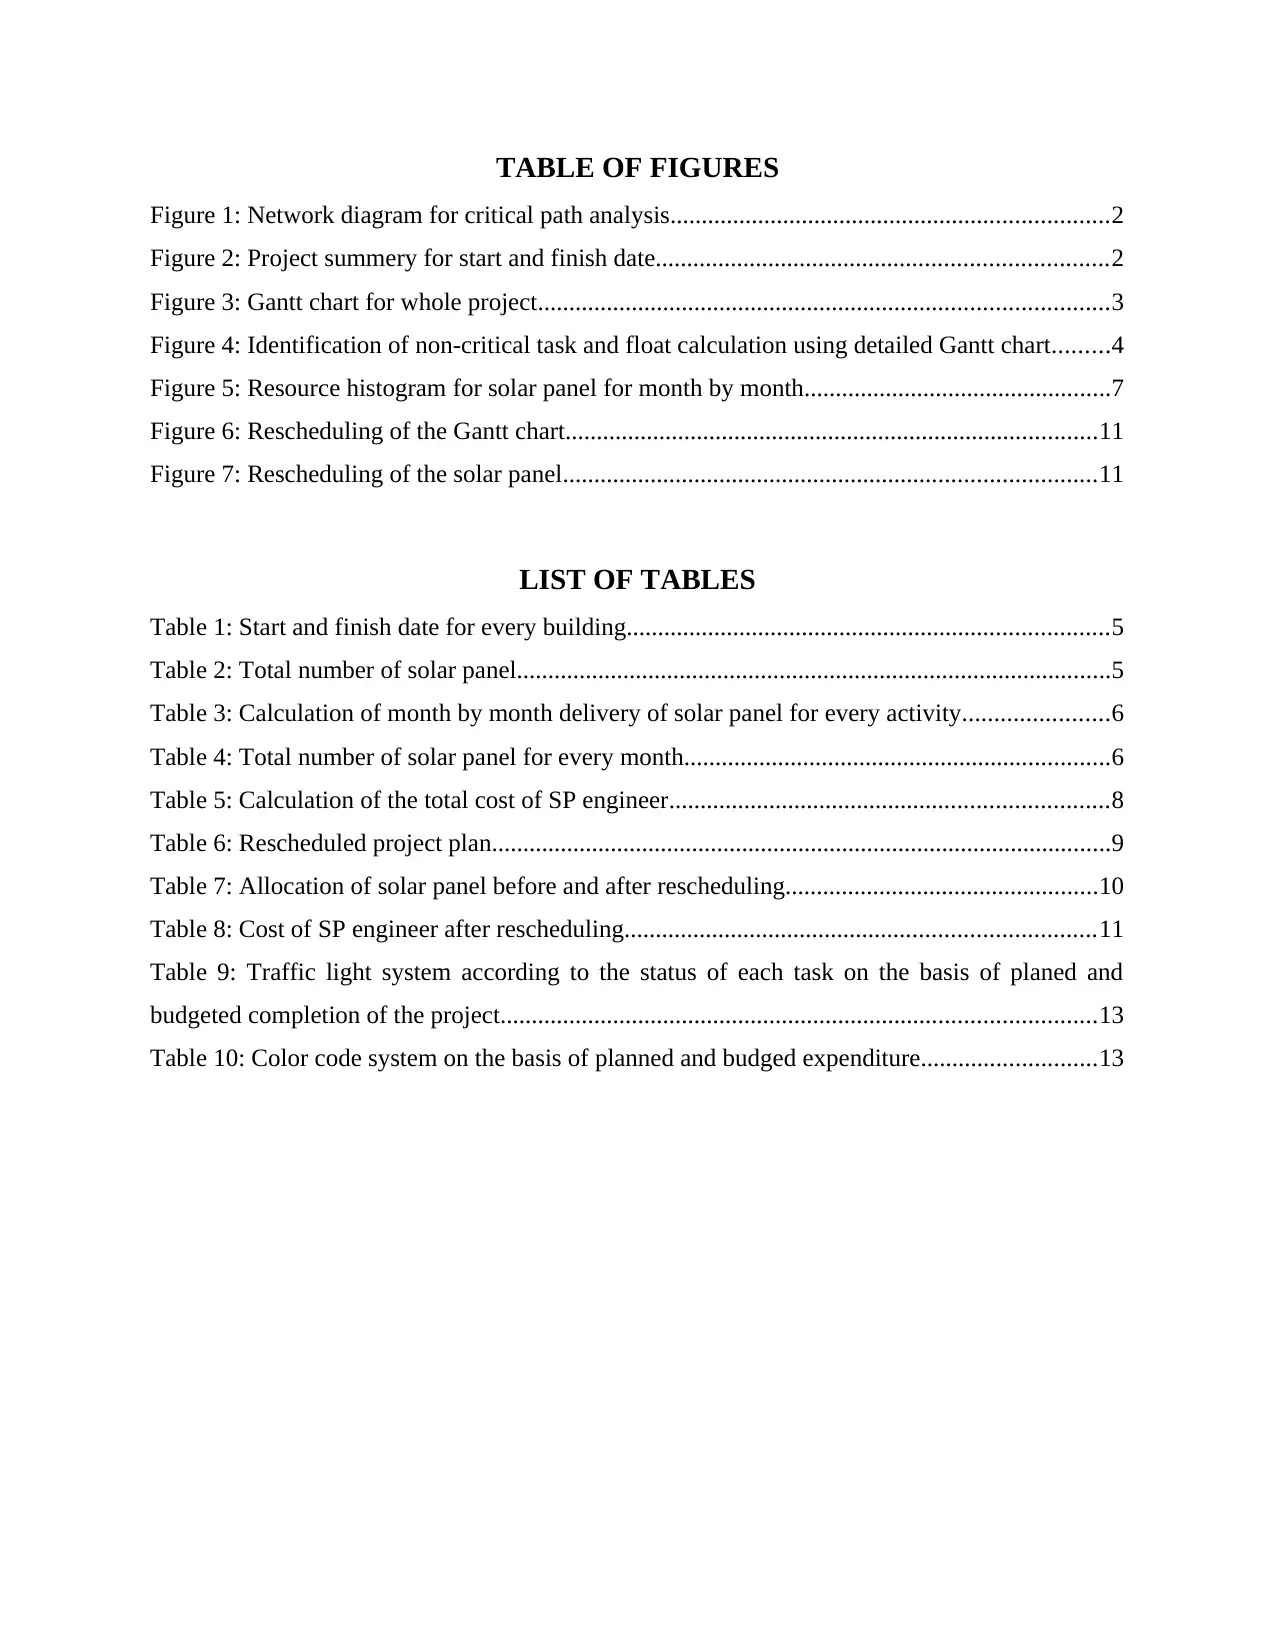
TABLE OF FIGURES
Figure 1: Network diagram for critical path analysis......................................................................2
Figure 2: Project summery for start and finish date........................................................................2
Figure 3: Gantt chart for whole project...........................................................................................3
Figure 4: Identification of non-critical task and float calculation using detailed Gantt chart.........4
Figure 5: Resource histogram for solar panel for month by month.................................................7
Figure 6: Rescheduling of the Gantt chart.....................................................................................11
Figure 7: Rescheduling of the solar panel.....................................................................................11
LIST OF TABLES
Table 1: Start and finish date for every building.............................................................................5
Table 2: Total number of solar panel...............................................................................................5
Table 3: Calculation of month by month delivery of solar panel for every activity.......................6
Table 4: Total number of solar panel for every month....................................................................6
Table 5: Calculation of the total cost of SP engineer......................................................................8
Table 6: Rescheduled project plan...................................................................................................9
Table 7: Allocation of solar panel before and after rescheduling..................................................10
Table 8: Cost of SP engineer after rescheduling...........................................................................11
Table 9: Traffic light system according to the status of each task on the basis of planed and
budgeted completion of the project...............................................................................................13
Table 10: Color code system on the basis of planned and budged expenditure............................13
⊘ This is a preview!⊘
Do you want full access?
Subscribe today to unlock all pages.
Trusted by 1+ million students worldwide
INTRODUCTION
Operation management of a business organization focuses on day to day strategic
business issues in systematic manner. In contrast, project management shed lights on planning,
organizing, implementing, monitoring and controlling different activities of the project for
attaining a specific goal and objective (Andersen, Dysvik and Vaagaasar, 2009). The current
research project is based on operation and project management and associated concepts.
Regarding this it will focus on project of Utrecht Technical University (UTU). As per the given
information, UTU has planned to develop a brand new campus for entire university and for
developing campus for university contractor needs to construct six buildings. Project report
applies different tools and techniques of project management for determining different facts and
figures of whole project. It will resolve different issues of the project using Gantt chart, network
diagram and other tools.
PART 1
For developing the campus building, contractor needs to construct six building; Learning
Resources center, University management offices, International Business School, Science and
Technology center, The Student Village and Student and Sports center.
1 a) Identification of the critical path and determine the latest date work should commence on
site
Critical path can be defined as a sequence of the different stages for determining the
minimum time for completing the whole project. It is also represents the longest path for the
project. It can be presented by the network diagram (Dey, Clegg and Bennett, 2010). Critical
path for the current project is as under:
1 | P a g e
Paraphrase This Document
Need a fresh take? Get an instant paraphrase of this document with our AI Paraphraser
Figure 1: Network diagram for critical path analysis
Figure 2: Project summery for start and finish date
As per the above figures critical path of the project is A-C-F = 6+8+4= 18 months.
Therefore, it has reflected that development of the campus building will be completed in 18
months. As per the given information and requirements of UTU project must be completed till
31st August 2017. Using this information and above calculation it can be said that latest date
work should commence on site by 15th April 2016. Therefore, at this start date the whole project
will be completed in 18 months till 31st August 2017 (Hobbs, 2009).
2 | P a g e
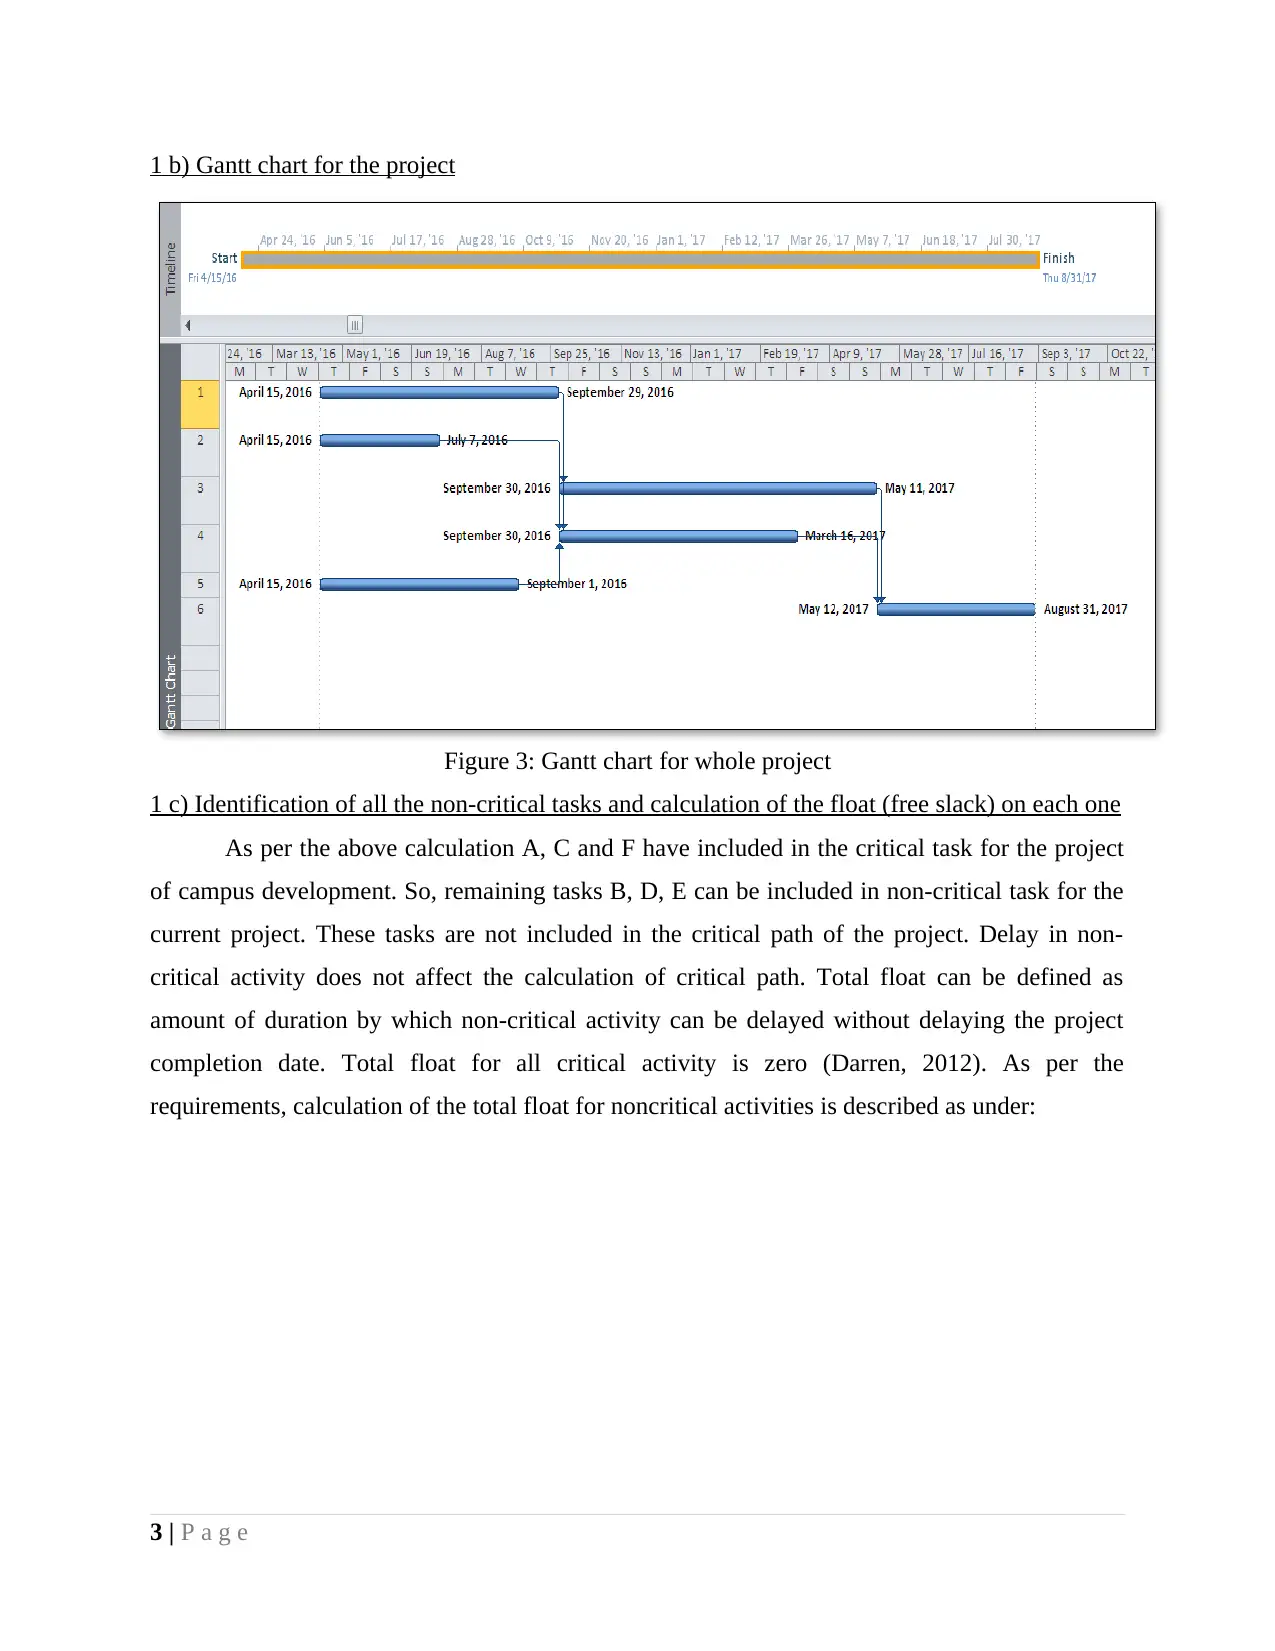
1 b) Gantt chart for the project
Figure 3: Gantt chart for whole project
1 c) Identification of all the non-critical tasks and calculation of the float (free slack) on each one
As per the above calculation A, C and F have included in the critical task for the project
of campus development. So, remaining tasks B, D, E can be included in non-critical task for the
current project. These tasks are not included in the critical path of the project. Delay in non-
critical activity does not affect the calculation of critical path. Total float can be defined as
amount of duration by which non-critical activity can be delayed without delaying the project
completion date. Total float for all critical activity is zero (Darren, 2012). As per the
requirements, calculation of the total float for noncritical activities is described as under:
3 | P a g e
⊘ This is a preview!⊘
Do you want full access?
Subscribe today to unlock all pages.
Trusted by 1+ million students worldwide
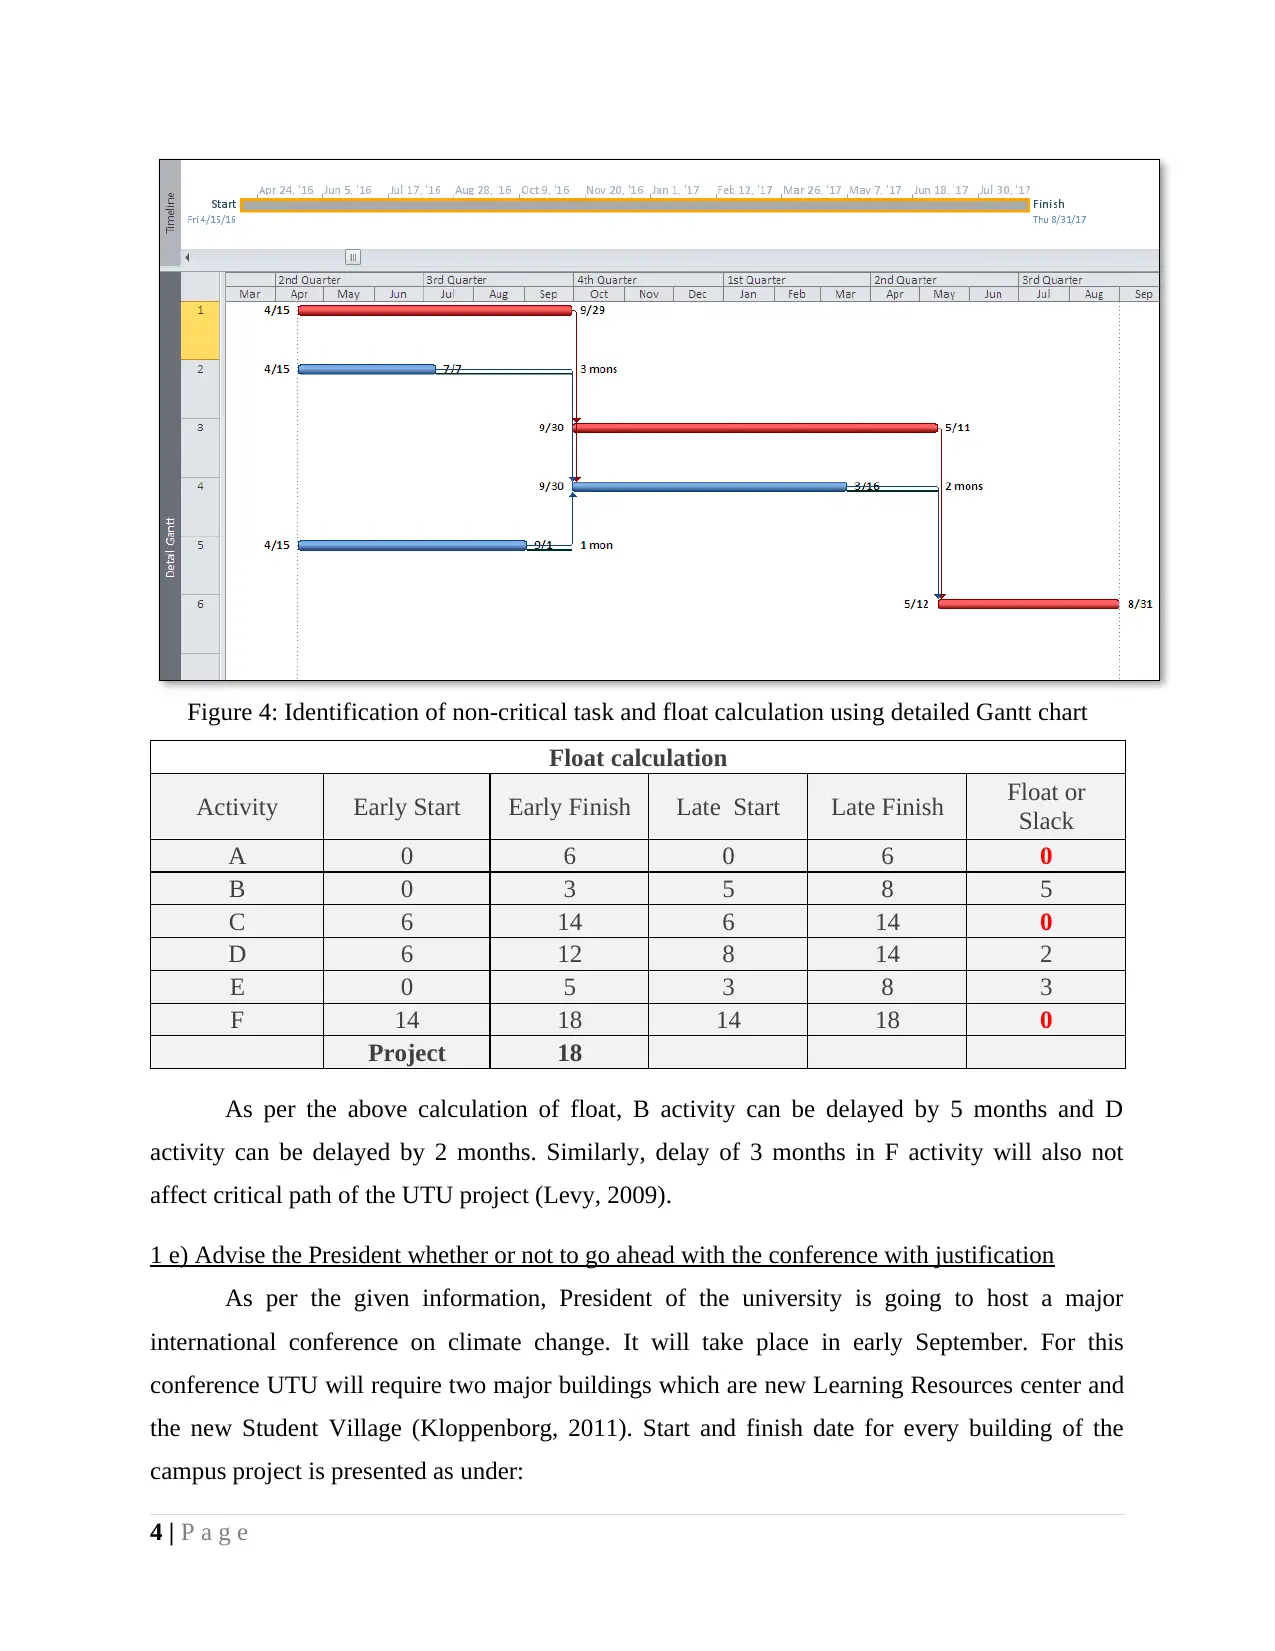
Figure 4: Identification of non-critical task and float calculation using detailed Gantt chart
Float calculation
Activity Early Start Early Finish Late Start Late Finish Float or
Slack
A 0 6 0 6 0
B 0 3 5 8 5
C 6 14 6 14 0
D 6 12 8 14 2
E 0 5 3 8 3
F 14 18 14 18 0
Project 18
As per the above calculation of float, B activity can be delayed by 5 months and D
activity can be delayed by 2 months. Similarly, delay of 3 months in F activity will also not
affect critical path of the UTU project (Levy, 2009).
1 e) Advise the President whether or not to go ahead with the conference with justification
As per the given information, President of the university is going to host a major
international conference on climate change. It will take place in early September. For this
conference UTU will require two major buildings which are new Learning Resources center and
the new Student Village (Kloppenborg, 2011). Start and finish date for every building of the
campus project is presented as under:
4 | P a g e
Paraphrase This Document
Need a fresh take? Get an instant paraphrase of this document with our AI Paraphraser
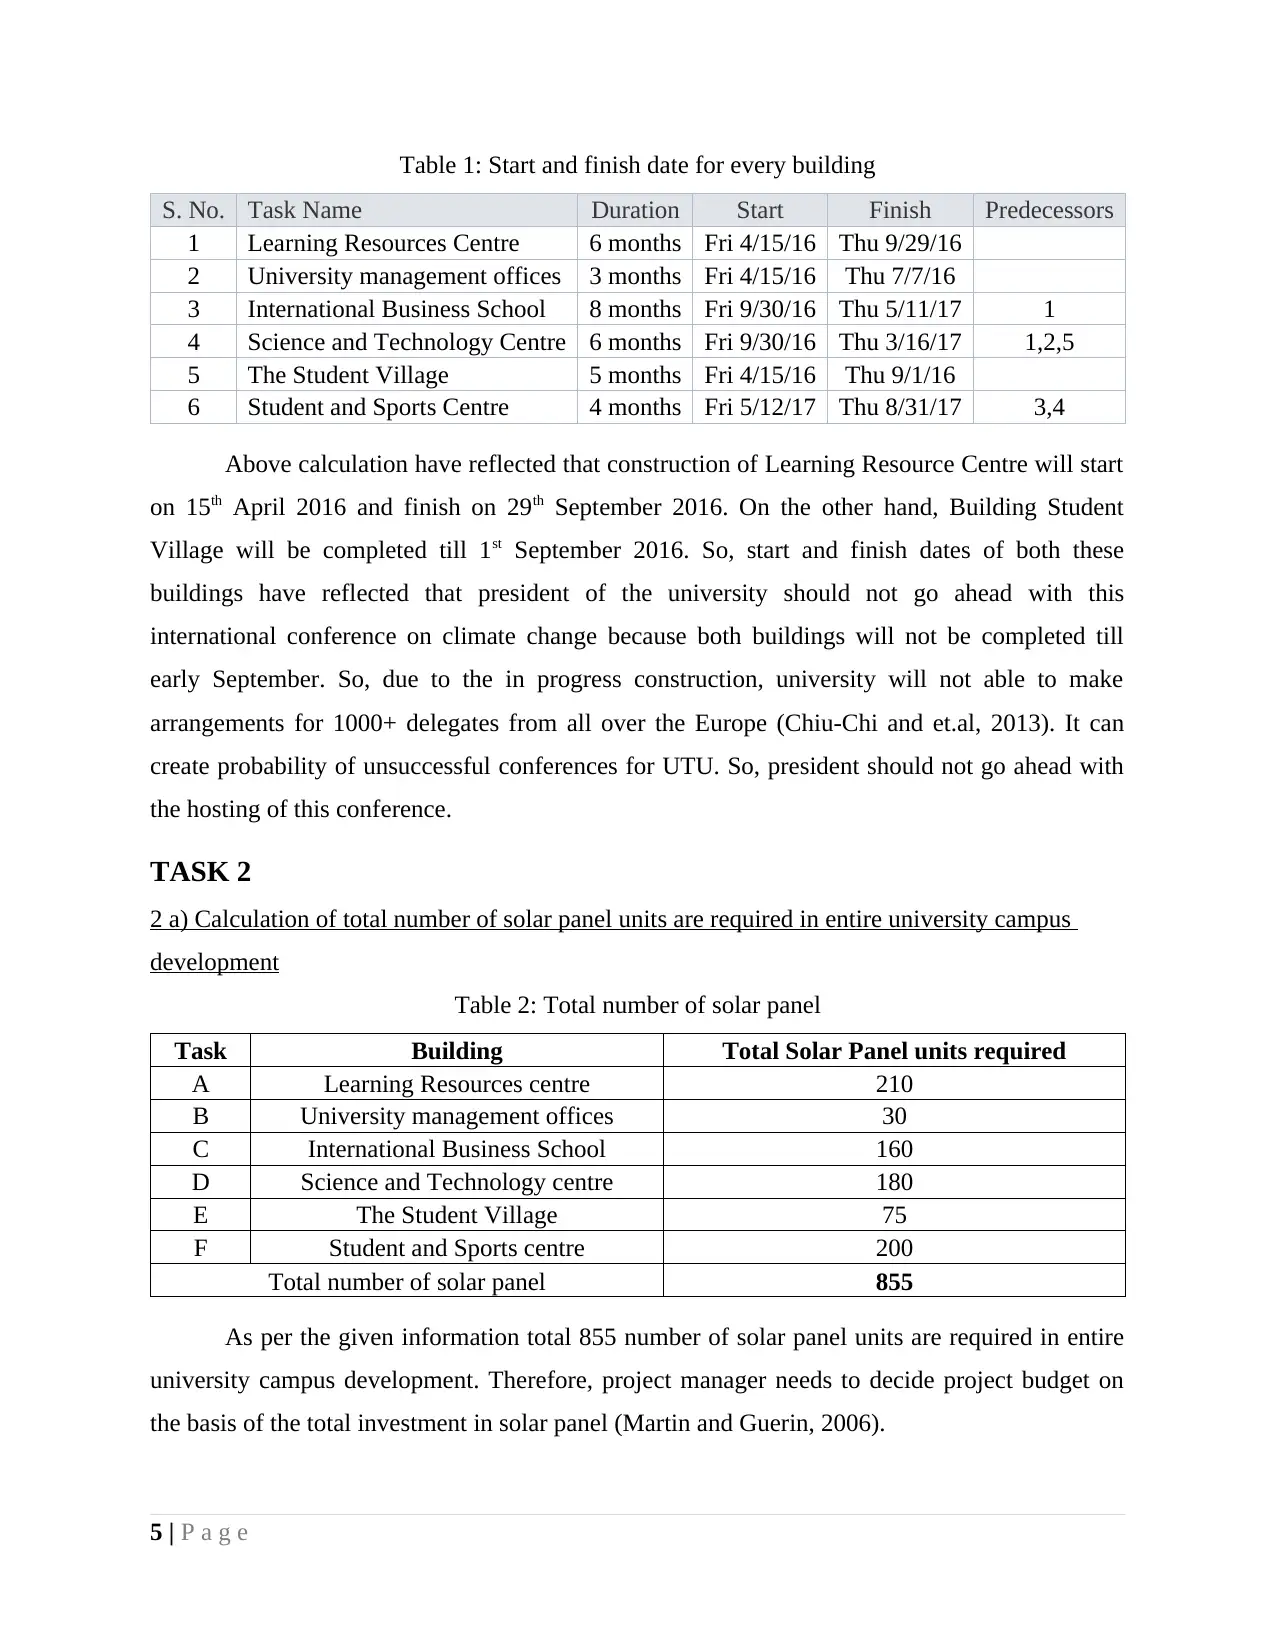
Table 1: Start and finish date for every building
S. No. Task Name Duration Start Finish Predecessors
1 Learning Resources Centre 6 months Fri 4/15/16 Thu 9/29/16
2 University management offices 3 months Fri 4/15/16 Thu 7/7/16
3 International Business School 8 months Fri 9/30/16 Thu 5/11/17 1
4 Science and Technology Centre 6 months Fri 9/30/16 Thu 3/16/17 1,2,5
5 The Student Village 5 months Fri 4/15/16 Thu 9/1/16
6 Student and Sports Centre 4 months Fri 5/12/17 Thu 8/31/17 3,4
Above calculation have reflected that construction of Learning Resource Centre will start
on 15th April 2016 and finish on 29th September 2016. On the other hand, Building Student
Village will be completed till 1st September 2016. So, start and finish dates of both these
buildings have reflected that president of the university should not go ahead with this
international conference on climate change because both buildings will not be completed till
early September. So, due to the in progress construction, university will not able to make
arrangements for 1000+ delegates from all over the Europe (Chiu-Chi and et.al, 2013). It can
create probability of unsuccessful conferences for UTU. So, president should not go ahead with
the hosting of this conference.
TASK 2
2 a) Calculation of total number of solar panel units are required in entire university campus
development
Table 2: Total number of solar panel
Task Building Total Solar Panel units required
A Learning Resources centre 210
B University management offices 30
C International Business School 160
D Science and Technology centre 180
E The Student Village 75
F Student and Sports centre 200
Total number of solar panel 855
As per the given information total 855 number of solar panel units are required in entire
university campus development. Therefore, project manager needs to decide project budget on
the basis of the total investment in solar panel (Martin and Guerin, 2006).
5 | P a g e
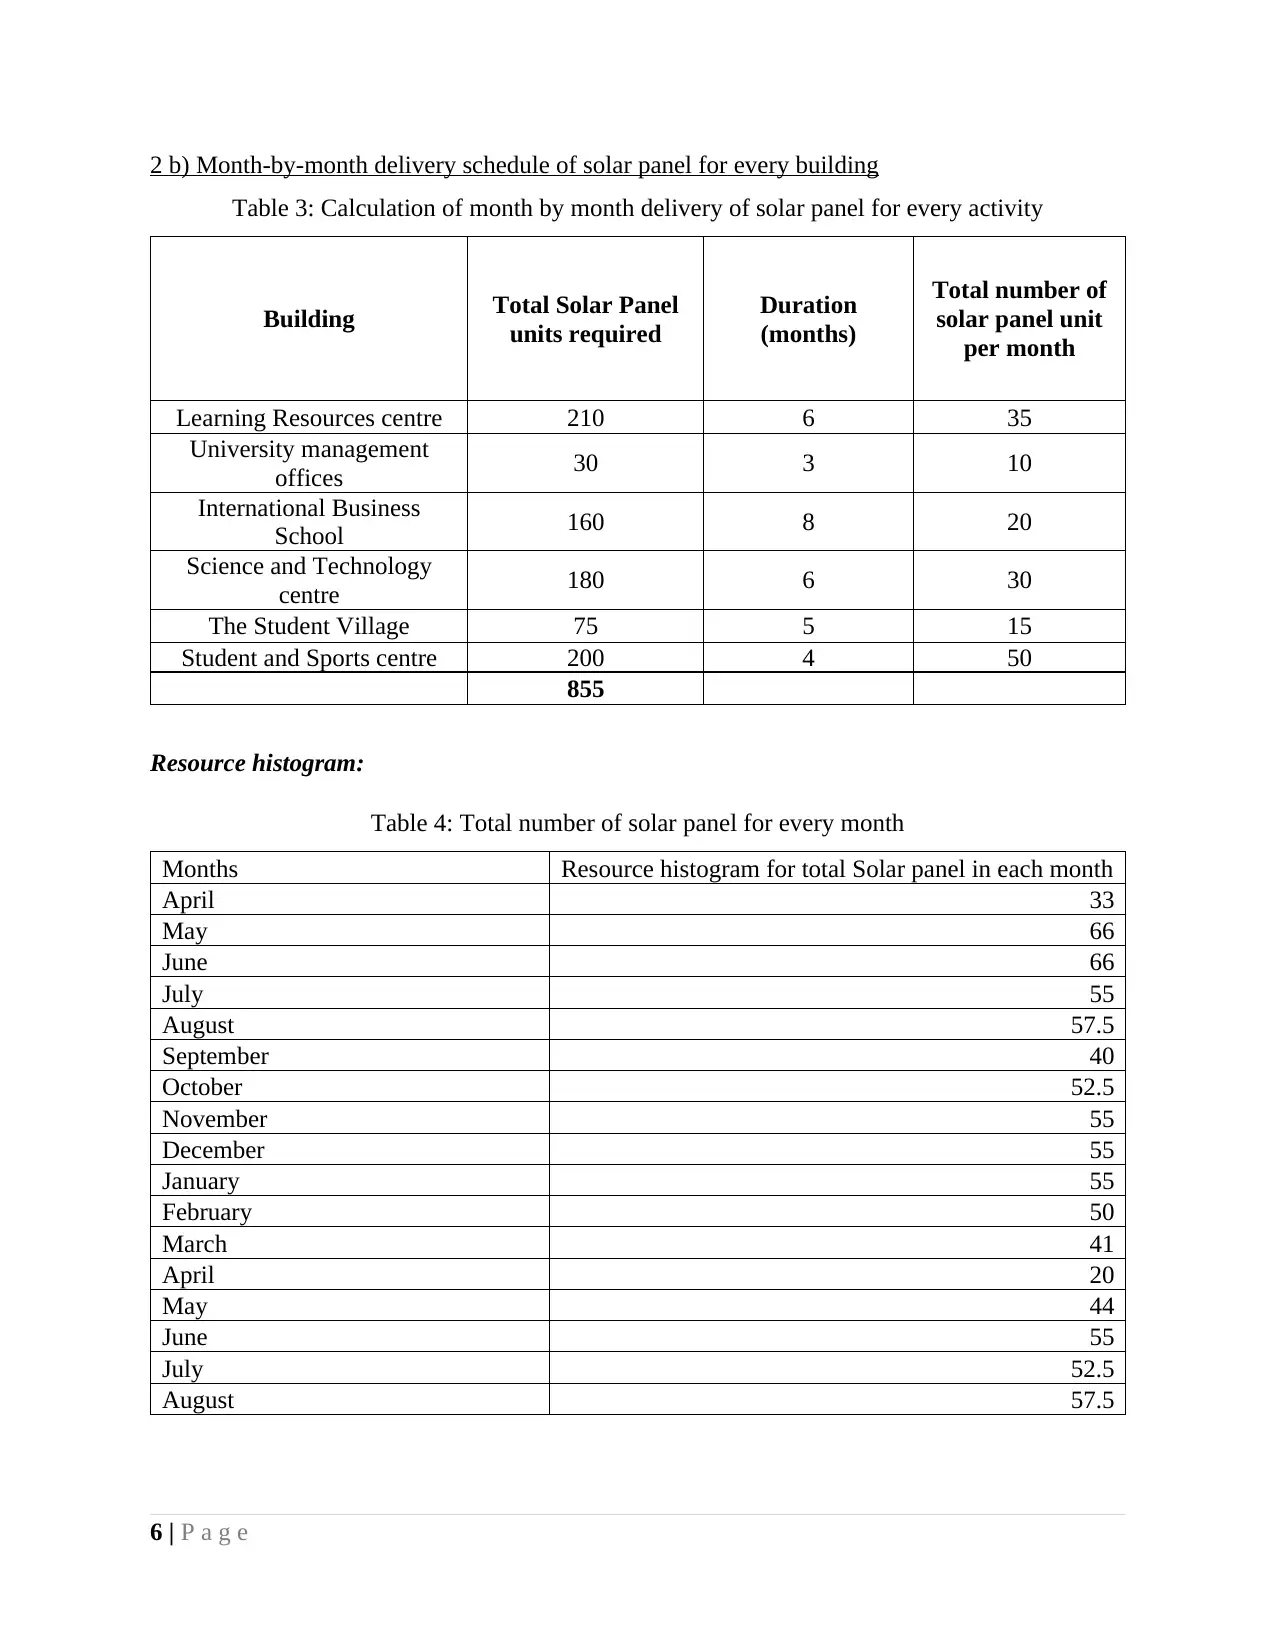
2 b) Month-by-month delivery schedule of solar panel for every building
Table 3: Calculation of month by month delivery of solar panel for every activity
Building Total Solar Panel
units required
Duration
(months)
Total number of
solar panel unit
per month
Learning Resources centre 210 6 35
University management
offices 30 3 10
International Business
School 160 8 20
Science and Technology
centre 180 6 30
The Student Village 75 5 15
Student and Sports centre 200 4 50
855
Resource histogram:
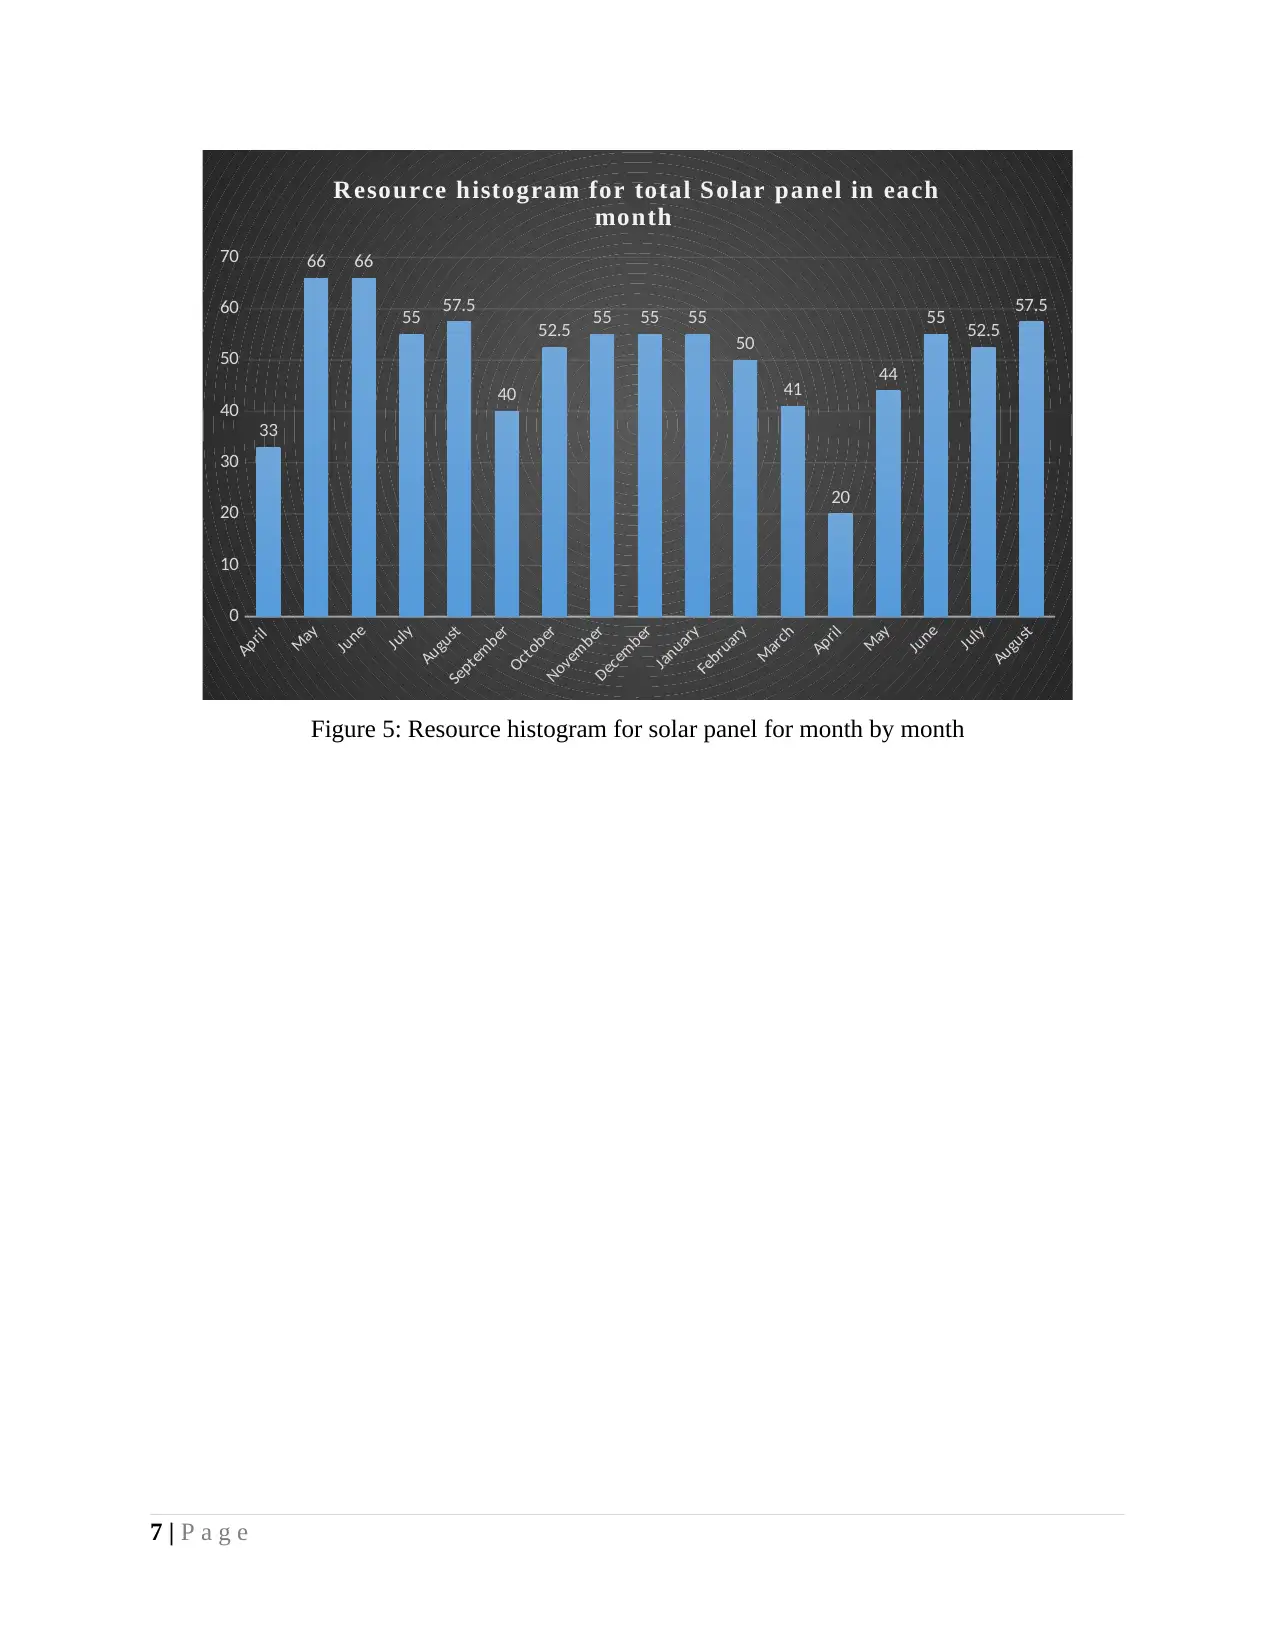
Table 4: Total number of solar panel for every month
Months Resource histogram for total Solar panel in each month
April 33
May 66
June 66
July 55
August 57.5
September 40
October 52.5
November 55
December 55
January 55
February 50
March 41
April 20
May 44
June 55
July 52.5
August 57.5
6 | P a g e
Table 3: Calculation of month by month delivery of solar panel for every activity
Building Total Solar Panel
units required
Duration
(months)
Total number of
solar panel unit
per month
Learning Resources centre 210 6 35
University management
offices 30 3 10
International Business
School 160 8 20
Science and Technology
centre 180 6 30
The Student Village 75 5 15
Student and Sports centre 200 4 50
855
Resource histogram:
Table 4: Total number of solar panel for every month
Months Resource histogram for total Solar panel in each month
April 33
May 66
June 66
July 55
August 57.5
September 40
October 52.5
November 55
December 55
January 55
February 50
March 41
April 20
May 44
June 55
July 52.5
August 57.5
6 | P a g e
⊘ This is a preview!⊘
Do you want full access?
Subscribe today to unlock all pages.
Trusted by 1+ million students worldwide
April
May
June
July
August
September
October
November
December
January
February
March
April
May
June
July
August
0
10
20
30
40
50
60
70
33
66 66
55 57.5
40
52.5 55 55 55
50
41
20
44
55 52.5
57.5
R esource histogram for total Solar panel in each
month
Figure 5: Resource histogram for solar panel for month by month
7 | P a g e
May
June
July
August
September
October
November
December
January
February
March
April
May
June
July
August
0
10
20
30
40
50
60
70
33
66 66
55 57.5
40
52.5 55 55 55
50
41
20
44
55 52.5
57.5
R esource histogram for total Solar panel in each
month
Figure 5: Resource histogram for solar panel for month by month
7 | P a g e
Paraphrase This Document
Need a fresh take? Get an instant paraphrase of this document with our AI Paraphraser
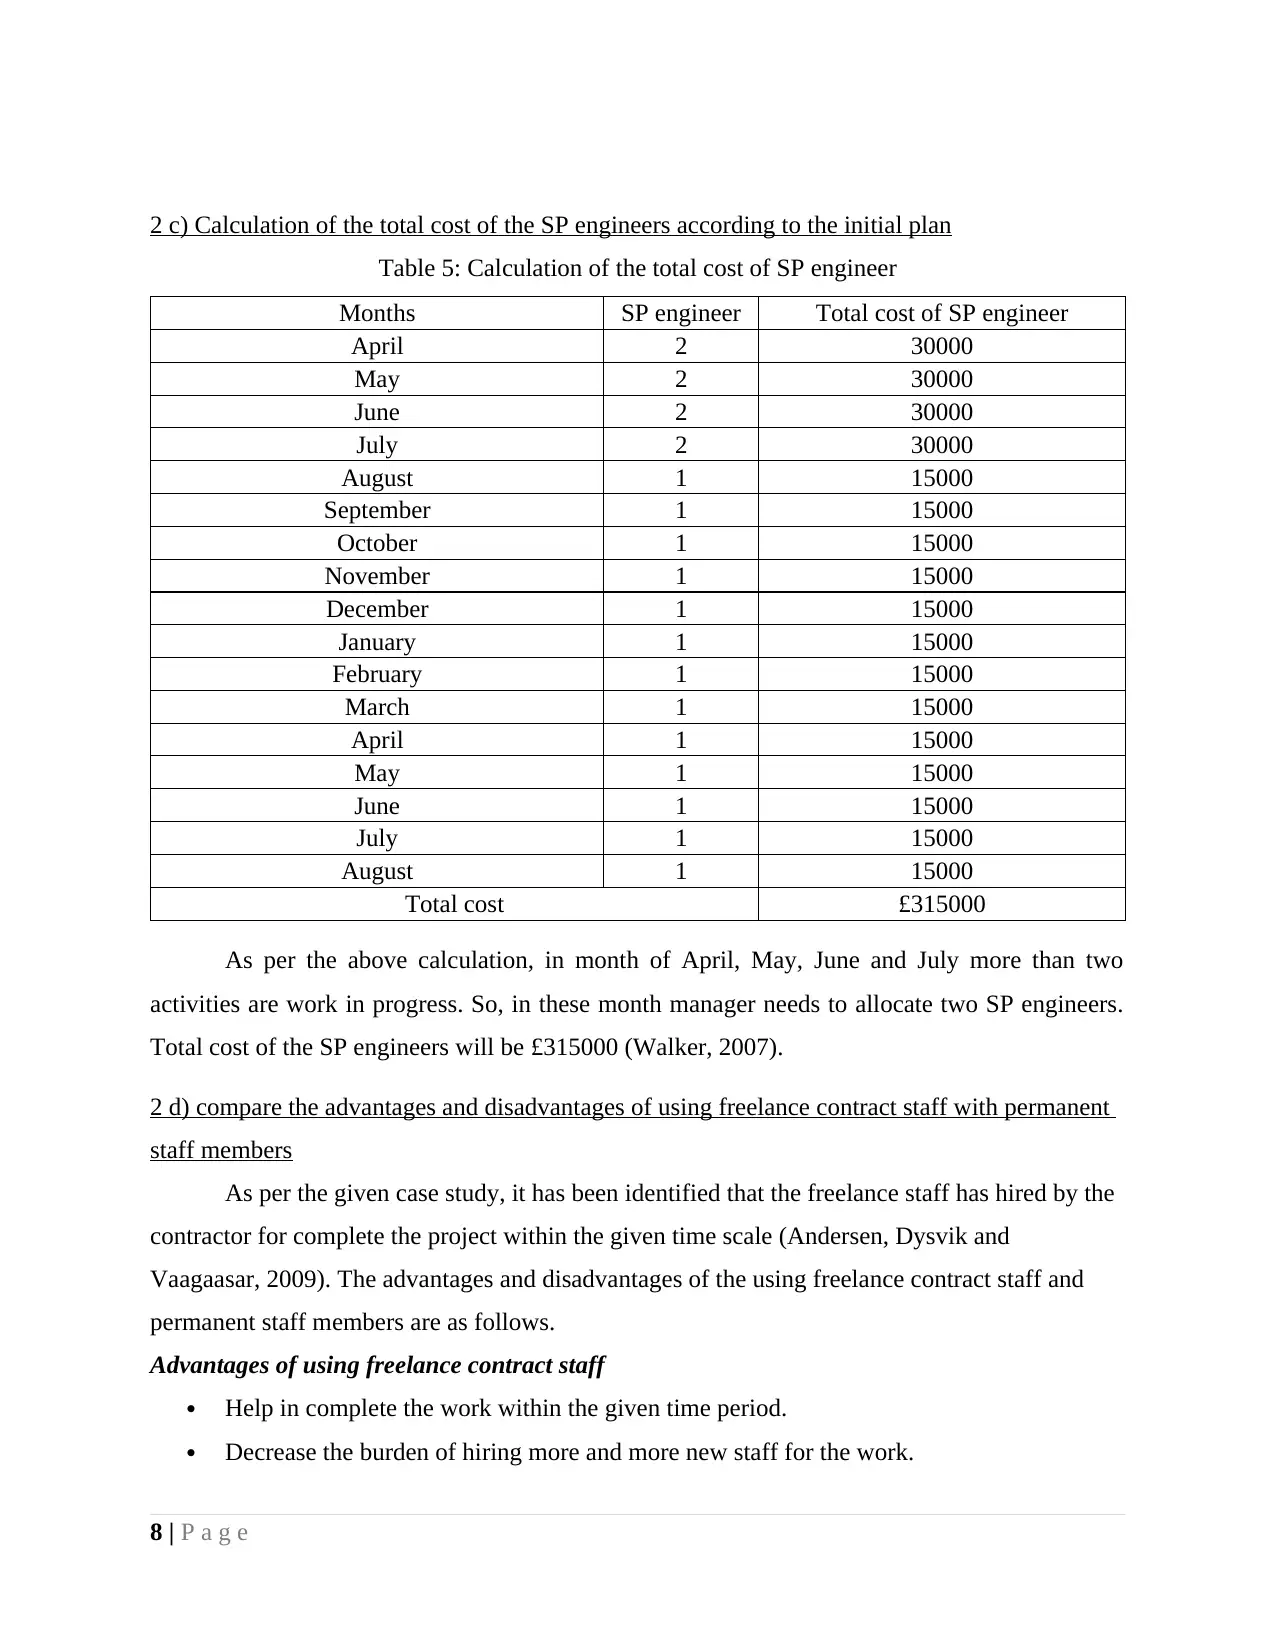
2 c) Calculation of the total cost of the SP engineers according to the initial plan
Table 5: Calculation of the total cost of SP engineer
Months SP engineer Total cost of SP engineer
April 2 30000
May 2 30000
June 2 30000
July 2 30000
August 1 15000
September 1 15000
October 1 15000
November 1 15000
December 1 15000
January 1 15000
February 1 15000
March 1 15000
April 1 15000
May 1 15000
June 1 15000
July 1 15000
August 1 15000
Total cost £315000
As per the above calculation, in month of April, May, June and July more than two
activities are work in progress. So, in these month manager needs to allocate two SP engineers.
Total cost of the SP engineers will be £315000 (Walker, 2007).
2 d) compare the advantages and disadvantages of using freelance contract staff with permanent
staff members
As per the given case study, it has been identified that the freelance staff has hired by the
contractor for complete the project within the given time scale (Andersen, Dysvik and
Vaagaasar, 2009). The advantages and disadvantages of the using freelance contract staff and
permanent staff members are as follows.
Advantages of using freelance contract staff
Help in complete the work within the given time period.
Decrease the burden of hiring more and more new staff for the work.
8 | P a g e
Provide greater flexibility of working.
Disadvantages of using freelance contract staff
Lose some control over the monitoring of the work.
Not showing loyalty towards the firm.
Not promote the brands
Advantages of using permanent staff
Not required to train the staff
Giving the job security to them.
Paying less wages as compare to freelance contract staff
Disadvantages of using permanent staff
Always expecting benefits from the company (Zwikael, 2009).
Increase the legal work while paying the wages.
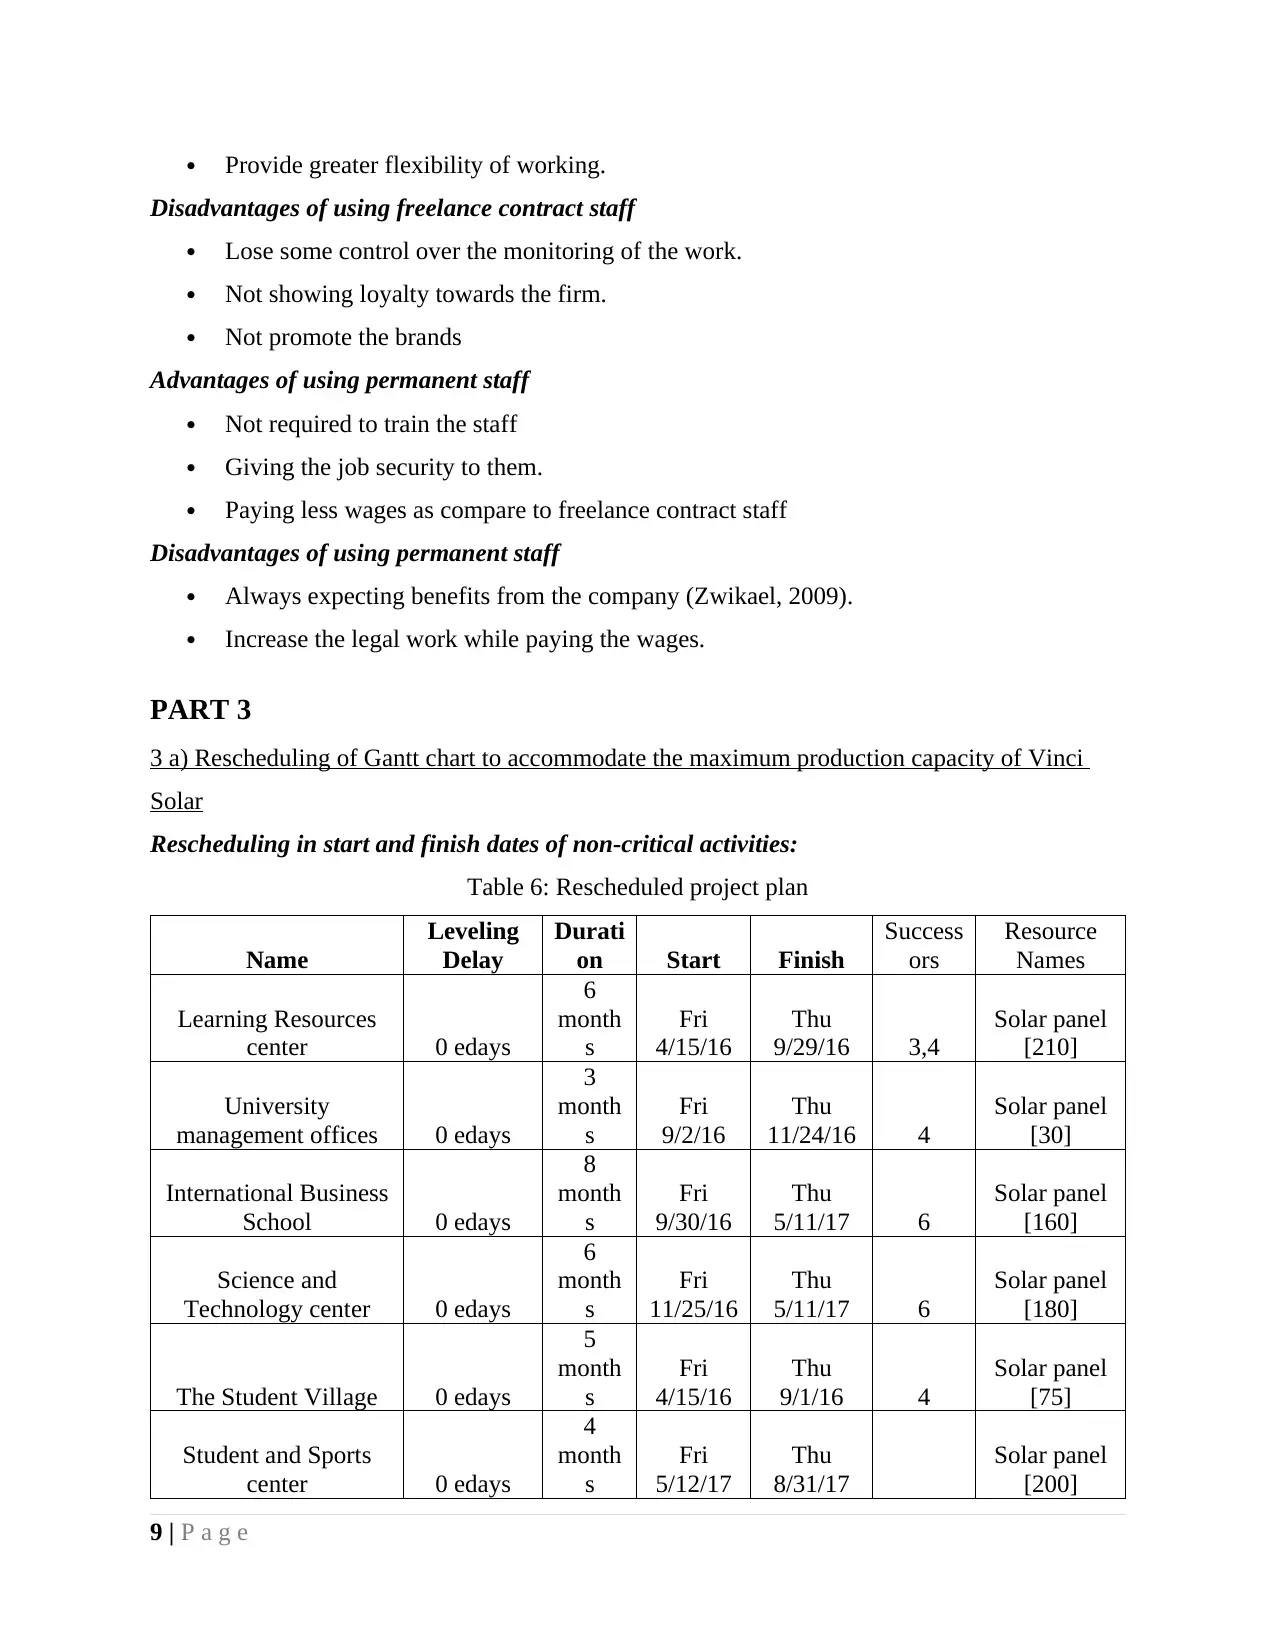
PART 3
3 a) Rescheduling of Gantt chart to accommodate the maximum production capacity of Vinci
Solar
Rescheduling in start and finish dates of non-critical activities:
Table 6: Rescheduled project plan
Name
Leveling
Delay
Durati
on Start Finish
Success
ors
Resource
Names
Learning Resources
center 0 edays
6
month
s
Fri
4/15/16
Thu
9/29/16 3,4
Solar panel
[210]
University
management offices 0 edays
3
month
s
Fri
9/2/16
Thu
11/24/16 4
Solar panel
[30]
International Business
School 0 edays
8
month
s
Fri
9/30/16
Thu
5/11/17 6
Solar panel
[160]
Science and
Technology center 0 edays
6
month
s
Fri
11/25/16
Thu
5/11/17 6
Solar panel
[180]
The Student Village 0 edays
5
month
s
Fri
4/15/16
Thu
9/1/16 4
Solar panel
[75]
Student and Sports
center 0 edays
4
month
s
Fri
5/12/17
Thu
8/31/17
Solar panel
[200]
9 | P a g e
Disadvantages of using freelance contract staff
Lose some control over the monitoring of the work.
Not showing loyalty towards the firm.
Not promote the brands
Advantages of using permanent staff
Not required to train the staff
Giving the job security to them.
Paying less wages as compare to freelance contract staff
Disadvantages of using permanent staff
Always expecting benefits from the company (Zwikael, 2009).
Increase the legal work while paying the wages.
PART 3
3 a) Rescheduling of Gantt chart to accommodate the maximum production capacity of Vinci
Solar
Rescheduling in start and finish dates of non-critical activities:
Table 6: Rescheduled project plan
Name
Leveling
Delay
Durati
on Start Finish
Success
ors
Resource
Names
Learning Resources
center 0 edays
6
month
s
Fri
4/15/16
Thu
9/29/16 3,4
Solar panel
[210]
University
management offices 0 edays
3
month
s
Fri
9/2/16
Thu
11/24/16 4
Solar panel
[30]
International Business
School 0 edays
8
month
s
Fri
9/30/16
Thu
5/11/17 6
Solar panel
[160]
Science and
Technology center 0 edays
6
month
s
Fri
11/25/16
Thu
5/11/17 6
Solar panel
[180]
The Student Village 0 edays
5
month
s
Fri
4/15/16
Thu
9/1/16 4
Solar panel
[75]
Student and Sports
center 0 edays
4
month
s
Fri
5/12/17
Thu
8/31/17
Solar panel
[200]
9 | P a g e
⊘ This is a preview!⊘
Do you want full access?
Subscribe today to unlock all pages.
Trusted by 1+ million students worldwide
1 out of 20
Related Documents


Your All-in-One AI-Powered Toolkit for Academic Success.
+13062052269
info@desklib.com
Available 24*7 on WhatsApp / Email
![[object Object]](/_next/static/media/star-bottom.7253800d.svg)
Unlock your academic potential
Copyright © 2020–2026 A2Z Services. All Rights Reserved. Developed and managed by ZUCOL.