Healthcare Data Analysis: Correlation between Vaccines and Admissions
VerifiedAdded on 2023/06/13
|18
|1611
|243
Report
AI Summary
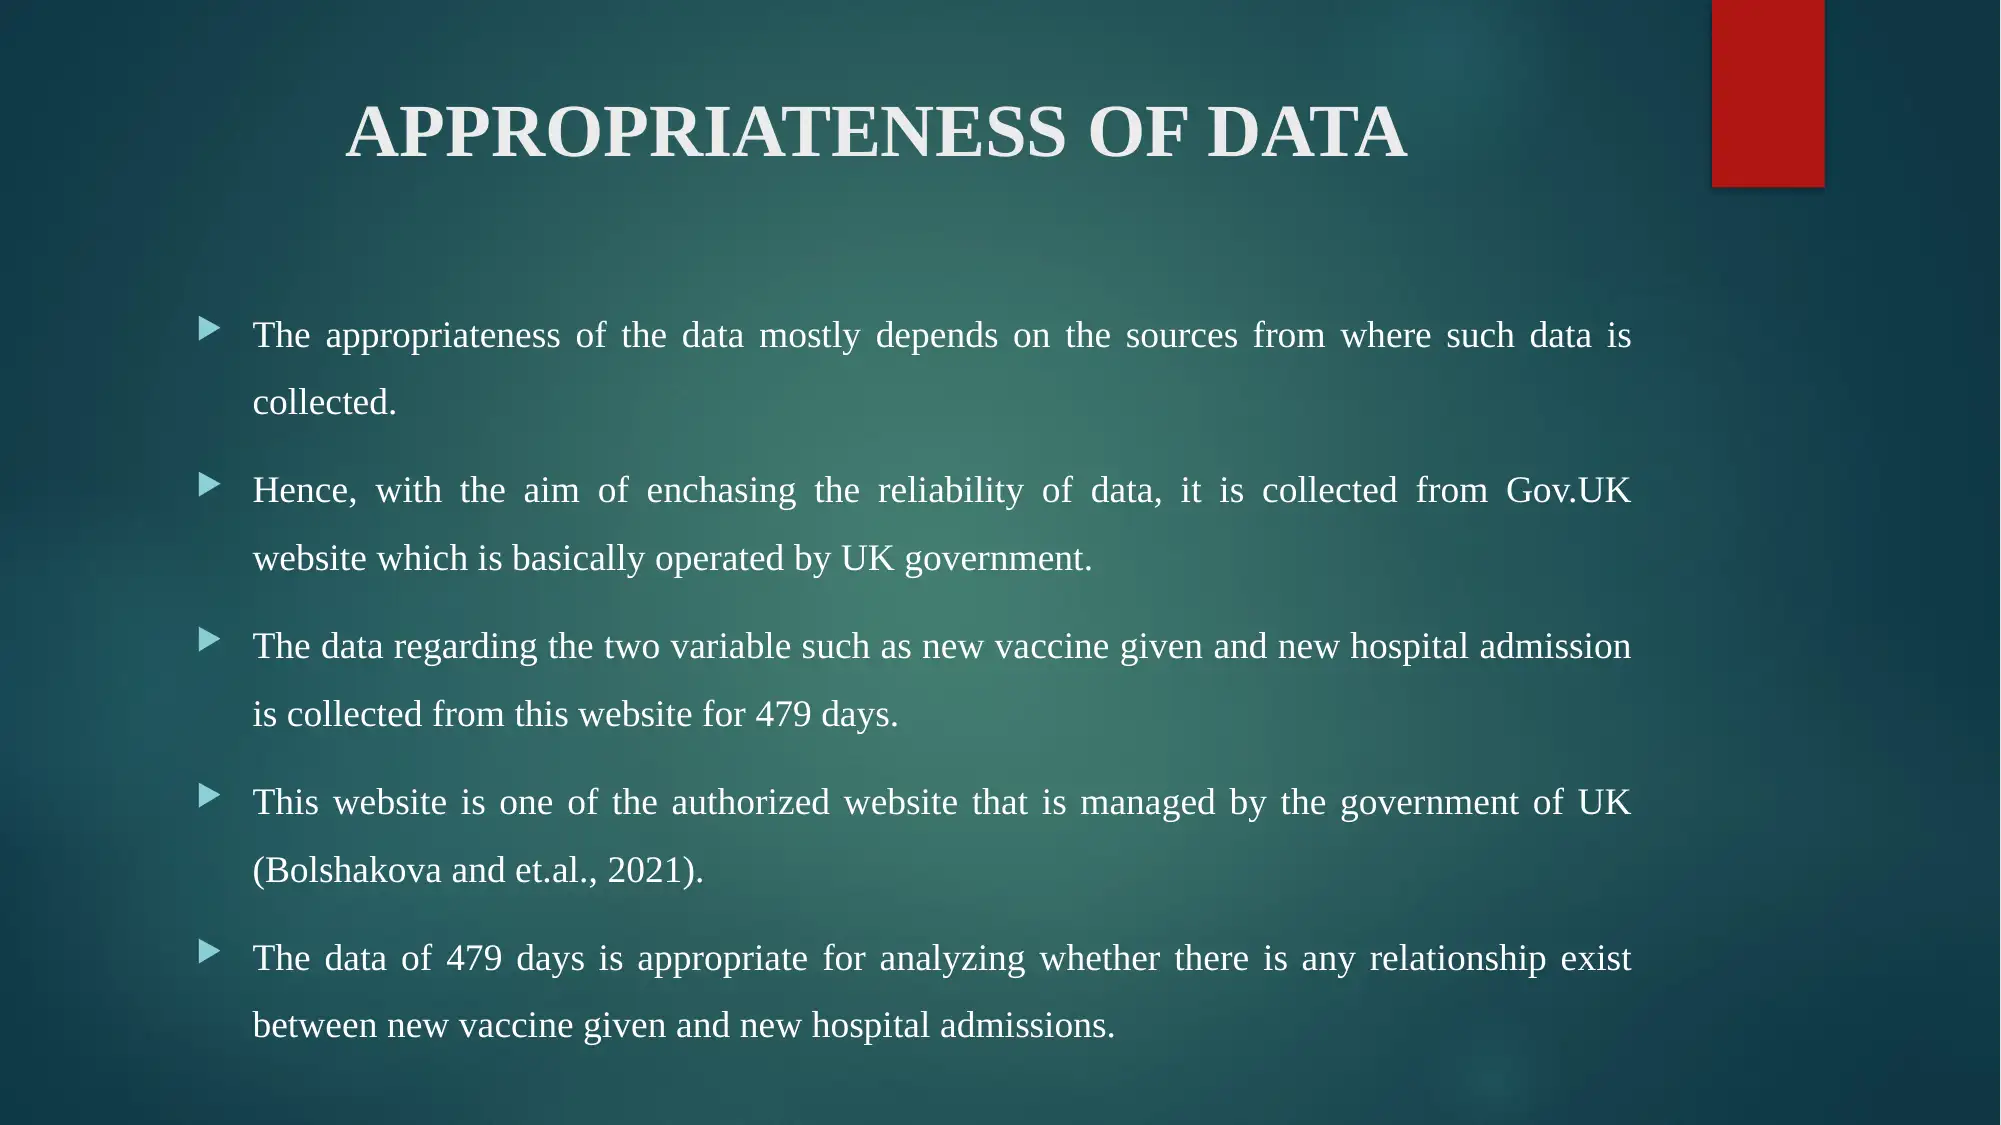
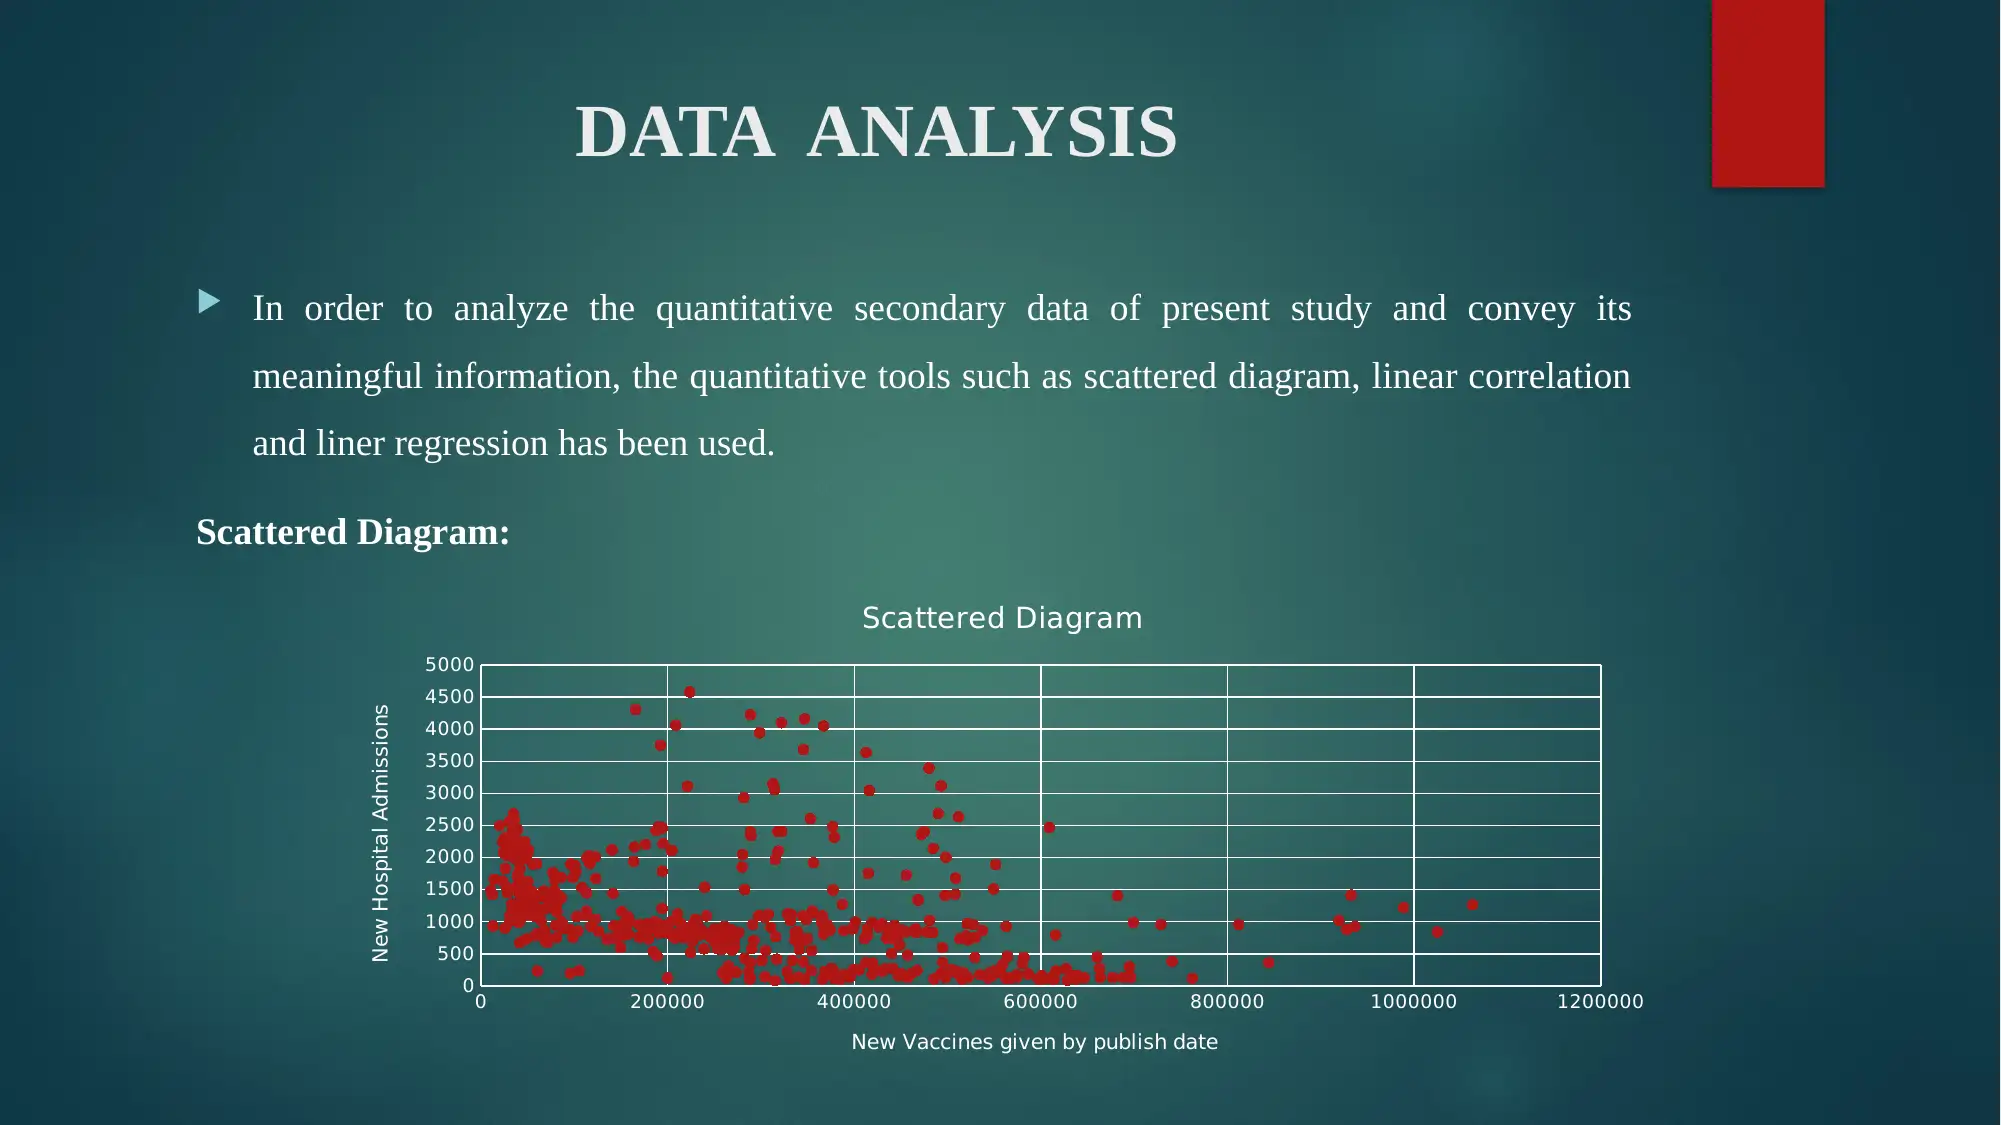
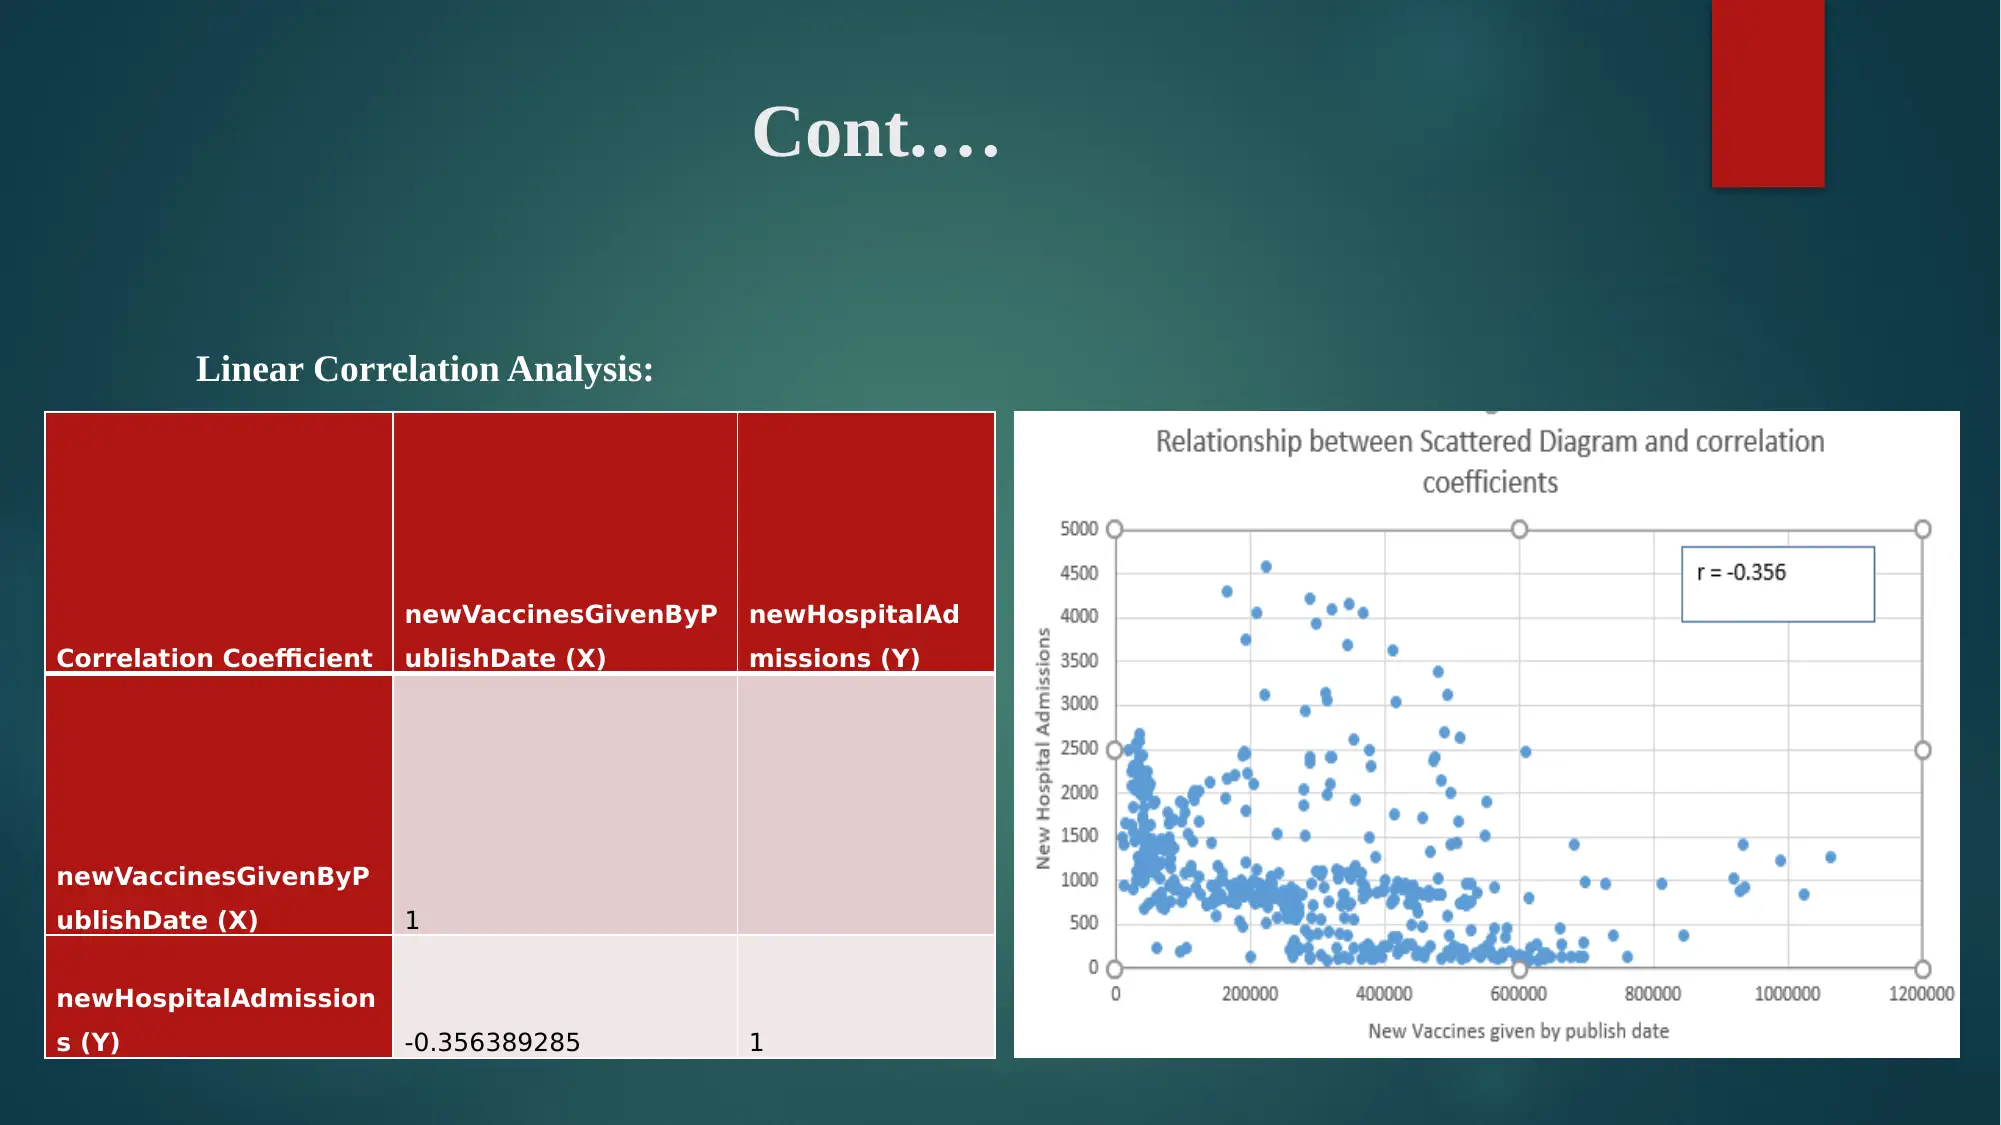
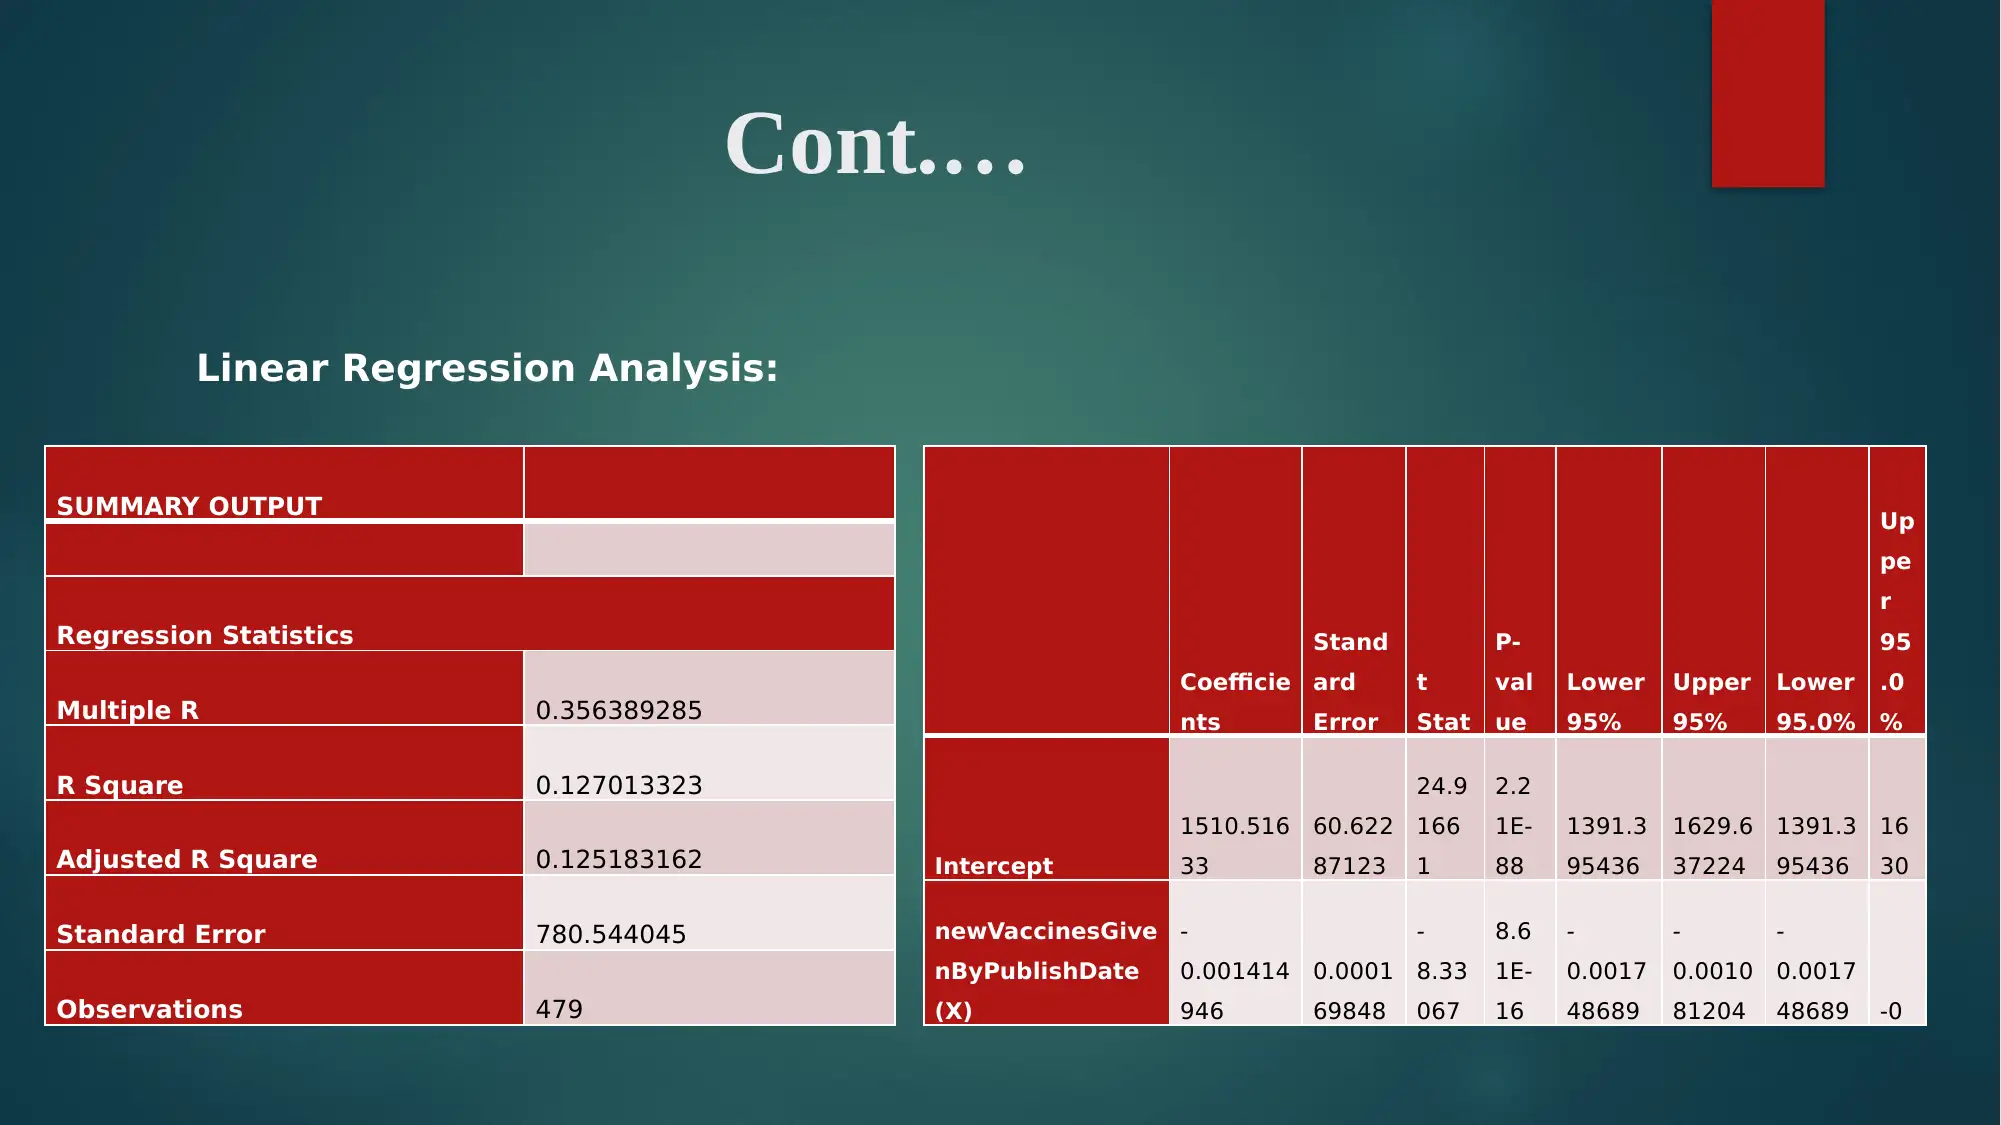
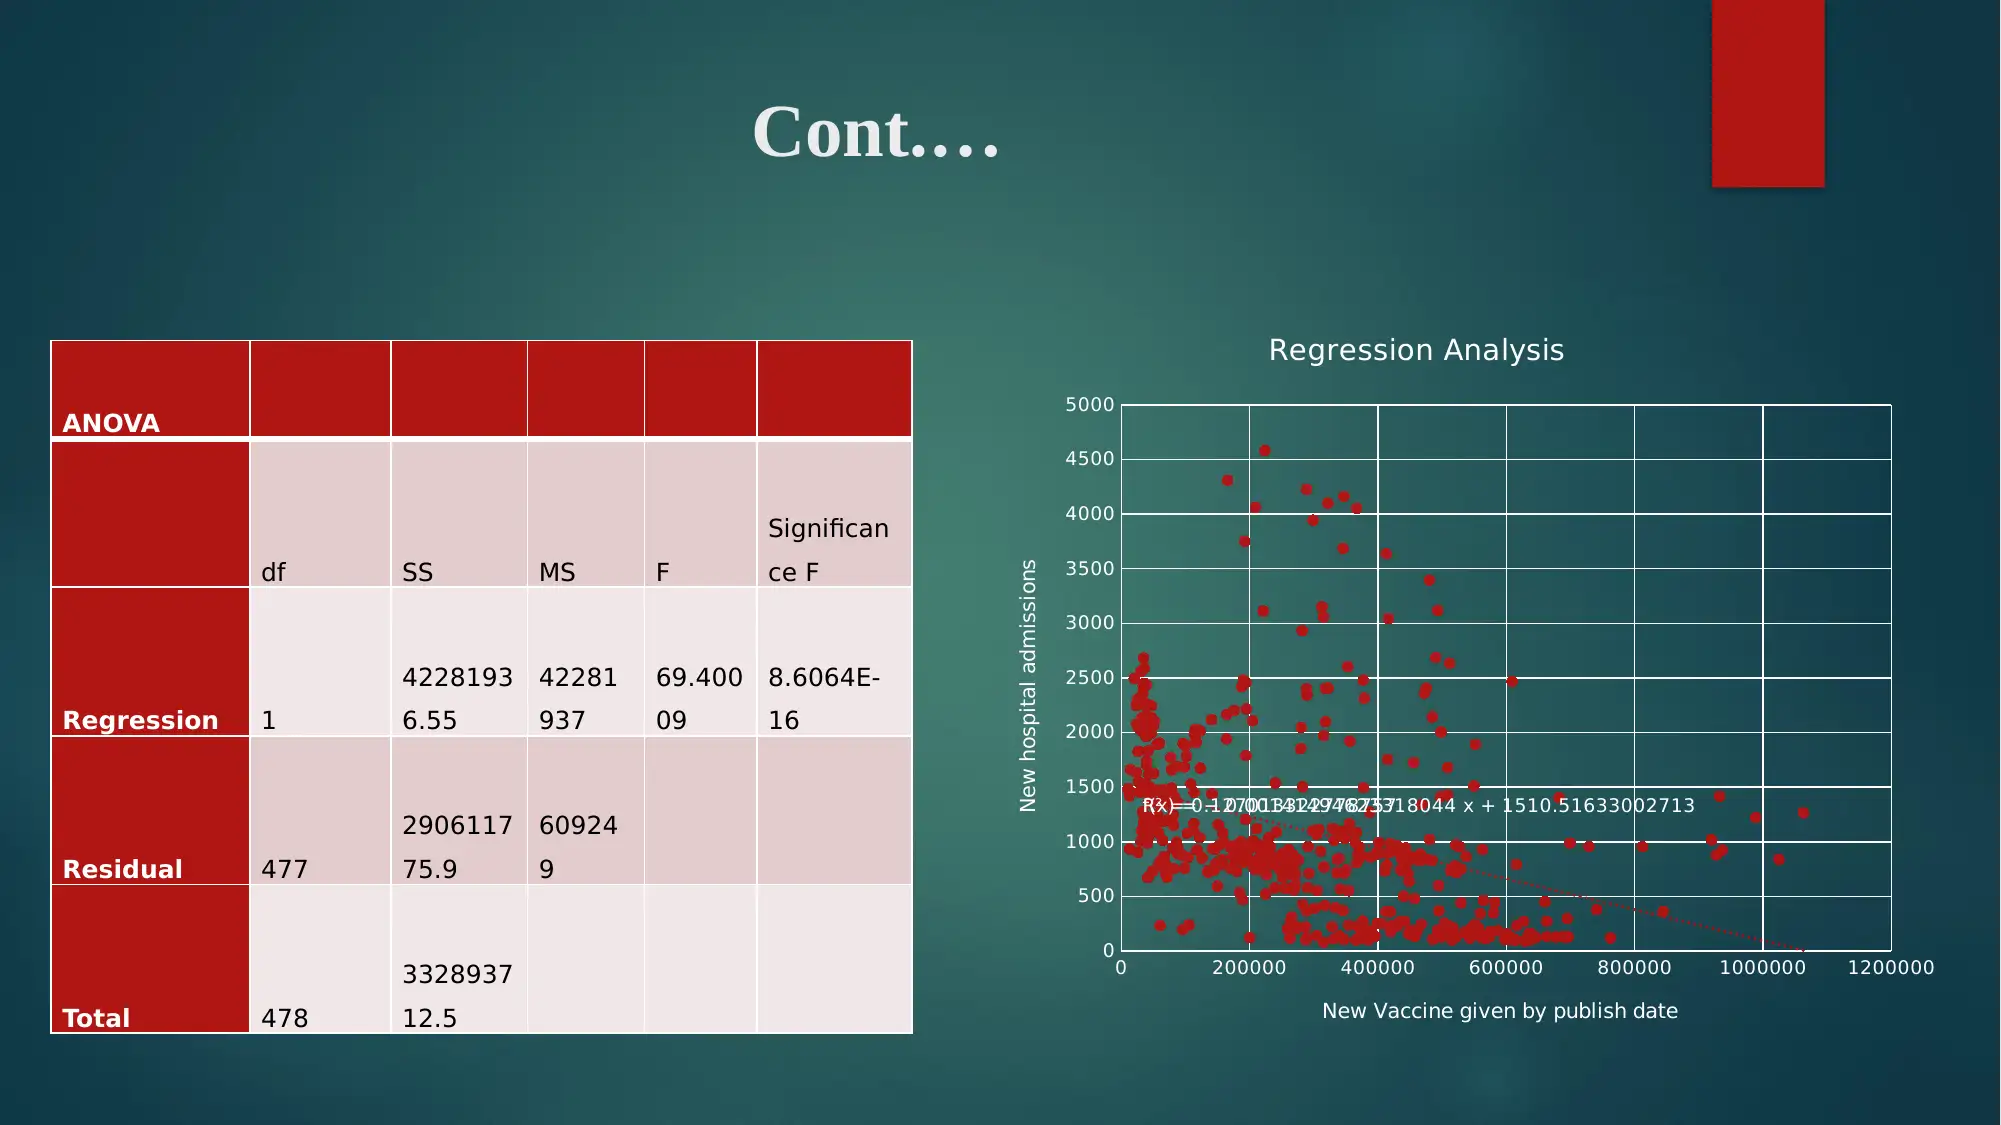
This report analyzes the relationship between new vaccine doses administered and new hospital admissions in the UK from January 2020 to May 2022. Quantitative data from official sources like the Office for National Statistics and Gov.UK were analyzed using scatter diagrams, linear correlation, and regression analysis. The analysis concludes a negative correlation but no statistically significant relationship between the two variables. The report also reflects on group work dynamics, highlighting challenges in coordination and communication. It emphasizes the importance of reliable data sources and appropriate statistical tools for healthcare data analysis. Desklib provides access to similar solved assignments and resources for students.

DATA ANALYSIS TOOLS
AND APPLICATION
AND APPLICATION
Secure Best Marks with AI Grader
Need help grading? Try our AI Grader for instant feedback on your assignments.

Table of content
Introduction
Aim and objectives
Contribution to the project methodology
Data collection
Appropriateness of data
Data analysis
Appropriateness of method of presenting and visualizing the data
Conclusion drawn from above analysis
Functioning of group and working differently in future.
Reflection on group activities
Conclusion
References

INTRODUCTION
Data analysis is a process of inspecting, cleansing, transforming and modelling the raw
data in useful and meaningful information with the aim of supporting the decision making.
The present report will be based on healthcare domain which involve the analysis of
whether there is any significant relationship exist between the new vaccine given by
publish date and new hospitals admissions (Shrestha and Basnet, 2018).
This will be done with the use of three main data analysis tools such as scattered diagram,
linear correlation and regression analysis.

AIM AND OBJECTIVES
Project Aim
The aim of current project is to analyses “Is there any significant relationship exist between
new vaccine given by publish date and number of new hospitals admissions in UK”.
Project Objectives
To understand the concept and importance of healthcare in the UK.
To evaluate the movement and correlation between the new vaccine doses and new hospital
admissions with the use of scattered diagram and linear correlation.
To analyses whether there is a significant relationship exist between the new vaccine doses
(X) and new hospital admission (Y) variable.
To identify challenges that can be arises for UK hospitals due to rise in new admission rates
during Covid-19 with effective strategies recommendation (Puniya and Singh, 2019).
Secure Best Marks with AI Grader
Need help grading? Try our AI Grader for instant feedback on your assignments.

CONTRIBUTION TO THE PROJECT OR
METHODOLOGY
This project is based on the analysis of whether there any relationship exists between the
new vaccine given and new hospital admissions in UK.
For the present study, the quantitative secondary data regarding the new vaccine given by
publish date and new hospital admissions of UK from the period 10th January 2020 to 4th
May, 2022 is gathered.
In order to enhance the reliability of result, the most accurate and resent data has been
gathered and also analyzed in the report.

DATA COLLECTION
The data regarding the new vaccines given and new hospital admission is collected from
the authentic source i.e., Office National Statistics and Gov.UK coronavirus in the UK.
The data available on this sites are authentic and relevant.
Further, the data is also collected from the secondary sources such as websites, articles,
books, journals etc.

APPROPRIATENESS OF DATA
The appropriateness of the data mostly depends on the sources from where such data is
collected.
Hence, with the aim of enchasing the reliability of data, it is collected from Gov.UK
website which is basically operated by UK government.
The data regarding the two variable such as new vaccine given and new hospital admission
is collected from this website for 479 days.
This website is one of the authorized website that is managed by the government of UK
(Bolshakova and et.al., 2021).
The data of 479 days is appropriate for analyzing whether there is any relationship exist
between new vaccine given and new hospital admissions.
Paraphrase This Document
Need a fresh take? Get an instant paraphrase of this document with our AI Paraphraser

DATA ANALYSIS
In order to analyze the quantitative secondary data of present study and convey its
meaningful information, the quantitative tools such as scattered diagram, linear correlation
and liner regression has been used.
Scattered Diagram:
0 200000 400000 600000 800000 1000000 1200000
0
500
1000
1500
2000
2500
3000
3500
4000
4500
5000
Scattered Diagram
New Vaccines given by publish date
New Hospital Admissions

Cont.…
Linear Correlation Analysis:
Correlation Coefficient
newVaccinesGivenByP
ublishDate (X)
newHospitalAd
missions (Y)
newVaccinesGivenByP
ublishDate (X) 1
newHospitalAdmission
s (Y) -0.356389285 1
Linear Correlation Analysis:
Correlation Coefficient
newVaccinesGivenByP
ublishDate (X)
newHospitalAd
missions (Y)
newVaccinesGivenByP
ublishDate (X) 1
newHospitalAdmission
s (Y) -0.356389285 1

Cont.…
Linear Regression Analysis:
SUMMARY OUTPUT
Regression Statistics
Multiple R 0.356389285
R Square 0.127013323
Adjusted R Square 0.125183162
Standard Error 780.544045
Observations 479
Coefficie
nts
Stand
ard
Error
t
Stat
P-
val
ue
Lower
95%
Upper
95%
Lower
95.0%
Up
pe
r
95
.0
%
Intercept
1510.516
33
60.622
87123
24.9
166
1
2.2
1E-
88
1391.3
95436
1629.6
37224
1391.3
95436
16
30
newVaccinesGive
nByPublishDate
(X)
-
0.001414
946
0.0001
69848
-
8.33
067
8.6
1E-
16
-
0.0017
48689
-
0.0010
81204
-
0.0017
48689 -0
Secure Best Marks with AI Grader
Need help grading? Try our AI Grader for instant feedback on your assignments.

Cont.…
ANOVA
df SS MS F
Significan
ce F
Regression 1
4228193
6.55
42281
937
69.400
09
8.6064E-
16
Residual 477
2906117
75.9
60924
9
Total 478
3328937
12.5
0 200000 400000 600000 800000 1000000 1200000
0
500
1000
1500
2000
2500
3000
3500
4000
4500
5000
f(x) = − 0.00141494623318044 x + 1510.51633002713R² = 0.127013322778757
Regression Analysis
New Vaccine given by publish date
New hospital admissions

APPROPRIATENESS OF METHOD OF
PRESENTING AND VISUALIZING THE DATA
In the present study, the data is being present and visualize using the three most significant
quantitative data analysis tools.
This includes linear correlation, regression and scattered diagram. The linear correlation is
one of the best tool to analyses the positive, negative or no correlation between the two
variable.
On the other hand, the linear regression analysis tool is best for identifying whether there is
significant relationship exist between the dependent and independent variable (Perry and
et.al., 2021).
The scattered diagram is also one of best method to present or visualize the data in
graphical manner and interpret the result of relationship between the two variable.

CONCLUSION DRAWN FROM ABOVE
ANALYSIS
On the basis of above analysis, it has been concluded that there is perfectly negative
correlation between the two variable such as new vaccines and new hospital admission as
per the scattered diagram and correlation coefficient result.
Further, it has been also concluded from the regression analysis, that there is no significant
relationship exist between the new vaccine and new hospital admission because of the
significant f value of 8.6064E-16.
The dependent variable is taken for current study is new vaccine given by publish date and
the independent variable is new hospital admissions (O’Dowd, 2021).
Paraphrase This Document
Need a fresh take? Get an instant paraphrase of this document with our AI Paraphraser

FUNCTIONING OF GROUP AND
WORKING DIFFERENTLY IN FUTURE
While functioning or working in a group, the expectation is always set at higher level as
compared to working individually.
It is because in group working, the ideas from different people come together which leads
to the achievement of target more easily and quickly.
The team working is one of the major and most significant skills helps in completing the
work and achieving the result.
The project which are carried out under group are highly valuable as well as rewarding
which is not possible in individual work.

REFLECTION ON GROUP ACTIVITIES
During the group project, I face lack of coordination as a biggest issue from the other group
members.
I have personally realized that group work consumes more time to coordinate schedules, arrange
meetings, meet and make decision collectively.
The impact of which coming up in a particular decision is because complex and time consuming.
Being a group member, I can’t able to eliminate the coordination cost as it is one of the most
significant skills that have to be present in group members.
Along with the poor coordination skill, I also faced issue in communicating with the other group
member because of mu poor communication skill.

CONCLUSION
After summing up the above information, it has been concluded that there is no significant
relationship exist between the new vaccine and new hospital admission on the basis of regression
analysis.
Further, the report has also concluded the data has been collected from Gov.UK which is operated
by government of UK and is one of the authentic and appropriate source of data collection.
In addition, the report has also stated the appropriateness of regression and correlation data
analysis tools.
Lastly, the report has concluded the skills need to be developed in order to work differently in
future.
Secure Best Marks with AI Grader
Need help grading? Try our AI Grader for instant feedback on your assignments.

REFERENCES
Books and Journals
Shrestha, A. K. and Basnet, N., 2018. The correlation and regression analysis of
physicochemical parameters of river water for the evaluation of percentage contribution to
electrical conductivity. Journal of Chemistry, 2018.
Puniya, M. and Singh, R. B., 2019. Correlation and Regression Analysis.
Welchowski, T., Zuber, V. and Schmid, M., 2019. Correlation‐adjusted regression survival
scores for high‐dimensional variable selection. Statistics in medicine. 38(13). pp.2413-
2427.
Bolshakova, L. V. and et.al., 2021. Correlation and Regression Analysis of Economic
Problems. REVISTA GEINTEC-GESTAO INOVACAO E TECNOLOGIAS. 11(3).
pp.2077-2088.
Le, T. D. and et.al., 2020. Application of correlation and regression analysis between GPS-
RTK and environmental data in processing the monitoring data of cable-stayed
bridge. Journal of Mining and Earth Sciences Vol. 61(6). pp.59-72.

THANK YOU
1 out of 18
Related Documents

Your All-in-One AI-Powered Toolkit for Academic Success.
+13062052269
info@desklib.com
Available 24*7 on WhatsApp / Email
Unlock your academic potential
© 2024 | Zucol Services PVT LTD | All rights reserved.