Statistical Analysis of Employee Satisfaction at Valero Energy: Report

Verified

Added on  2021/12/09

|12
|1573
|64
Report
AI Summary
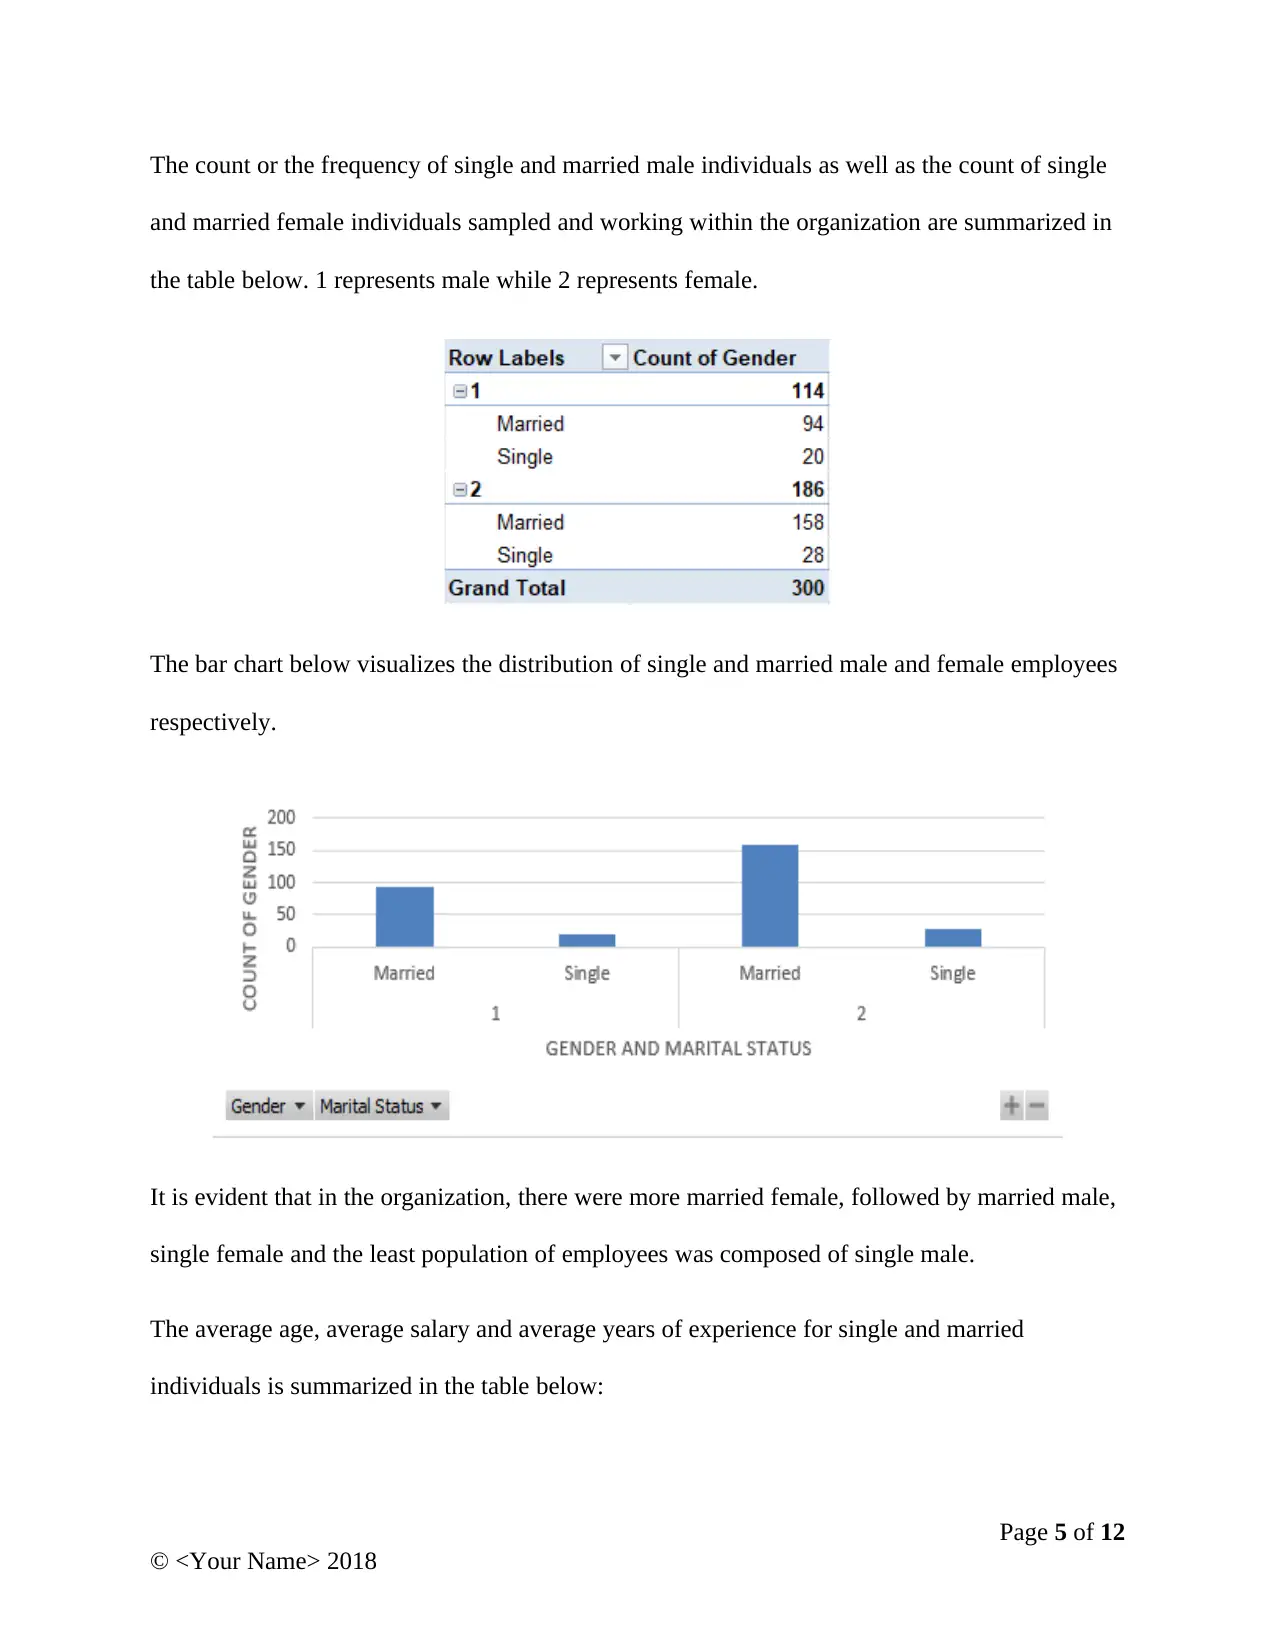
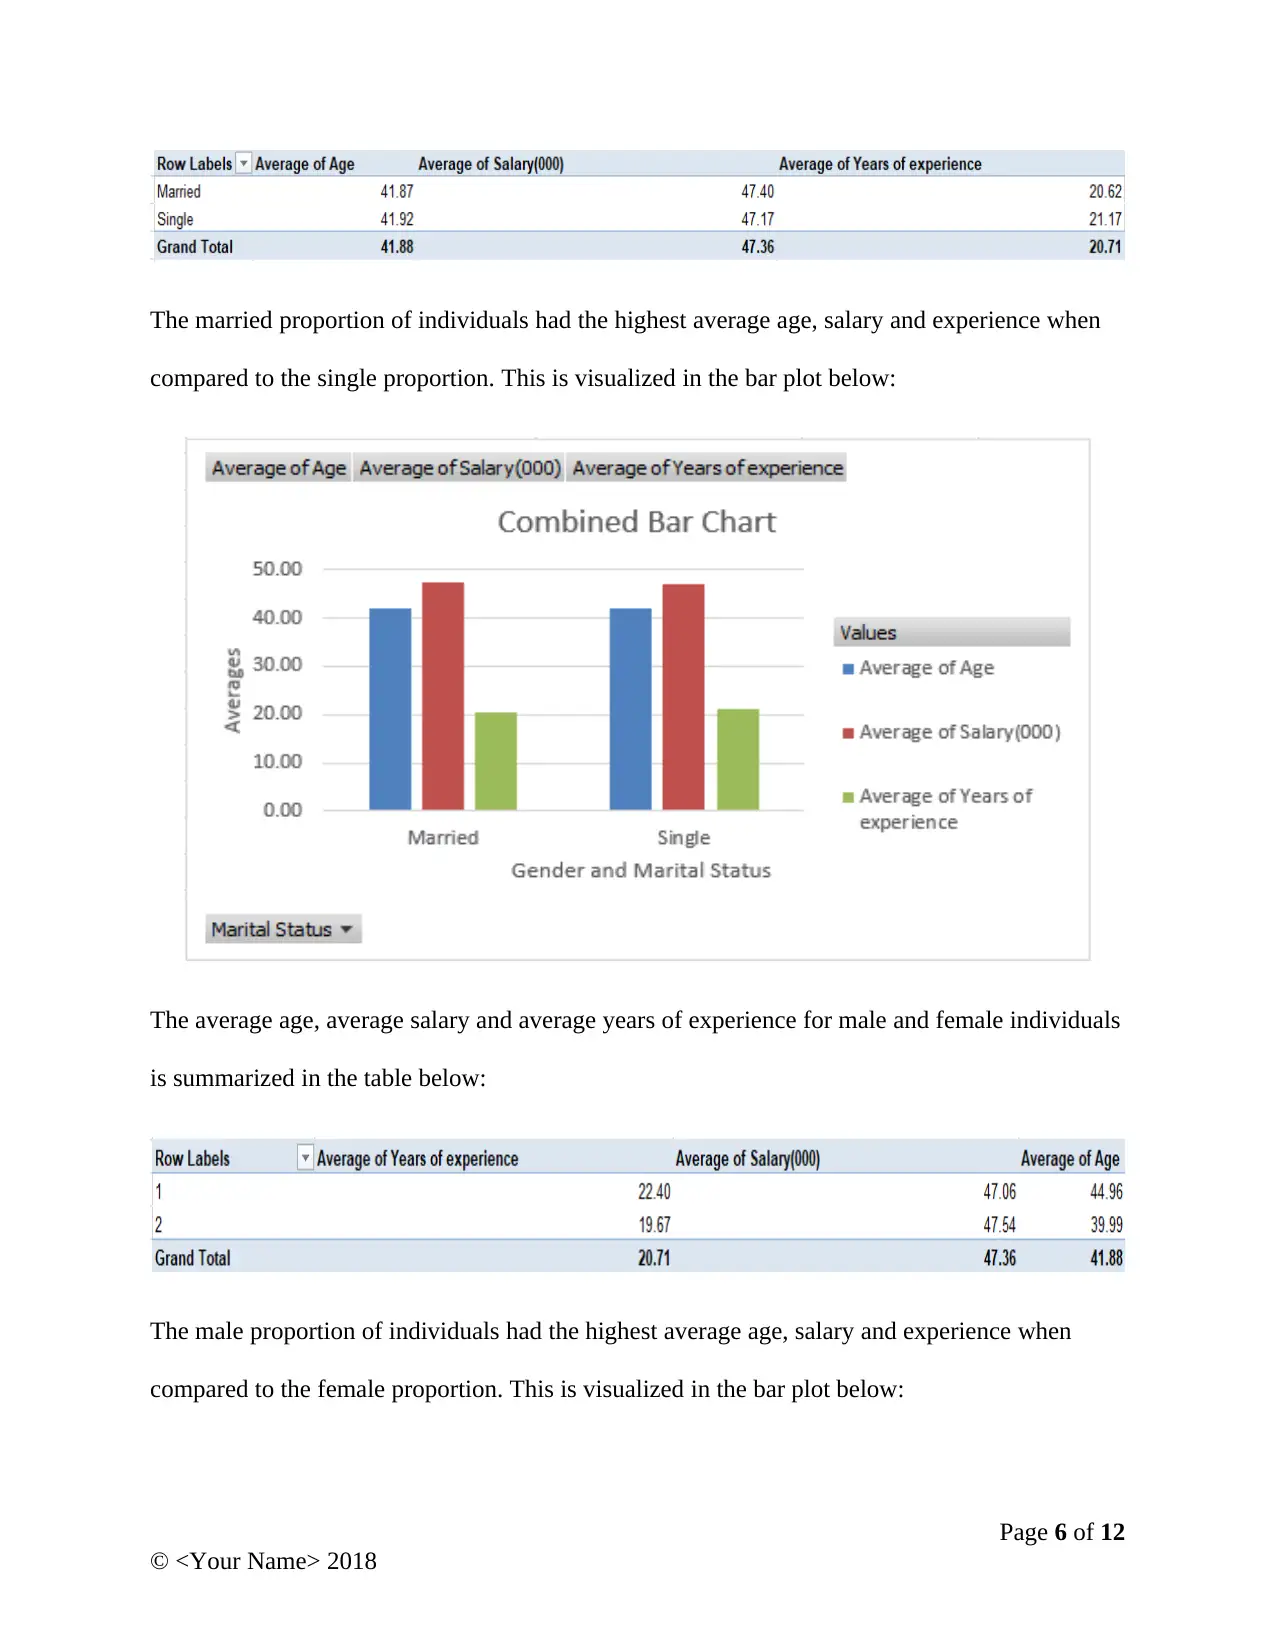
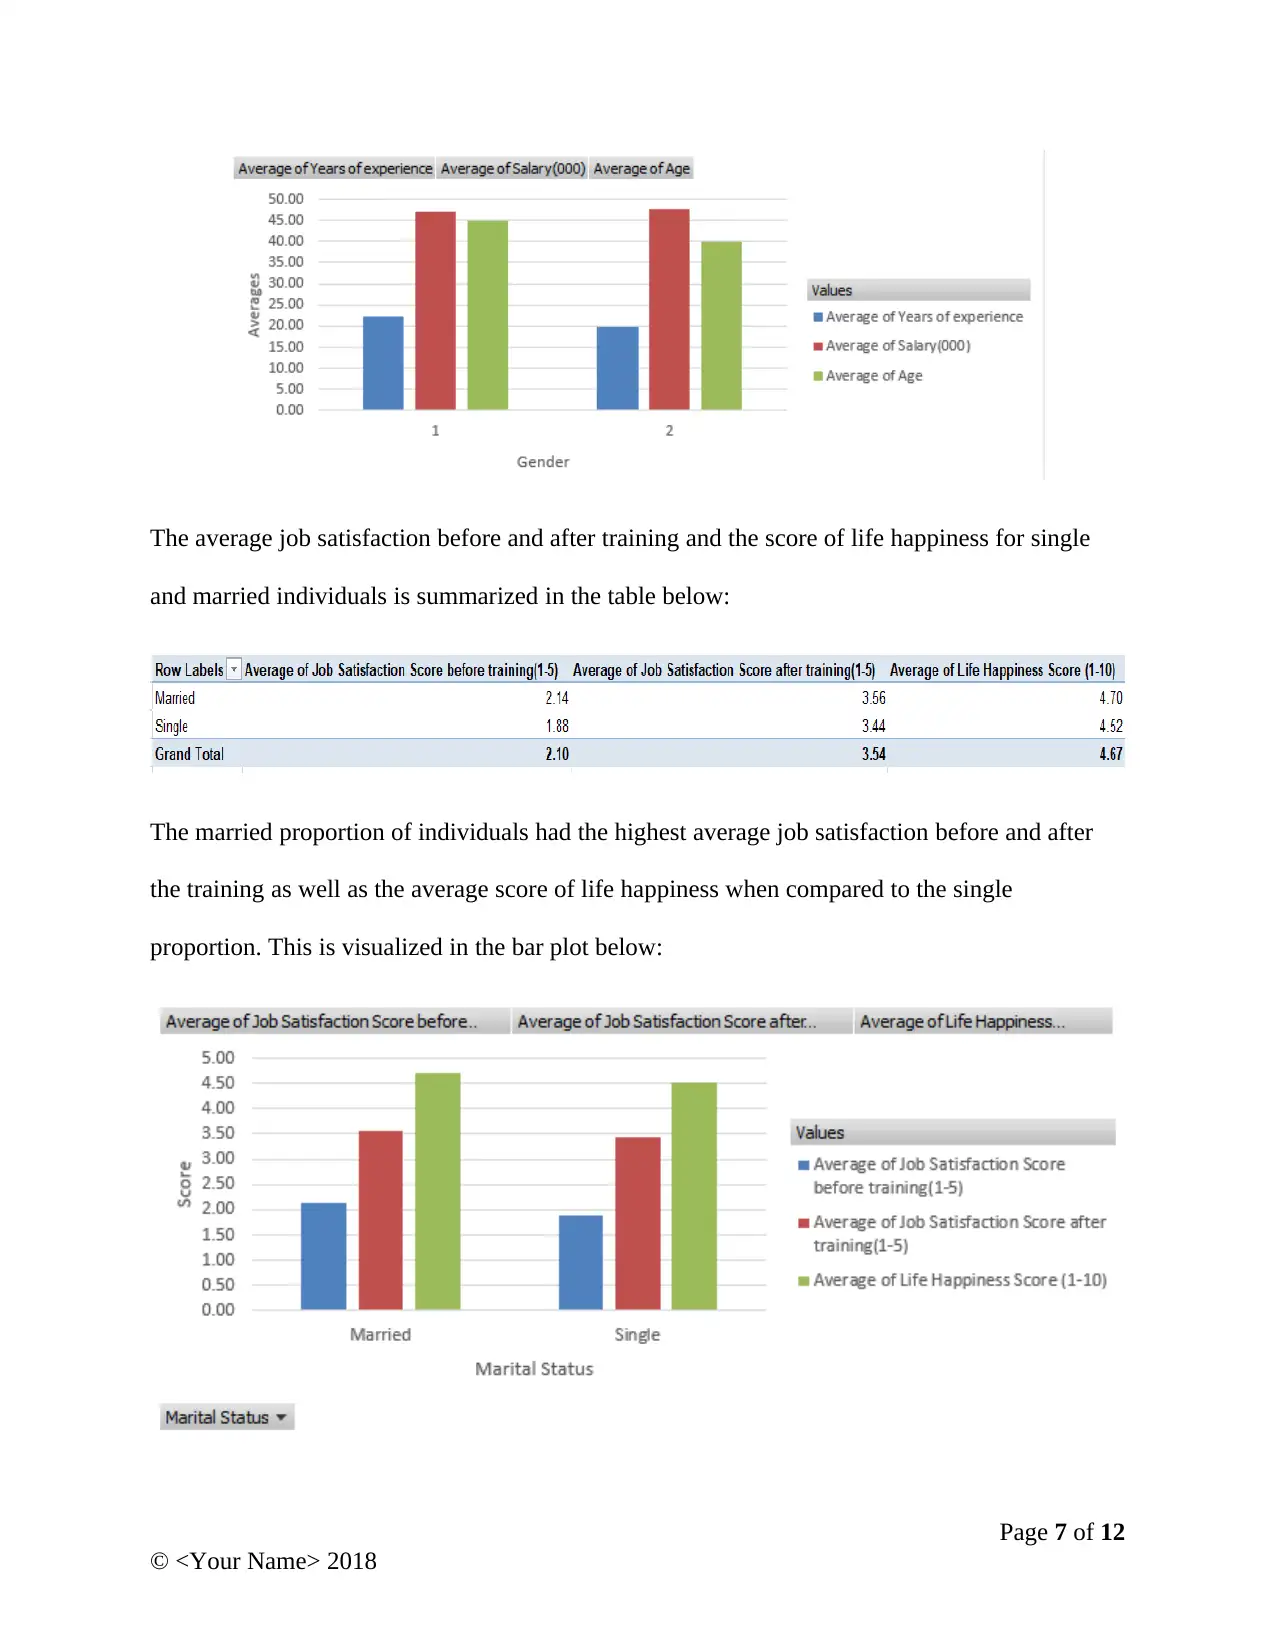
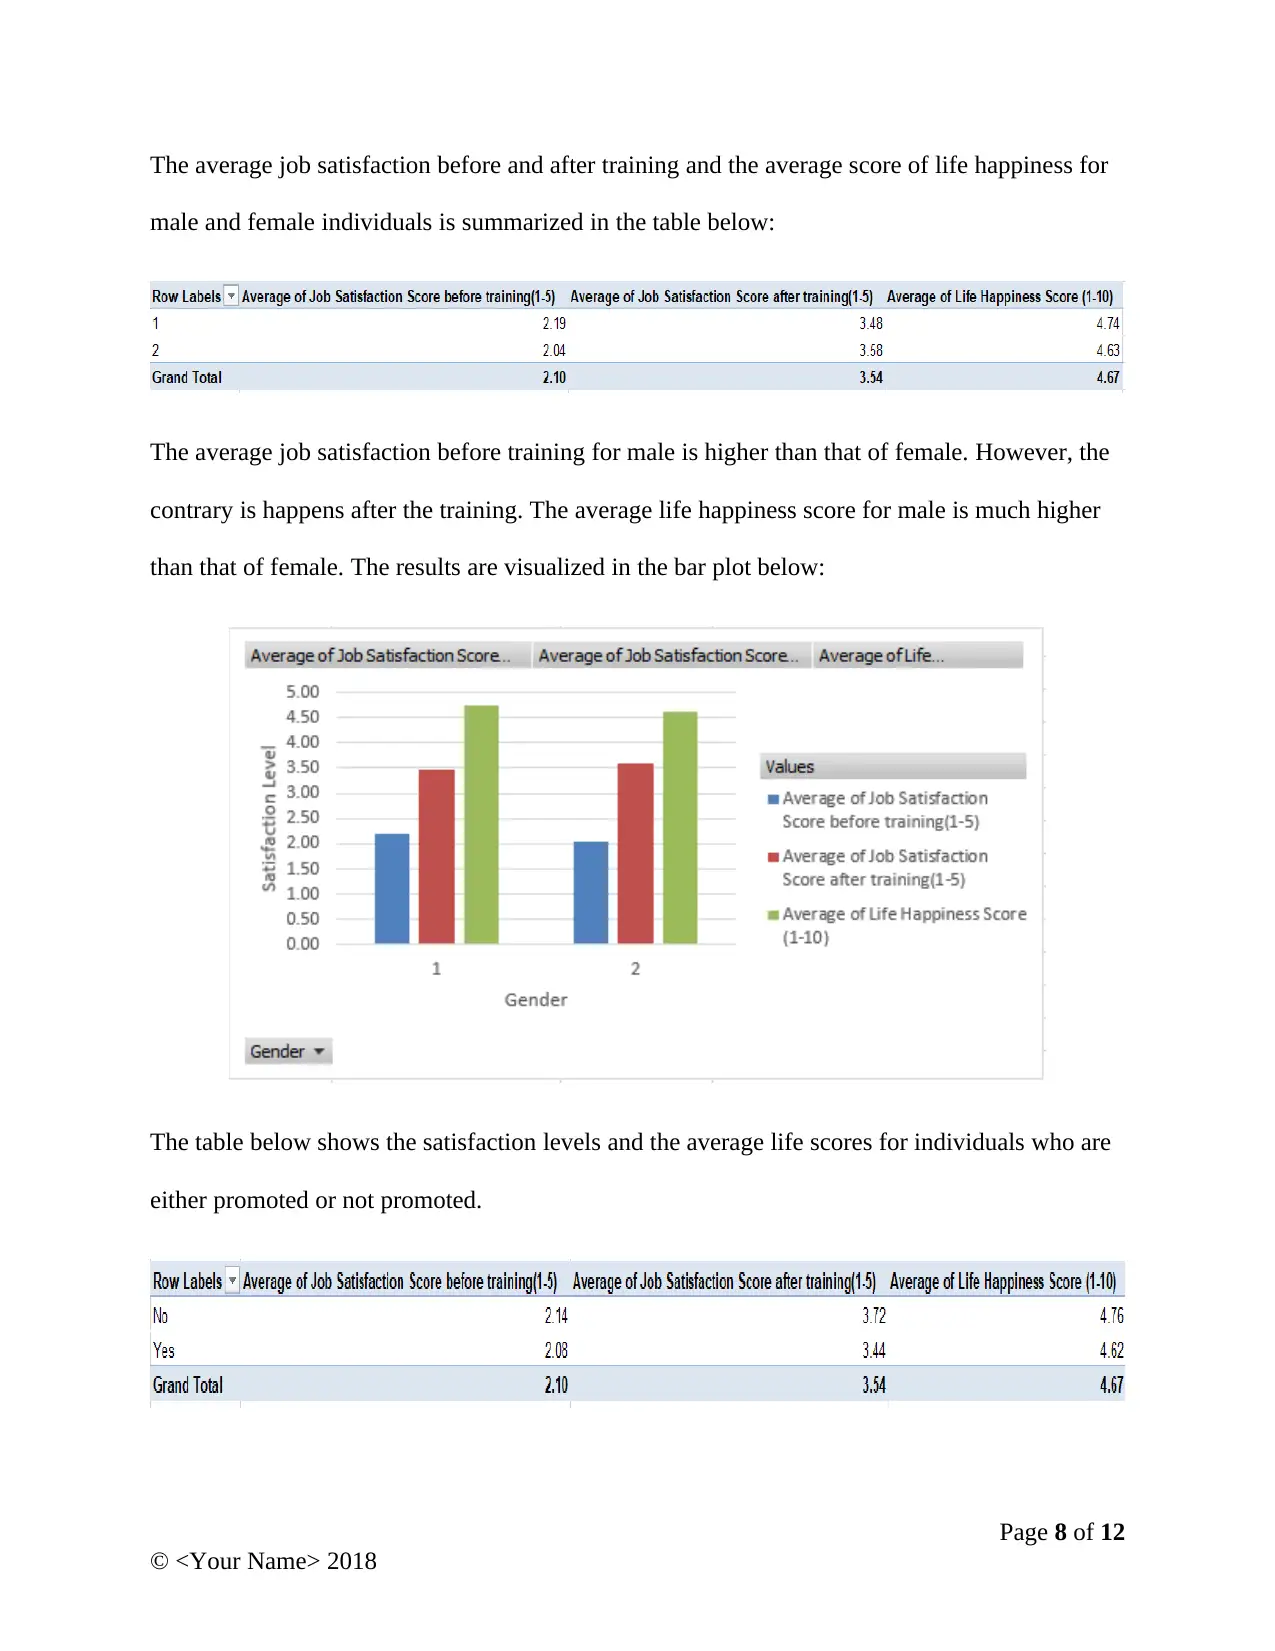
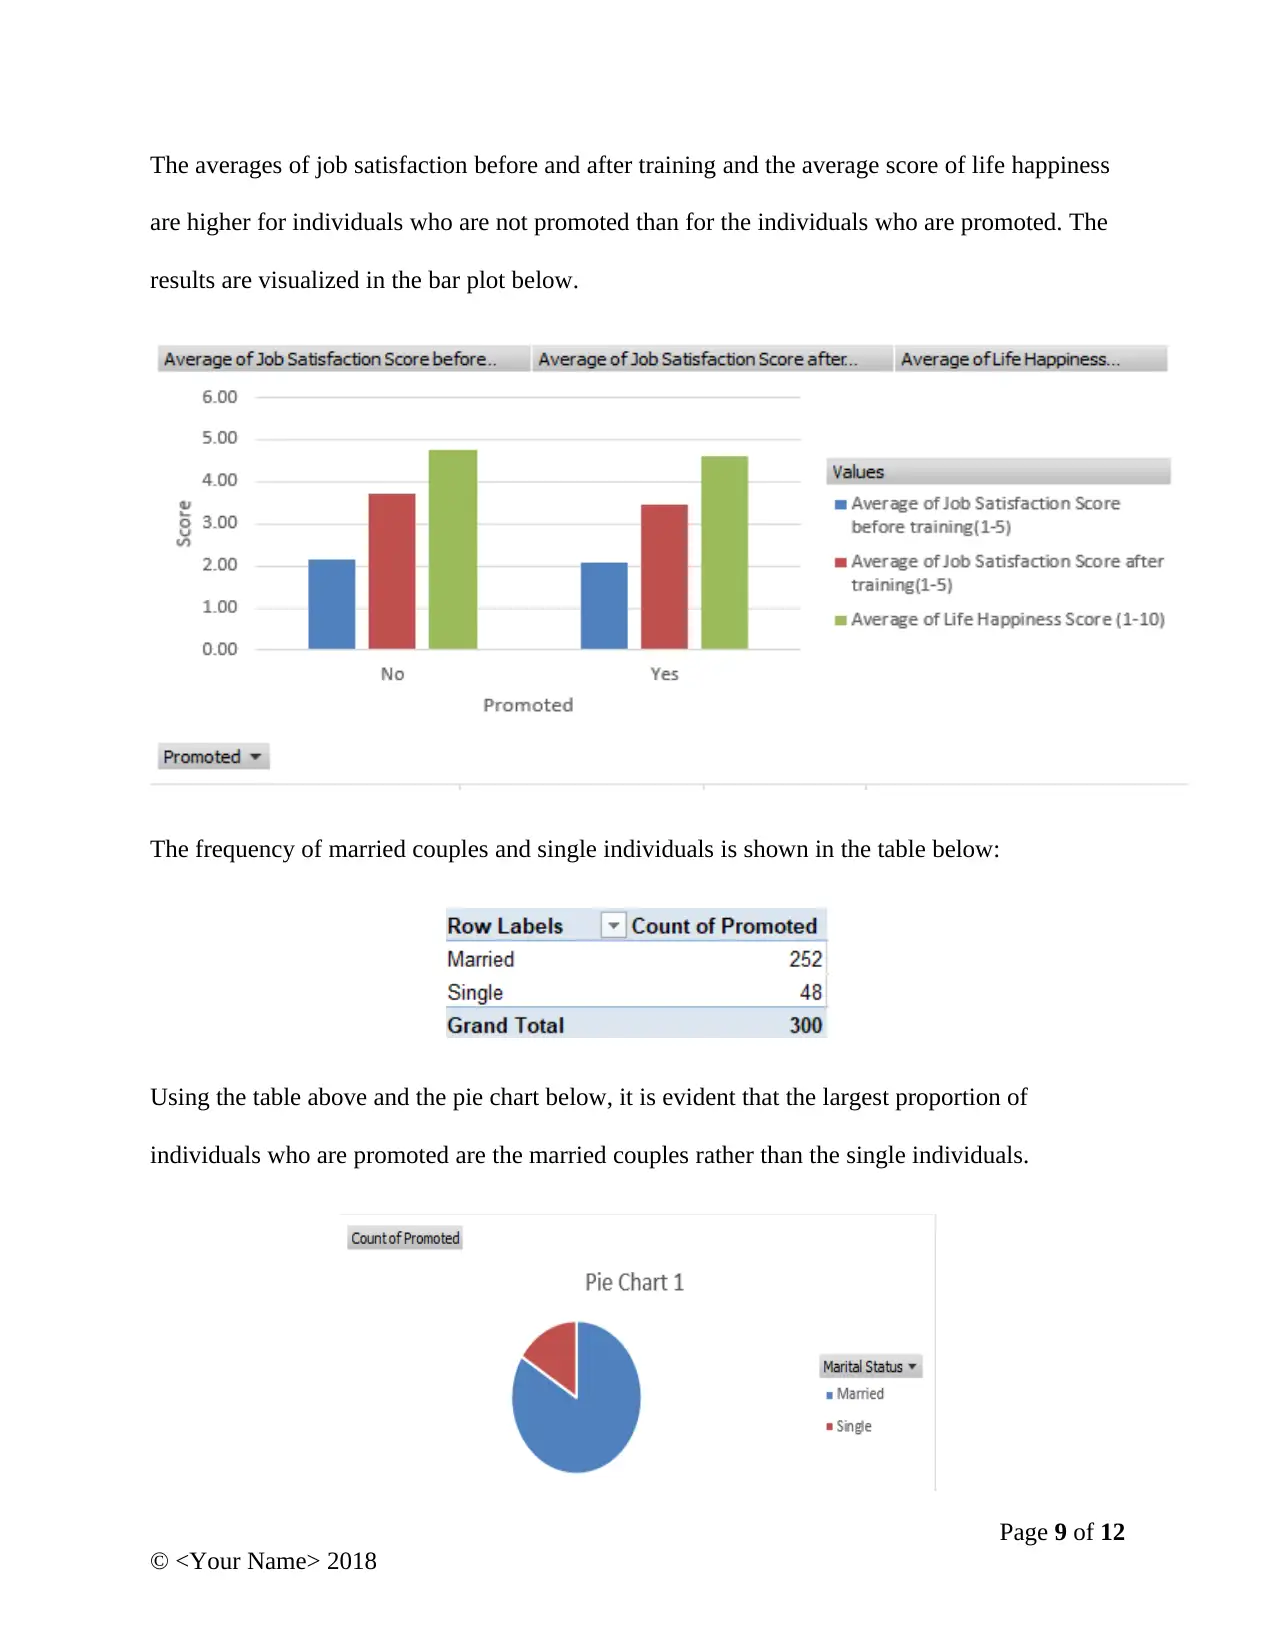
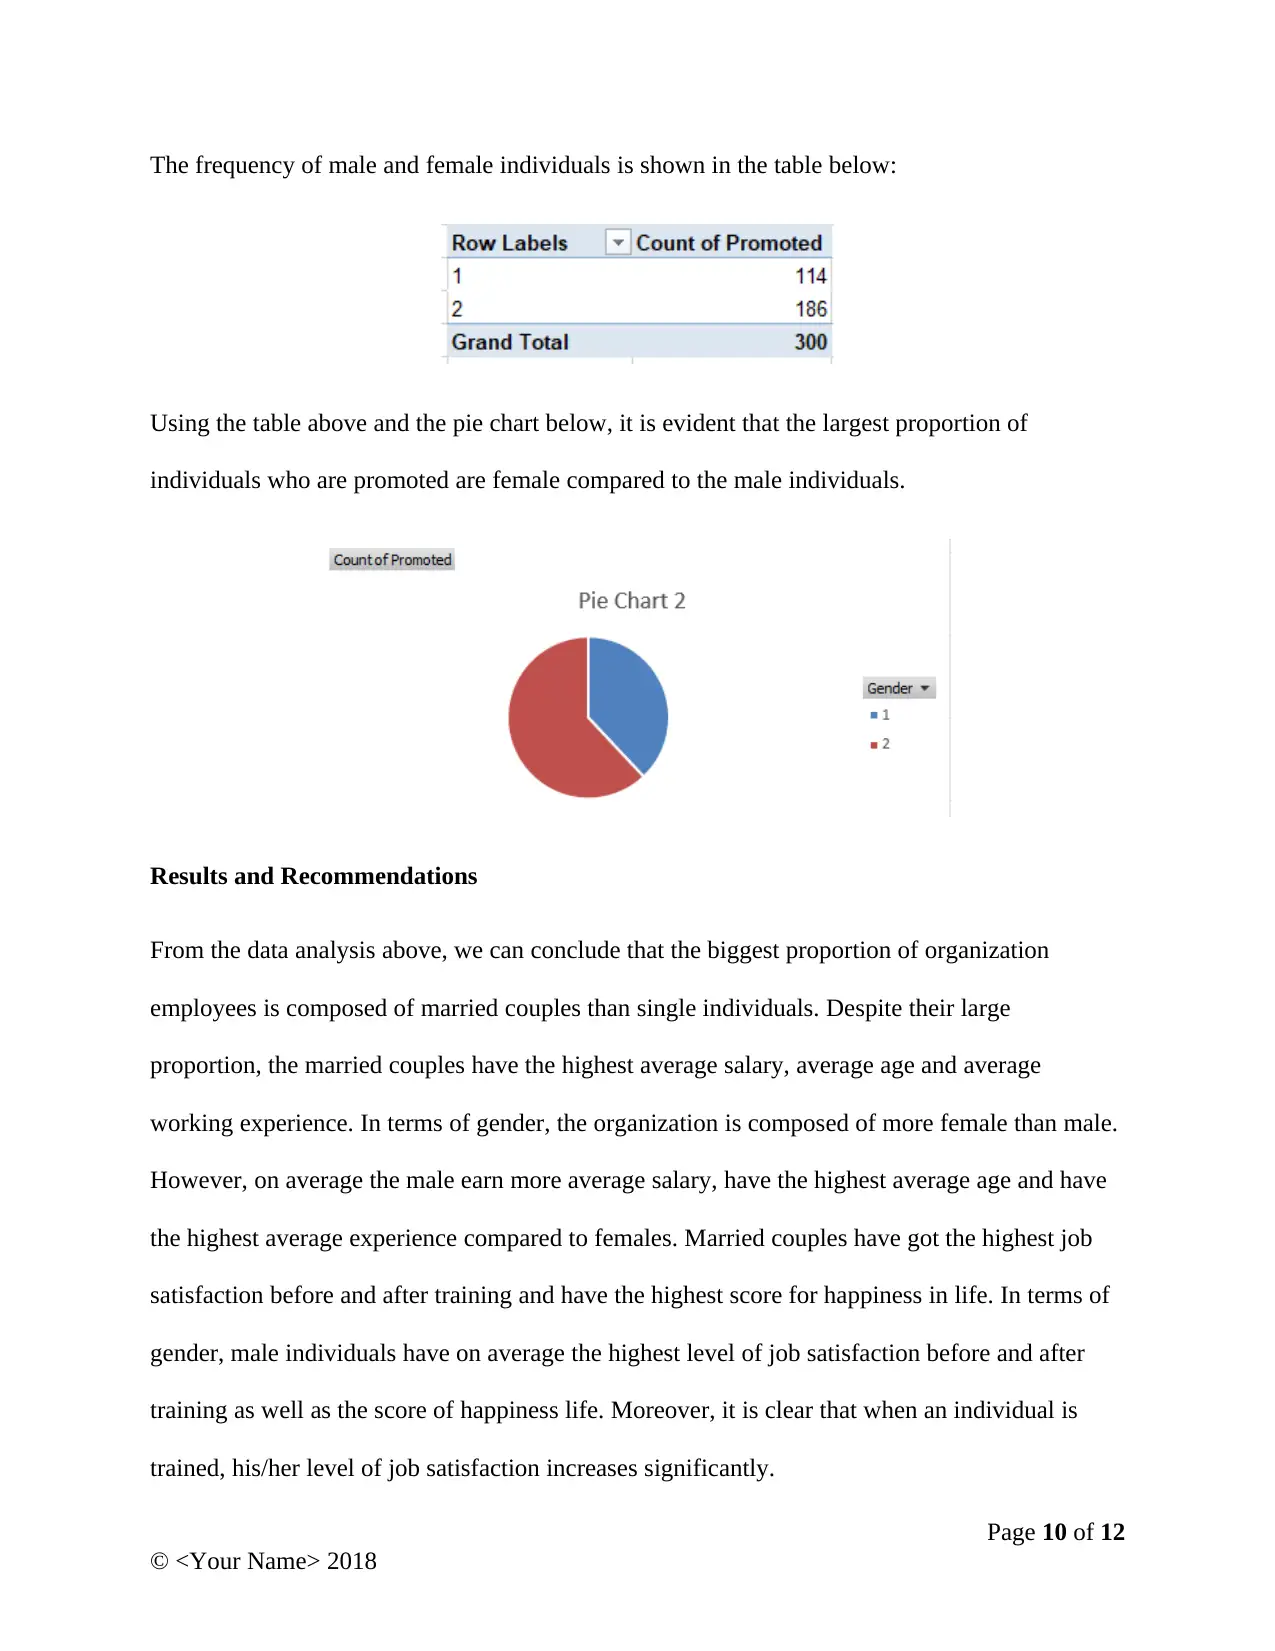
This report presents a statistical analysis of employee job satisfaction at Valero Energy Corporation. The study utilizes data collected from a survey of 300 employees, examining variables such as age, gender, marital status, salary, and training to determine their impact on job satisfaction. The analysis employs descriptive statistics, including measures of central location (mean, median, mode) and measures of variation (range, standard deviation, variance), to identify trends and patterns. The findings are presented through tables, graphs, and pie charts, illustrating the relationships between various factors and employee satisfaction levels before and after training. The report concludes with recommendations for Valero Energy, suggesting strategies to address identified issues, such as employee demographics, training, and promotion practices, to improve overall employee satisfaction and organizational performance.
tabler-icon-diamond-filled.svg

Contribute Materials

Your contribution can guide someone’s learning journey. Share your documents today.
Document Page
University
Business Statistics
By
Your Name
Date
Page 1 of 12
© <Your Name> 2018
tabler-icon-diamond-filled.svg

Secure Best Marks with AI Grader

Need help grading? Try our AI Grader for instant feedback on your assignments.
Document Page
Introduction
Organization Description
Valero Energy Corporation is a global manufacturer and market leader of transportation fuels
and other petroleum products. It is an independent petroleum refiner and producer of ethanol.
The headquarter of the organization is based in San Antonio, Texas and is served by a population
of approximately ten thousand employees. The refinery plants are situated in the United States,
Canada and United Kingdom while the ethanol plants are situated in the mid-continent region of
the United States.
Problem Definition and Analysis Method
Over the recent couple of months, Valero Energy has been faced by a major problem of
deterioration among its employees. The deterioration is depicted by the low profit margins
achieved by the organization, continued absenteeism among employees, high rate of resignation
and inability of available workers to meet set deadlines and hence the company’s objectives. To
determine the root cause and reach an amicable solution for the same, the human resource officer
decided to conduct a survey to identify the satisfaction levels of the employees. Three hundred
employees of the company were interviewed and their job satisfaction level measured before and
after training.
The data is analyzed using statistical measures such as measures of central location (Mean,
median, mode) and measures of variation (range, standard deviation, variance) to determine how
factors such as age, gender, training and salary among others affect employees of job satisfaction
(Hinton, 2014). To develop a better, detailed and insightful analysis, the results obtained from
the data analysis are presented using tables, graphs and pie-charts (Evans and Basu, 2013).
Page 2 of 12
© <Your Name> 2018
Document Page
Data Description
The data was collected from a sample of three hundred employees working globally for the
organization. The data consists of thirteen variables each of which plays a crucial role in
describing the employees job satisfaction. The table below shows the variables, their data types
and levels of measurement.
Variable Data Type Level of Measurement
ID Discrete Numeric Nominal
Gender Discrete Numeric (1 male, 2
female)
Nominal
Marital Status Categorical Nominal
Age Numeric Interval
Years of Experience Numeric Interval
City Area Discrete Numeric Nominal
Region Categorical Nominal
Department Discrete Numeric Nominal
Salary Continuous numeric Ratio
Job satisfaction before and after
training
Discrete Numeric Ordinal
Life Happiness Discrete Numeric Ordinal
Promoted Categorical Nominal
Descriptive Statistics
Page 3 of 12
© <Your Name> 2018
Document Page
Measures of Location
This are single values that describe data sets by identifying the central position. They are the
arithmetic mean, median and the mode (Foster, Barkus and Yavorsky, 2006). The measures of
location can only be applied to numeric variables. In the dataset provided, they are applied to the
variables; age, years of experience, salary, job satisfaction and life happiness score. The table
below presents the measures of central tendency for the various numeric variables within the
dataset.
Measures of Variation
Measures of variation describe the spread or variation of the distribution, the commonly used
measures of variation are range, quartiles, variance and standard deviation (Freund, 2014).
Measures of variation are also determined for the numeric variables in the dataset. The table
below summarizes the measures of variation for the numeric variables in the dataset.
Data Summarizing and Presentation
Page 4 of 12
© <Your Name> 2018
tabler-icon-diamond-filled.svg

Secure Best Marks with AI Grader

Need help grading? Try our AI Grader for instant feedback on your assignments.
Document Page
The count or the frequency of single and married male individuals as well as the count of single
and married female individuals sampled and working within the organization are summarized in
the table below. 1 represents male while 2 represents female.
The bar chart below visualizes the distribution of single and married male and female employees
respectively.
It is evident that in the organization, there were more married female, followed by married male,
single female and the least population of employees was composed of single male.
The average age, average salary and average years of experience for single and married
individuals is summarized in the table below:
Page 5 of 12
© <Your Name> 2018
Document Page
The married proportion of individuals had the highest average age, salary and experience when
compared to the single proportion. This is visualized in the bar plot below:
The average age, average salary and average years of experience for male and female individuals
is summarized in the table below:
The male proportion of individuals had the highest average age, salary and experience when
compared to the female proportion. This is visualized in the bar plot below:
Page 6 of 12
© <Your Name> 2018
Document Page
The average job satisfaction before and after training and the score of life happiness for single
and married individuals is summarized in the table below:
The married proportion of individuals had the highest average job satisfaction before and after
the training as well as the average score of life happiness when compared to the single
proportion. This is visualized in the bar plot below:
Page 7 of 12
© <Your Name> 2018
tabler-icon-diamond-filled.svg

Paraphrase This Document

Need a fresh take? Get an instant paraphrase of this document with our AI Paraphraser
Document Page
The average job satisfaction before and after training and the average score of life happiness for
male and female individuals is summarized in the table below:
The average job satisfaction before training for male is higher than that of female. However, the
contrary is happens after the training. The average life happiness score for male is much higher
than that of female. The results are visualized in the bar plot below:
The table below shows the satisfaction levels and the average life scores for individuals who are
either promoted or not promoted.
Page 8 of 12
© <Your Name> 2018
Document Page
The averages of job satisfaction before and after training and the average score of life happiness
are higher for individuals who are not promoted than for the individuals who are promoted. The
results are visualized in the bar plot below.
The frequency of married couples and single individuals is shown in the table below:
Using the table above and the pie chart below, it is evident that the largest proportion of
individuals who are promoted are the married couples rather than the single individuals.
Page 9 of 12
© <Your Name> 2018
Document Page
The frequency of male and female individuals is shown in the table below:
Using the table above and the pie chart below, it is evident that the largest proportion of
individuals who are promoted are female compared to the male individuals.
Results and Recommendations
From the data analysis above, we can conclude that the biggest proportion of organization
employees is composed of married couples than single individuals. Despite their large
proportion, the married couples have the highest average salary, average age and average
working experience. In terms of gender, the organization is composed of more female than male.
However, on average the male earn more average salary, have the highest average age and have
the highest average experience compared to females. Married couples have got the highest job
satisfaction before and after training and have the highest score for happiness in life. In terms of
gender, male individuals have on average the highest level of job satisfaction before and after
training as well as the score of happiness life. Moreover, it is clear that when an individual is
trained, his/her level of job satisfaction increases significantly.
Page 10 of 12
© <Your Name> 2018
tabler-icon-diamond-filled.svg

Secure Best Marks with AI Grader

Need help grading? Try our AI Grader for instant feedback on your assignments.
Document Page
The root cause of the organization can therefore be attributed to its hiring of high number of
married couples and paying them more than the single individuals. Despite their high average
working experience, married couples are known of being committed in other aspects of life and
therefore lack concentration for work. Additionally, the high average age associated with this
highly hired proportion of individuals is a limiting factor to the organization ability to meet its
objectives since high or old age is associated with low productivity and vice versa. Another
cause of the organization’s deterioration in job is promotion; the organization promotes more
married couples than single individuals and more females than male. This lowers the enthusiasm
of the affected group of individuals leading to their inability to be passionate about their jobs.
To counter the impact of the above problems and therefore meet the organizations objects, the
organization can consider employing more single individuals with less “away from work”
responsibilities, hire more youthful population since they are energetic, train the employees so
that their levels of job satisfaction can be raised, devise mean to improve employees score of
happiness on life, and devise new methods of job promotions that promote equality and
transparency.
Page 11 of 12
© <Your Name> 2018
Document Page
References
Evans, J. R., and Basu, A. 2013. Statistics, data analysis, and decision modeling. 5th ed. Boston:
Pearson.
Foster, J. J., Barkus, E., and Yavorsky, C. 2006. Understanding and using advanced statistics.
2nd ed. London: SAGE.
Freund, J. E. 2014. Modern elementary statistics. 12th ed. Boston: Pearson.
Hinton, P. R. 2014. Statistics explained. 3rd ed. London: Routledge, Taylor & Francis Group.
Page 12 of 12
© <Your Name> 2018
chevron_up_icon
1 out of 12
circle_padding
hide_on_mobile
zoom_out_icon
logo.png

Your All-in-One AI-Powered Toolkit for Academic Success.

Available 24*7 on WhatsApp / Email

[object Object]