Comprehensive Financial Valuation of The Sherwin-Williams Company

Verified

Added on  2019/09/20

|23
|3413
|316
Homework Assignment
AI Summary
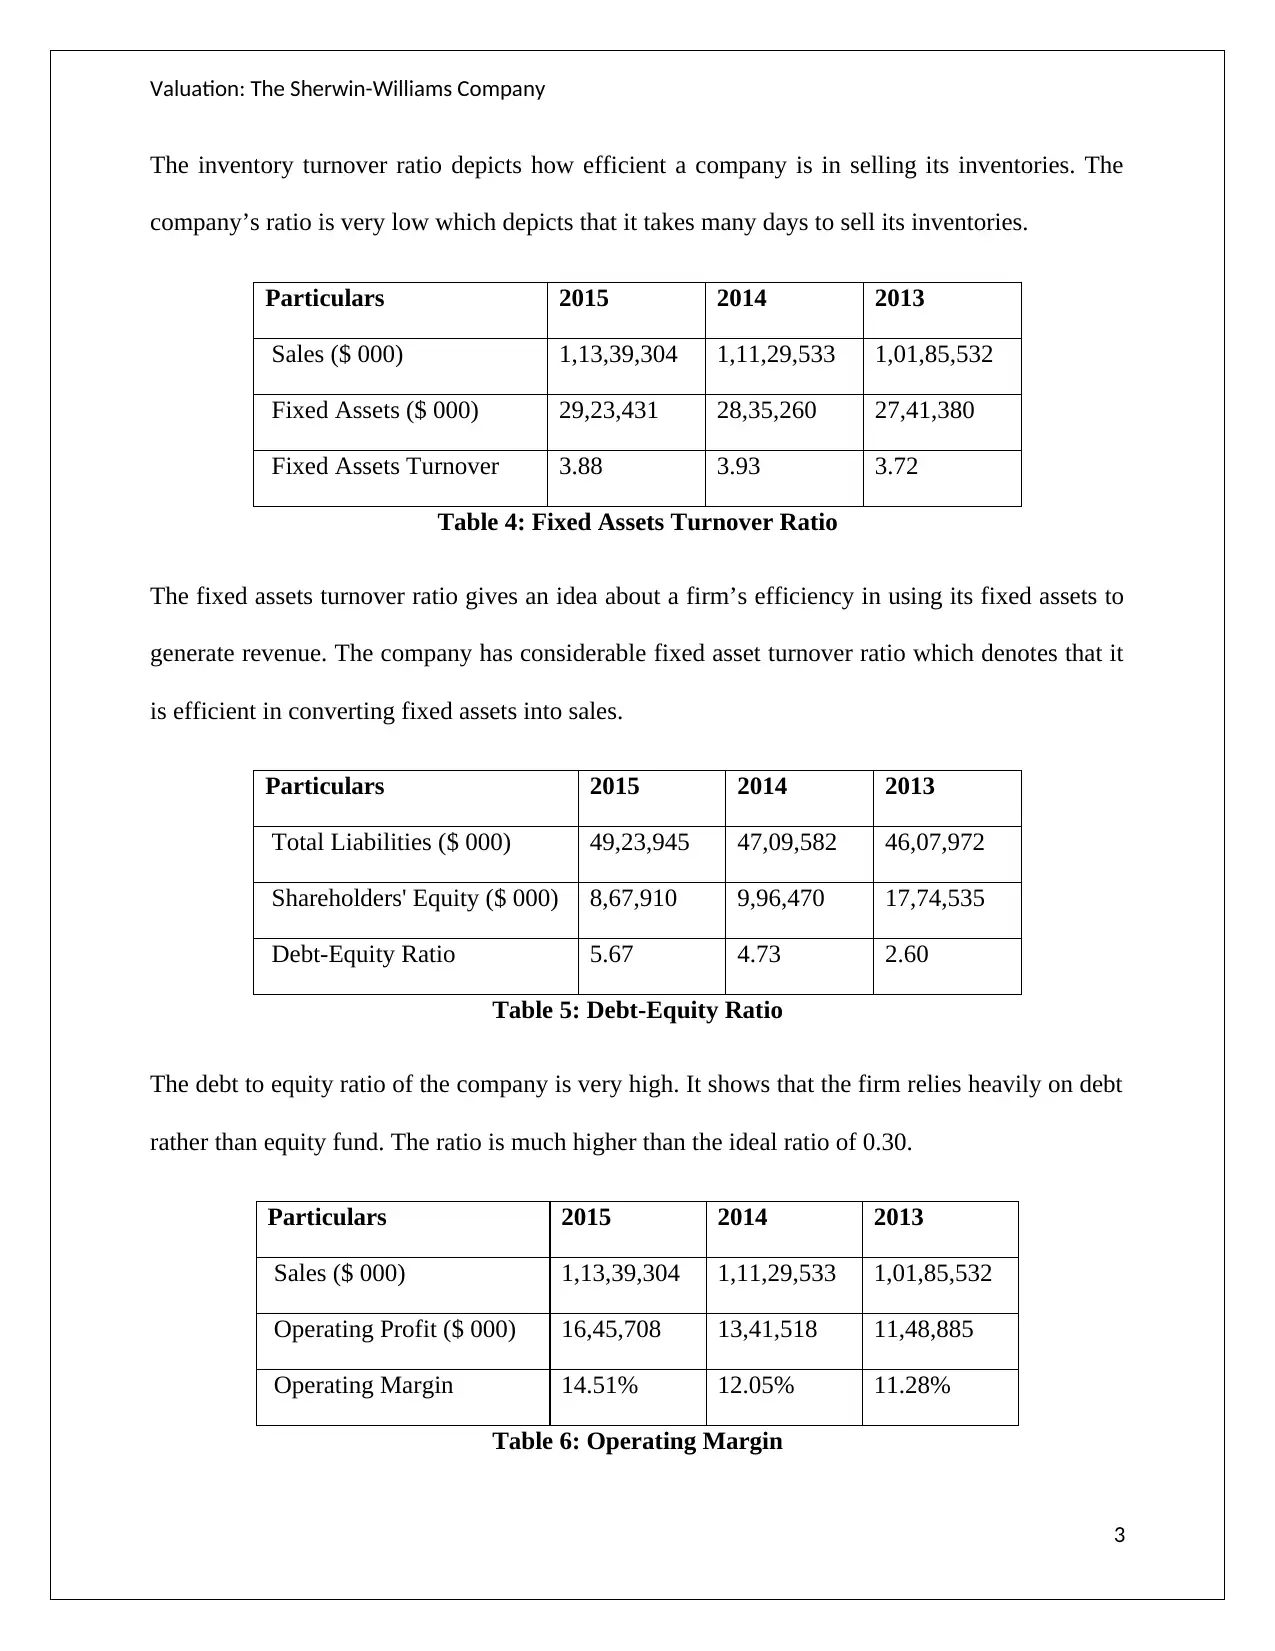
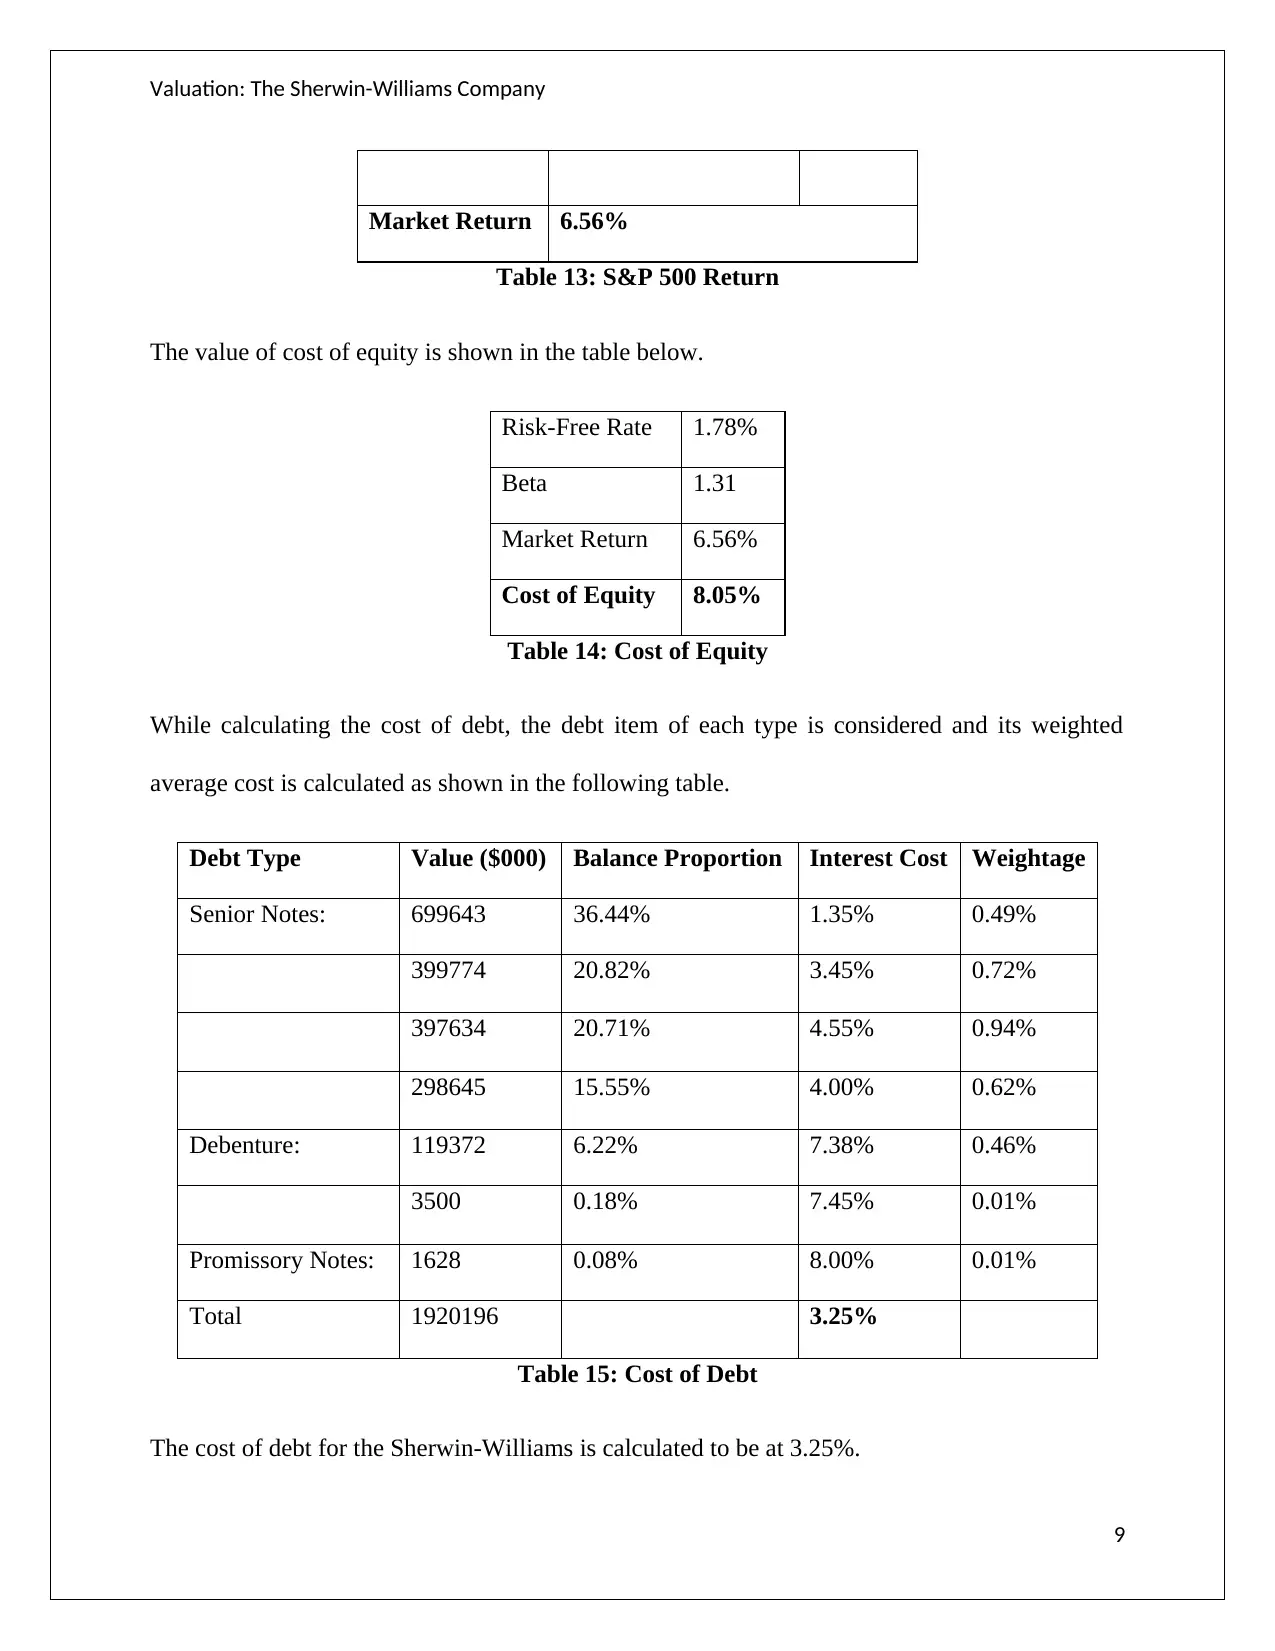
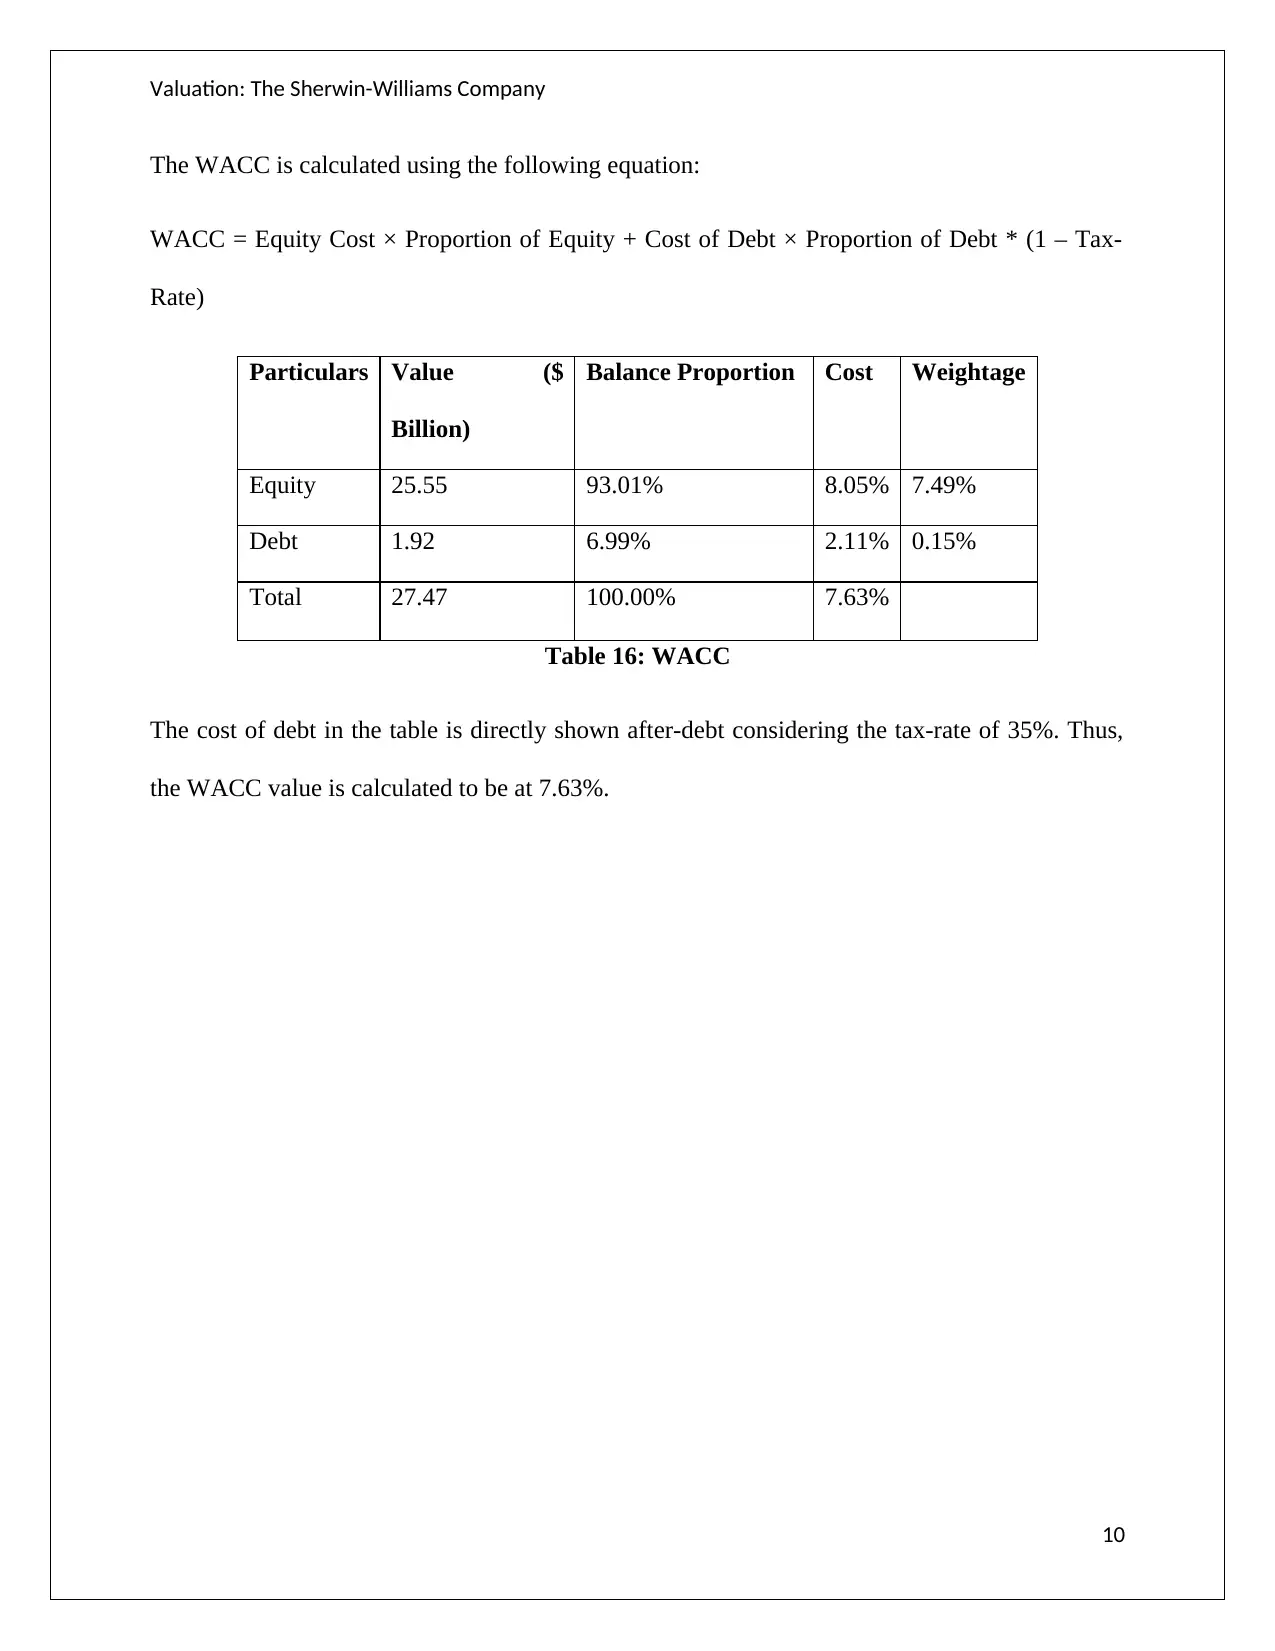
This assignment presents a comprehensive financial valuation of The Sherwin-Williams Company, analyzing its financial performance through various metrics and methodologies. The analysis begins with an examination of key financial ratios, including current ratio, receivable turnover, inventory turnover, fixed assets turnover, debt-equity ratio, operating margin, and net profit margin. The valuation then proceeds to calculate the free cash flow, Return on Equity (RoE), and Weighted Average Cost of Capital (WACC). Furthermore, the report estimates the terminal value, firm value, and intrinsic value per share using discounted cash flow analysis. Economic Value Added (EVA) and Market Value Added (MVA) are also calculated to assess the company's performance. Finally, the assignment examines the dividend payout ratio and applies Gordon's dividend growth model to determine intrinsic value per share. The student provides detailed calculations and interpretations of the financial data, concluding with a sensitivity analysis of the firm value based on different growth rates.
Document Page
Valuation: The Sherwin-williams company
tabler-icon-diamond-filled.svg

Paraphrase This Document

Need a fresh take? Get an instant paraphrase of this document with our AI Paraphraser
Document Page
Valuation: The Sherwin-Williams Company
Table of Contents
Problem 1.......................................................................................................................................................2
Problem 2.......................................................................................................................................................6
Problem 3.......................................................................................................................................................7
Problem 4.......................................................................................................................................................8
Problem 5.....................................................................................................................................................11
Problem 6.....................................................................................................................................................12
Problem 7.....................................................................................................................................................13
Problem 8.....................................................................................................................................................14
Problem 9.....................................................................................................................................................16
Problem 10...................................................................................................................................................17
Problem 11...................................................................................................................................................18
Problem 12...................................................................................................................................................19
Problem 13...................................................................................................................................................20
Problem 14...................................................................................................................................................21
Problem 15...................................................................................................................................................23
References....................................................................................................................................................24
1
Document Page
Valuation: The Sherwin-Williams Company
Problem 1
Particulars 2015 2014 2013
Current Assets ($ 000) 26,58,874 25,66,780 31,58,717
Current Liabilities ($ 000) 21,41,859 26,80,666 25,28,557
Current Ratio 1.24 0.96 1.25
Table 1: Current Ratio
The current ratio of the Sherwin-Williams company is very low. The current assets do not
sufficiently cover liabilities.
Particulars 2015 2014 2013
Sales ($ 000) 1,13,39,304 1,11,29,533 1,01,85,53
2
Accounts Receivables ($ 000) 11,14,275 11,30,565 10,97,751
Receivables Turnover 10.18 9.84 9.28
Table 2: Receivable Turnover
The receivable turnover ratio of the company is also low which shows that it is not efficient in
managing the accounts receivables. The company takes large number of days to collect the
receivables.
Particulars 2015 2014 2013
Cost of Goods Sold ($ 000) 57,80,078 59,65,049 55,68,966
Inventory ($ 000) 10,18,530 10,33,527 9,70,815
Inventory Turnover 5.67 5.77 5.74
Table 3: Inventory Turnover Ratio
2
Document Page
Valuation: The Sherwin-Williams Company
The inventory turnover ratio depicts how efficient a company is in selling its inventories. The
company’s ratio is very low which depicts that it takes many days to sell its inventories.
Particulars 2015 2014 2013
Sales ($ 000) 1,13,39,304 1,11,29,533 1,01,85,532
Fixed Assets ($ 000) 29,23,431 28,35,260 27,41,380
Fixed Assets Turnover 3.88 3.93 3.72
Table 4: Fixed Assets Turnover Ratio
The fixed assets turnover ratio gives an idea about a firm’s efficiency in using its fixed assets to
generate revenue. The company has considerable fixed asset turnover ratio which denotes that it
is efficient in converting fixed assets into sales.
Particulars 2015 2014 2013
Total Liabilities ($ 000) 49,23,945 47,09,582 46,07,972
Shareholders' Equity ($ 000) 8,67,910 9,96,470 17,74,535
Debt-Equity Ratio 5.67 4.73 2.60
Table 5: Debt-Equity Ratio
The debt to equity ratio of the company is very high. It shows that the firm relies heavily on debt
rather than equity fund. The ratio is much higher than the ideal ratio of 0.30.
Particulars 2015 2014 2013
Sales ($ 000) 1,13,39,304 1,11,29,533 1,01,85,532
Operating Profit ($ 000) 16,45,708 13,41,518 11,48,885
Operating Margin 14.51% 12.05% 11.28%
Table 6: Operating Margin
3
tabler-icon-diamond-filled.svg

Paraphrase This Document

Need a fresh take? Get an instant paraphrase of this document with our AI Paraphraser
Document Page
Valuation: The Sherwin-Williams Company
The operating margin of the company is appreciable though not substantial. The margin has
increased over time.
Particulars 2015 2014 2013
Sales ($ 000) 1,13,39,304 1,11,29,533 1,01,85,532
Net Profit ($ 000) 10,53,849 8,65,887 7,52,561
Net Profit Margin 9.29% 7.78% 7.39%
Table 7: Net Profit Margin
The net profit margin like the operating margin is average. The margin has improved over time.
Particulars 2015 2014 2013
Net Profit ($ 000) 10,53,849 8,65,887 7,52,561
Total Assets ($ 000) 57,91,855 57,06,052 63,82,507
Return on Assets 18.20% 15.17% 11.79%
Table 8: Return on Assets
The company has healthy return on assets ratio. It shows the efficiency of the company to
generate profits by using its assets.
Particulars 2015 2014 2013
Operating Profit ($ 000) 16,45,708 13,41,518 11,48,885
Total Assets ($ 000) 57,91,855 57,06,052 63,82,507
Current Liabilities ($ 000) 21,41,859 26,80,666 25,28,557
Capital Employed ($ 000) 36,49,996 30,25,386 38,53,950
Return on Capital Employed 45.09% 44.34% 29.81%
Table 9: Return on Capital Employed
4
Document Page
Valuation: The Sherwin-Williams Company
The company generates significant profit on capital which is evident from its high return on
capital employed ratio. Besides, it has improved over time.
Particulars 2015 2014 2013
Prior Year Diluted EPS ($) 8.78 7.26 6.02
Dividend ($) 2.68 2.20 2.00
Dividend Payout Ratio 30.52% 30.30% 33.22%
Plough Back Ratio 69.48% 69.70% 66.78%
Market Value per Share ($) 255.67 271.27 183.26
Table 10: Dividend Payout Ratio and Market Valuation
Normally, the company ploughs back two third of its profits to expand the operations. One third
of its profit are paid out as dividend. The company’s market price is very high compared to its
diluted earnings per share which shows that the company is overvalued in the market.
5
Document Page
Valuation: The Sherwin-Williams Company
Problem 2
Moody’s investor services gives the rating of A3 to the company. It shows that the chances of the
company defaulting on its debt is low. Though, the company is highly levered, it generates
enough profit to repay its debt along with its interest cost. However, Moody’s have downgraded
their rating from A2 to A3 only recently because the company is in talks for making acquisitions
in 2016. It will decrease the ability of the company to pay its debt smoothly due to profits getting
diverted for acquisition. The commercial paper rating of the company were also downgraded
from Prime-1 to Prime-2.
6
tabler-icon-diamond-filled.svg

Paraphrase This Document

Need a fresh take? Get an instant paraphrase of this document with our AI Paraphraser
Document Page
Valuation: The Sherwin-Williams Company
Problem 3
The free cash flow of generated by a company is obtained by subtracting maintenance capital
expenditure from the cash generated from operations given in the cash flow statement of the
annual report of 2015.
Net Operating Cash = $1447463000
Capital Expenditure = $234340000
Free Cash Flow = $1447463000 - $234340000 = $1213123000
The return on equity value is assumed as growth rate for free cash flows into the future. The
table below shows the calculation for Return on Equity (RoE) value.
Net Income ($ 000) 10,53,849
Shareholders' Equity ($ 000) 8,67,910
RoE (%) 121.42%
Table 11: Return on Equity
The table below shows the free cash flow projections for the period of coming five years from
2016 to 2020.
2015 2016 2017 2018 2019 2020
Free Cash Flow ($ 000) 1213123 268609
7
5947556 13169078 29158973 64563798
Growth Rate 121.42%
Table 12: Free Cash Flow Projections
7
Document Page
Valuation: The Sherwin-Williams Company
Problem 4
The calculation of Weighted Average Cost of Capital (WACC) initially requires calculation of
cost of equity and debt. The cost of equity is calculated using Capital Asset Pricing Model
(CAPM) as follows:
E(R) = Rf + β (Rm - Rf)
Where, Rf = Risk-free Return, E(R) = Cost of Equity, β = Measurement of Volatility, Rm =
Return on Market Portfolio.
The Rf value is taken as the yield on U. S. Government Treasury Bond of 10-year which is
1.78%. The Rm value is calculated by averaging return on S&P 500 Index over 10 years. The
value of β for the Sherwin-Williams Company is extracted from Yahoo Finance and its value is
1.31.
S&P 500 Index
Value
Return
2016 2098.86 1.73%
2015 2063.11 5.25%
2014 1960.23 22.04%
2013 1606.28 17.92%
2012 1362.16 3.14%
2011 1320.64 28.13%
2010 1030.71 12.12%
2009 919.32 -28.18%
2008 1280 -14.86%
2007 1503.35 18.36%
8
Document Page
Valuation: The Sherwin-Williams Company
Market Return 6.56%
Table 13: S&P 500 Return
The value of cost of equity is shown in the table below.
Risk-Free Rate 1.78%
Beta 1.31
Market Return 6.56%
Cost of Equity 8.05%
Table 14: Cost of Equity
While calculating the cost of debt, the debt item of each type is considered and its weighted
average cost is calculated as shown in the following table.
Debt Type Value ($000) Balance Proportion Interest Cost Weightage
Senior Notes: 699643 36.44% 1.35% 0.49%
399774 20.82% 3.45% 0.72%
397634 20.71% 4.55% 0.94%
298645 15.55% 4.00% 0.62%
Debenture: 119372 6.22% 7.38% 0.46%
3500 0.18% 7.45% 0.01%
Promissory Notes: 1628 0.08% 8.00% 0.01%
Total 1920196 3.25%
Table 15: Cost of Debt
The cost of debt for the Sherwin-Williams is calculated to be at 3.25%.
9
tabler-icon-diamond-filled.svg

Paraphrase This Document

Need a fresh take? Get an instant paraphrase of this document with our AI Paraphraser
Document Page
Valuation: The Sherwin-Williams Company
The WACC is calculated using the following equation:
WACC = Equity Cost × Proportion of Equity + Cost of Debt × Proportion of Debt * (1 – Tax-
Rate)
Particulars Value ($
Billion)
Balance Proportion Cost Weightage
Equity 25.55 93.01% 8.05% 7.49%
Debt 1.92 6.99% 2.11% 0.15%
Total 27.47 100.00% 7.63%
Table 16: WACC
The cost of debt in the table is directly shown after-debt considering the tax-rate of 35%. Thus,
the WACC value is calculated to be at 7.63%.
10
Document Page
Valuation: The Sherwin-Williams Company
Problem 5
The company’s terminal value is obtained by discounting the value of free cash flow at the end
of 2020 considering the discount rate of 7.63% which is same as the WACC. The perpetuity
growth rate of 1% for free cash flow value is also considered. This growth is an assumption that
the cash flows will grow at a constant rate of 1% each year till eternity. The equation for terminal
value is as follows:
Terminal Value = FCF in 2020 / (Discount Rate – Eternity Growth Rate)
= 64563798000 / (0.0763 – 0.01)
= 973314190000
11
chevron_up_icon
1 out of 23
circle_padding
hide_on_mobile
zoom_out_icon
[object Object]