FBL5030 - Value Creation in Business: A Case Study of Harvey Norman
VerifiedAdded on 2023/06/13
|28
|7785
|167
Report
AI Summary
This report presents a comprehensive financial analysis of Harvey Norman (HVN), focusing on value creation over five fiscal years. It examines the company's income statement, balance sheet, and cash flow statement, utilizing financial ratios to assess performance. The income statement analysis reveals trends in operating expenses and retained earnings, highlighting periods of growth and decline. The balance sheet analysis focuses on changes in property, plant, and equipment, as well as long-term liabilities, to evaluate asset accumulation and debt management. The cash flow statement analysis assesses the company's cash position and its ability to meet short-term obligations. Overall, the report aims to provide insights into Harvey Norman's financial health and its strategies for creating value. Desklib provides access to similar reports and study tools for students.
Running head: FUNDAMENTALS OF VALUE CREATION IN BUSINESSES
Fundamentals of Value Creation in Businesses
Name of the Student:
Name of the University:
Authors Note:
Fundamentals of Value Creation in Businesses
Name of the Student:
Name of the University:
Authors Note:
Paraphrase This Document
Need a fresh take? Get an instant paraphrase of this document with our AI Paraphraser
FUNDAMENTALS OF VALUE CREATION IN BUSINESSES
1
Table of Contents
3. Presenting the Analysis of the Company:..............................................................................2
3.3 Introduction:.........................................................................................................................2
3.4 Income statement analysis:..................................................................................................2
3.5 Balance sheet analysis:.........................................................................................................5
3.6 Cash flow statement analysis:..............................................................................................8
3.7 Profitability analysis:.........................................................................................................11
3.8 Liquidity analysis:..............................................................................................................14
3.9 Solvency analysis:..............................................................................................................17
3.10 Conclusion:......................................................................................................................20
Reference and Bibliography:....................................................................................................22
Appendices:..............................................................................................................................26
FUNDAMENTALS OF VALUE CREATION IN BUSINESSES
2
3. Presenting the Analysis of the Company:
3.3 Introduction:
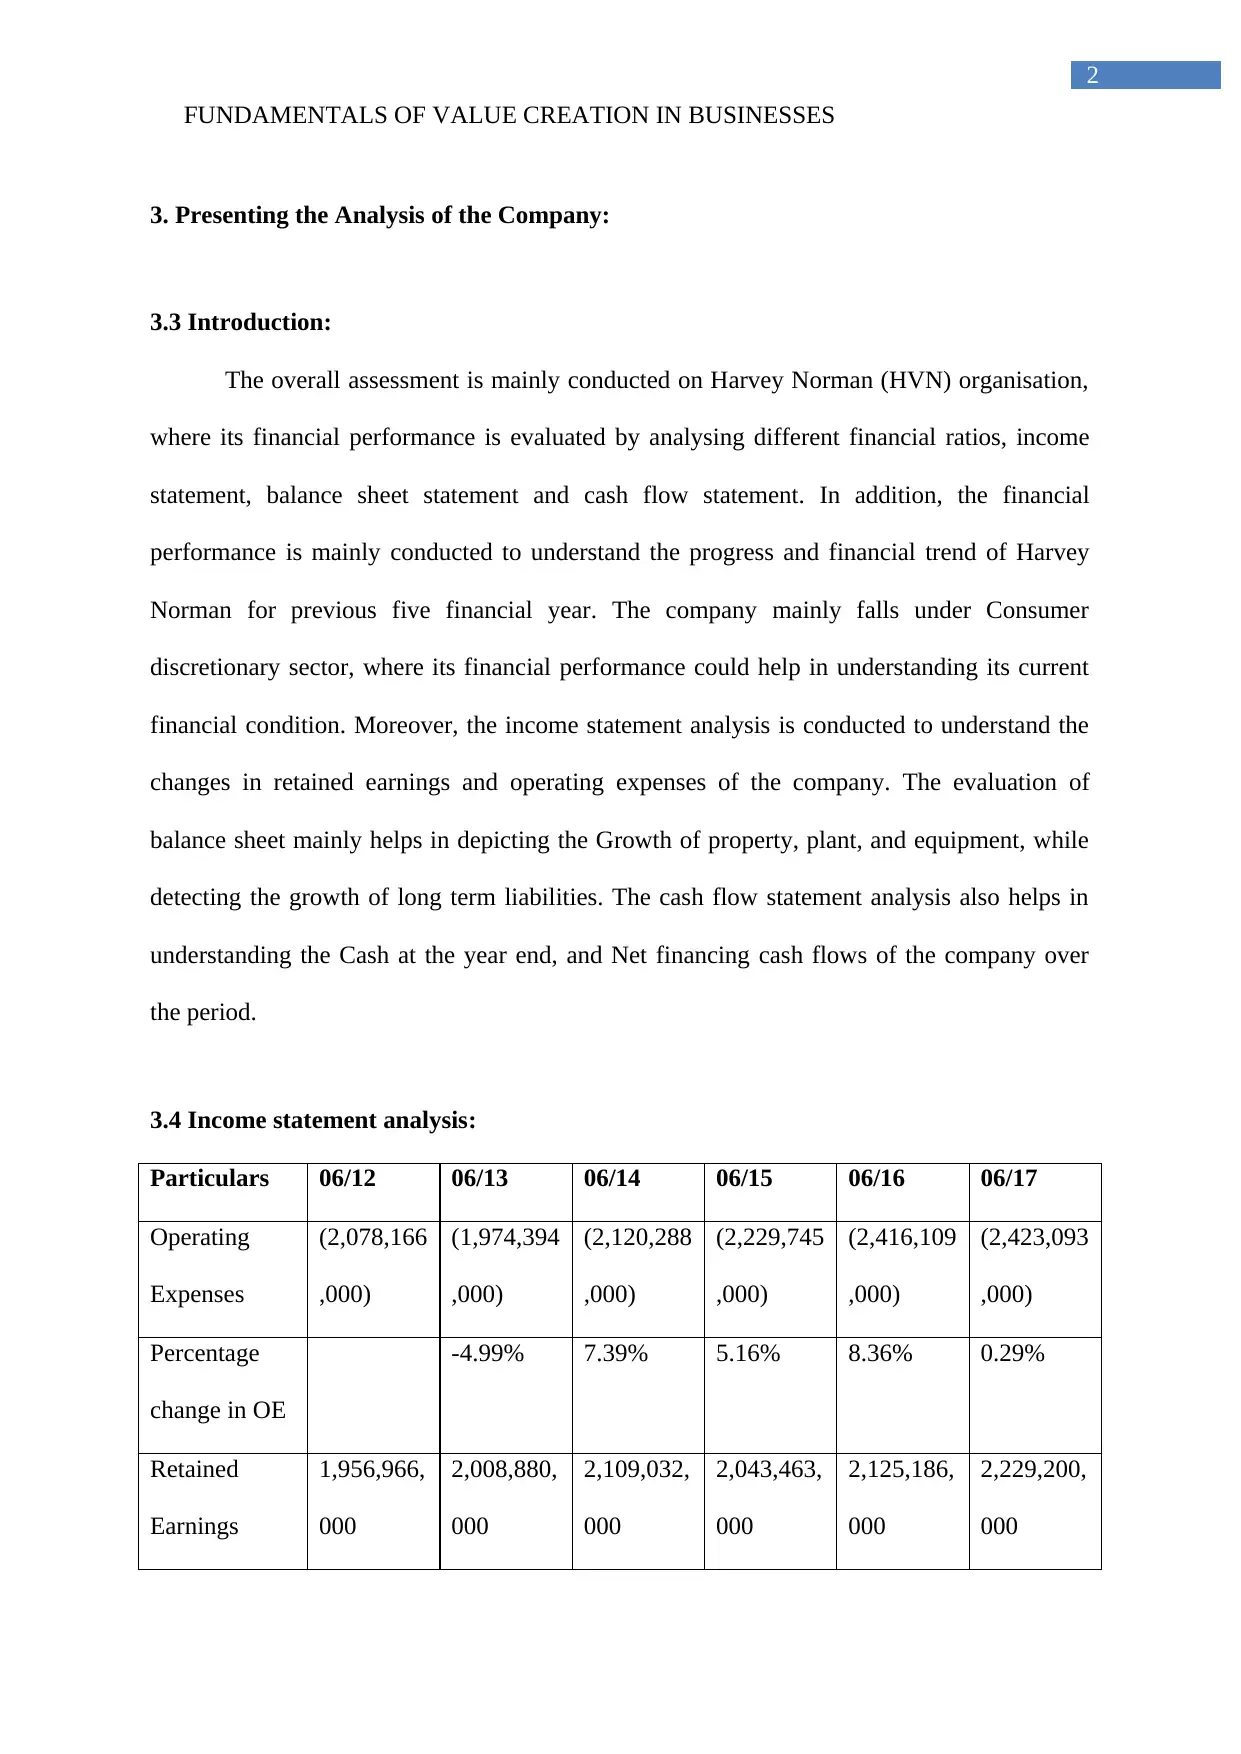
The overall assessment is mainly conducted on Harvey Norman (HVN) organisation,
where its financial performance is evaluated by analysing different financial ratios, income
statement, balance sheet statement and cash flow statement. In addition, the financial
performance is mainly conducted to understand the progress and financial trend of Harvey
Norman for previous five financial year. The company mainly falls under Consumer
discretionary sector, where its financial performance could help in understanding its current
financial condition. Moreover, the income statement analysis is conducted to understand the
changes in retained earnings and operating expenses of the company. The evaluation of
balance sheet mainly helps in depicting the Growth of property, plant, and equipment, while
detecting the growth of long term liabilities. The cash flow statement analysis also helps in
understanding the Cash at the year end, and Net financing cash flows of the company over
the period.
3.4 Income statement analysis:
Particulars 06/12 06/13 06/14 06/15 06/16 06/17
Operating
Expenses
(2,078,166
,000)
(1,974,394
,000)
(2,120,288
,000)
(2,229,745
,000)
(2,416,109
,000)
(2,423,093
,000)
Percentage
change in OE
-4.99% 7.39% 5.16% 8.36% 0.29%
Retained
Earnings
1,956,966,
000
2,008,880,
000
2,109,032,
000
2,043,463,
000
2,125,186,
000
2,229,200,
000
2
3. Presenting the Analysis of the Company:
3.3 Introduction:
The overall assessment is mainly conducted on Harvey Norman (HVN) organisation,
where its financial performance is evaluated by analysing different financial ratios, income
statement, balance sheet statement and cash flow statement. In addition, the financial
performance is mainly conducted to understand the progress and financial trend of Harvey
Norman for previous five financial year. The company mainly falls under Consumer
discretionary sector, where its financial performance could help in understanding its current
financial condition. Moreover, the income statement analysis is conducted to understand the
changes in retained earnings and operating expenses of the company. The evaluation of
balance sheet mainly helps in depicting the Growth of property, plant, and equipment, while
detecting the growth of long term liabilities. The cash flow statement analysis also helps in
understanding the Cash at the year end, and Net financing cash flows of the company over
the period.
3.4 Income statement analysis:
Particulars 06/12 06/13 06/14 06/15 06/16 06/17
Operating
Expenses
(2,078,166
,000)
(1,974,394
,000)
(2,120,288
,000)
(2,229,745
,000)
(2,416,109
,000)
(2,423,093
,000)
Percentage
change in OE
-4.99% 7.39% 5.16% 8.36% 0.29%
Retained
Earnings
1,956,966,
000
2,008,880,
000
2,109,032,
000
2,043,463,
000
2,125,186,
000
2,229,200,
000
⊘ This is a preview!⊘
Do you want full access?
Subscribe today to unlock all pages.
Trusted by 1+ million students worldwide
FUNDAMENTALS OF VALUE CREATION IN BUSINESSES
3
Percentage
change in RE
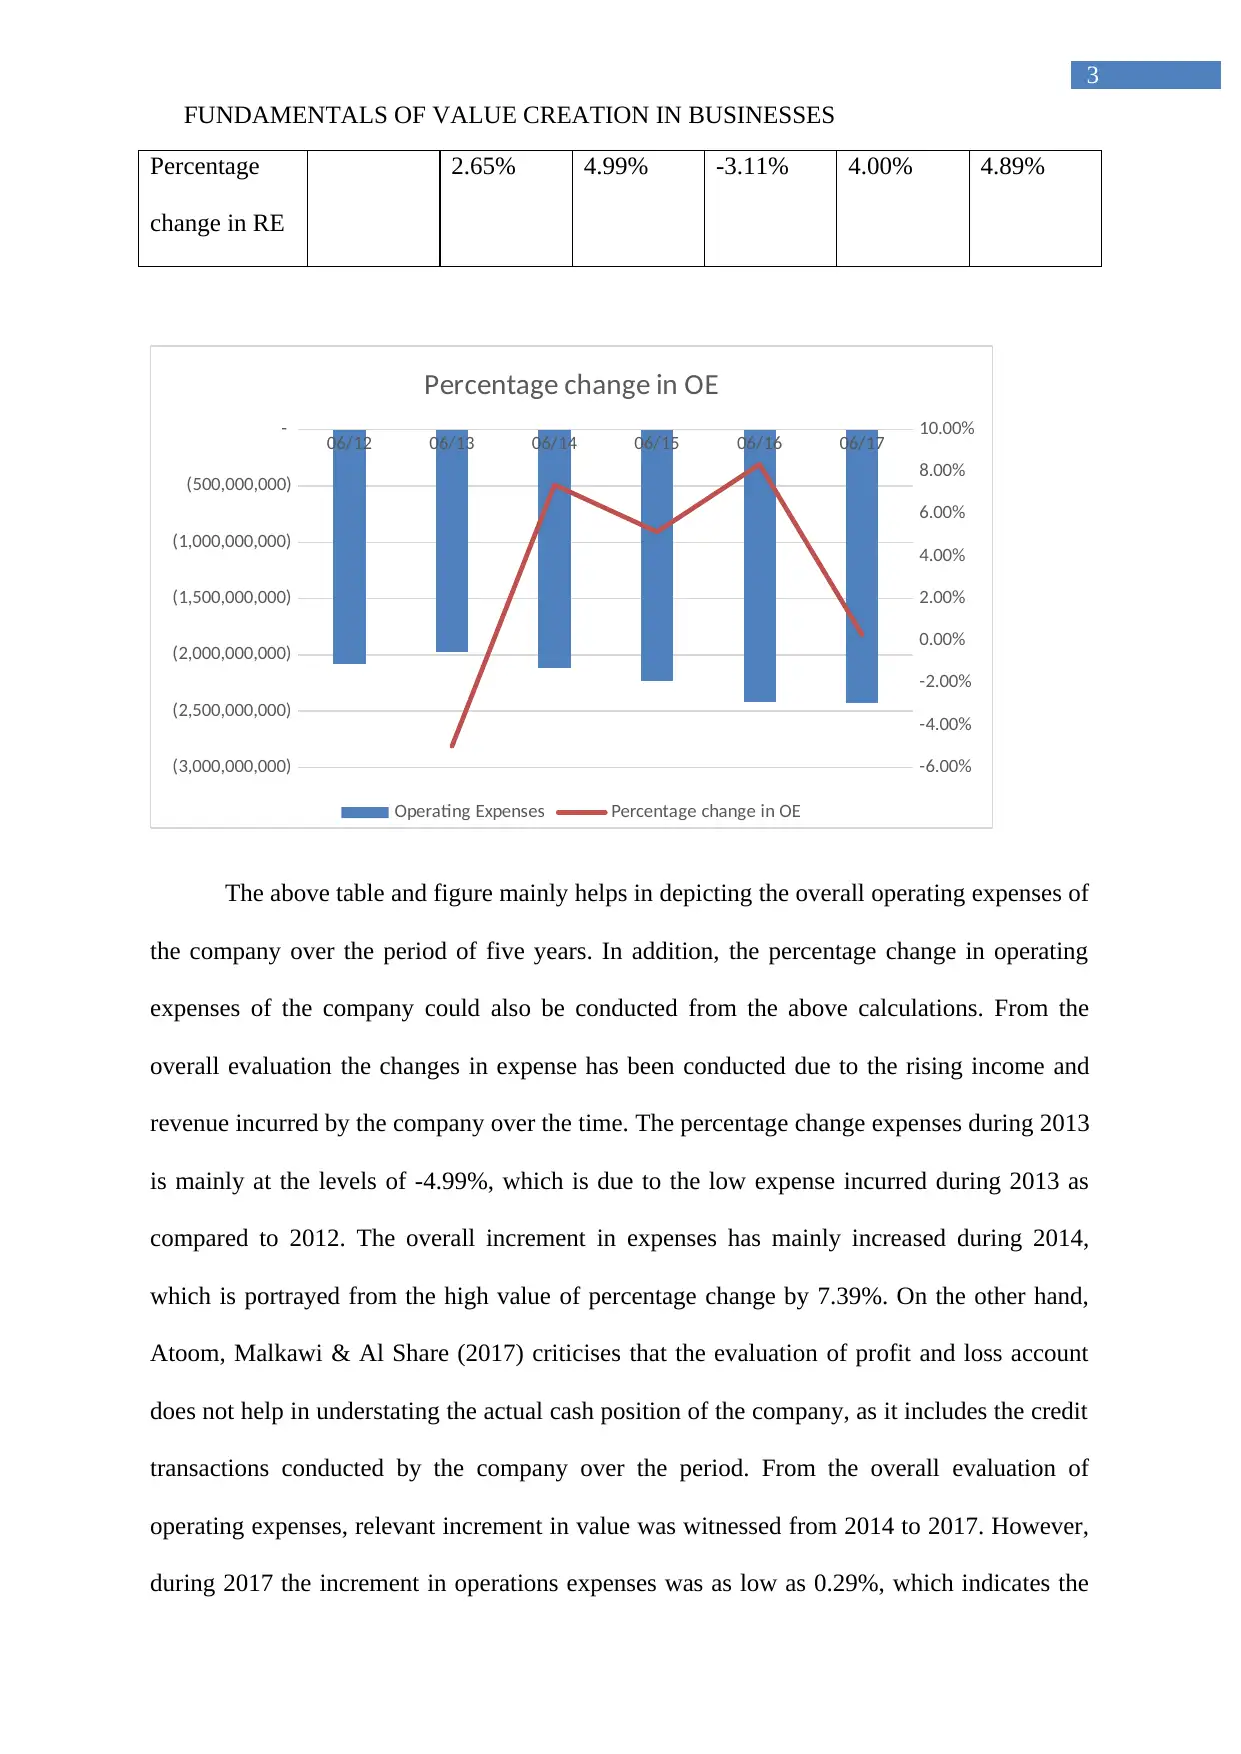
2.65% 4.99% -3.11% 4.00% 4.89%
06/12 06/13 06/14 06/15 06/16 06/17
(3,000,000,000)
(2,500,000,000)
(2,000,000,000)
(1,500,000,000)
(1,000,000,000)
(500,000,000)
-
-6.00%
-4.00%
-2.00%
0.00%
2.00%
4.00%
6.00%
8.00%
10.00%
Percentage change in OE
Operating Expenses Percentage change in OE
The above table and figure mainly helps in depicting the overall operating expenses of
the company over the period of five years. In addition, the percentage change in operating
expenses of the company could also be conducted from the above calculations. From the
overall evaluation the changes in expense has been conducted due to the rising income and
revenue incurred by the company over the time. The percentage change expenses during 2013
is mainly at the levels of -4.99%, which is due to the low expense incurred during 2013 as
compared to 2012. The overall increment in expenses has mainly increased during 2014,
which is portrayed from the high value of percentage change by 7.39%. On the other hand,
Atoom, Malkawi & Al Share (2017) criticises that the evaluation of profit and loss account
does not help in understating the actual cash position of the company, as it includes the credit
transactions conducted by the company over the period. From the overall evaluation of
operating expenses, relevant increment in value was witnessed from 2014 to 2017. However,
during 2017 the increment in operations expenses was as low as 0.29%, which indicates the
3
Percentage
change in RE
2.65% 4.99% -3.11% 4.00% 4.89%
06/12 06/13 06/14 06/15 06/16 06/17
(3,000,000,000)
(2,500,000,000)
(2,000,000,000)
(1,500,000,000)
(1,000,000,000)
(500,000,000)
-
-6.00%
-4.00%
-2.00%
0.00%
2.00%
4.00%
6.00%
8.00%
10.00%
Percentage change in OE
Operating Expenses Percentage change in OE
The above table and figure mainly helps in depicting the overall operating expenses of
the company over the period of five years. In addition, the percentage change in operating
expenses of the company could also be conducted from the above calculations. From the
overall evaluation the changes in expense has been conducted due to the rising income and
revenue incurred by the company over the time. The percentage change expenses during 2013
is mainly at the levels of -4.99%, which is due to the low expense incurred during 2013 as
compared to 2012. The overall increment in expenses has mainly increased during 2014,
which is portrayed from the high value of percentage change by 7.39%. On the other hand,
Atoom, Malkawi & Al Share (2017) criticises that the evaluation of profit and loss account
does not help in understating the actual cash position of the company, as it includes the credit
transactions conducted by the company over the period. From the overall evaluation of
operating expenses, relevant increment in value was witnessed from 2014 to 2017. However,
during 2017 the increment in operations expenses was as low as 0.29%, which indicates the
Paraphrase This Document
Need a fresh take? Get an instant paraphrase of this document with our AI Paraphraser
FUNDAMENTALS OF VALUE CREATION IN BUSINESSES
4
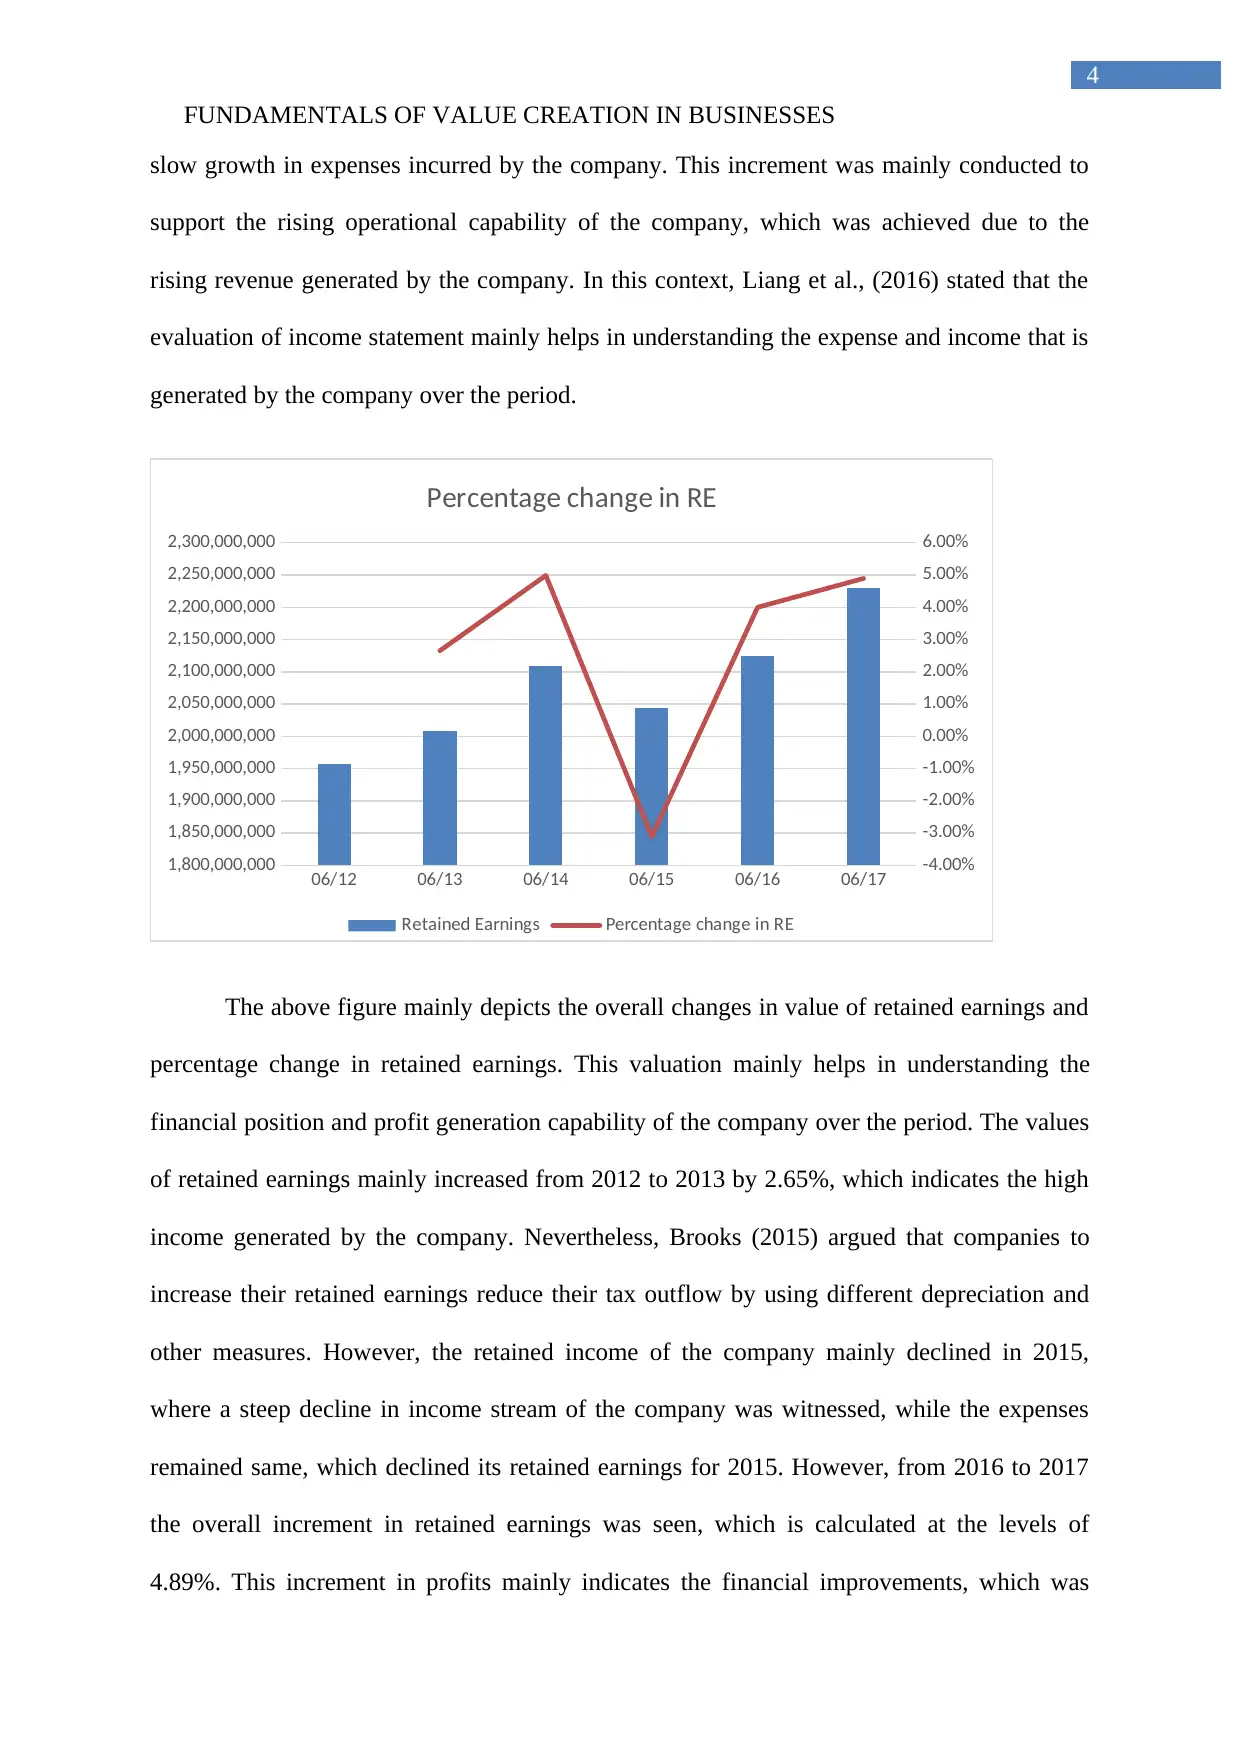
slow growth in expenses incurred by the company. This increment was mainly conducted to
support the rising operational capability of the company, which was achieved due to the
rising revenue generated by the company. In this context, Liang et al., (2016) stated that the
evaluation of income statement mainly helps in understanding the expense and income that is
generated by the company over the period.
06/12 06/13 06/14 06/15 06/16 06/17
1,800,000,000
1,850,000,000
1,900,000,000
1,950,000,000
2,000,000,000
2,050,000,000
2,100,000,000
2,150,000,000
2,200,000,000
2,250,000,000
2,300,000,000
-4.00%
-3.00%
-2.00%
-1.00%
0.00%
1.00%
2.00%
3.00%
4.00%
5.00%
6.00%
Percentage change in RE
Retained Earnings Percentage change in RE
The above figure mainly depicts the overall changes in value of retained earnings and
percentage change in retained earnings. This valuation mainly helps in understanding the
financial position and profit generation capability of the company over the period. The values
of retained earnings mainly increased from 2012 to 2013 by 2.65%, which indicates the high
income generated by the company. Nevertheless, Brooks (2015) argued that companies to
increase their retained earnings reduce their tax outflow by using different depreciation and
other measures. However, the retained income of the company mainly declined in 2015,
where a steep decline in income stream of the company was witnessed, while the expenses
remained same, which declined its retained earnings for 2015. However, from 2016 to 2017
the overall increment in retained earnings was seen, which is calculated at the levels of
4.89%. This increment in profits mainly indicates the financial improvements, which was
4
slow growth in expenses incurred by the company. This increment was mainly conducted to
support the rising operational capability of the company, which was achieved due to the
rising revenue generated by the company. In this context, Liang et al., (2016) stated that the
evaluation of income statement mainly helps in understanding the expense and income that is
generated by the company over the period.
06/12 06/13 06/14 06/15 06/16 06/17
1,800,000,000
1,850,000,000
1,900,000,000
1,950,000,000
2,000,000,000
2,050,000,000
2,100,000,000
2,150,000,000
2,200,000,000
2,250,000,000
2,300,000,000
-4.00%
-3.00%
-2.00%
-1.00%
0.00%
1.00%
2.00%
3.00%
4.00%
5.00%
6.00%
Percentage change in RE
Retained Earnings Percentage change in RE
The above figure mainly depicts the overall changes in value of retained earnings and
percentage change in retained earnings. This valuation mainly helps in understanding the
financial position and profit generation capability of the company over the period. The values
of retained earnings mainly increased from 2012 to 2013 by 2.65%, which indicates the high
income generated by the company. Nevertheless, Brooks (2015) argued that companies to
increase their retained earnings reduce their tax outflow by using different depreciation and
other measures. However, the retained income of the company mainly declined in 2015,
where a steep decline in income stream of the company was witnessed, while the expenses
remained same, which declined its retained earnings for 2015. However, from 2016 to 2017
the overall increment in retained earnings was seen, which is calculated at the levels of
4.89%. This increment in profits mainly indicates the financial improvements, which was
FUNDAMENTALS OF VALUE CREATION IN BUSINESSES
5
obtained by Harvey Norman in 2017, as compared to other years. Ronapat (2018) stated that
with the evaluation of retained earnings investors can identify the current financial position of
the company, which could be used in the expansion process of the organisation.
The analysis of retained earnings and operational expenses of Harvey Norman mainly
helps in identifying and improving financial position of the company over time. Moreover,
revenue of the organisation has relevantly increased exponentially against the rising operating
expenses, while raising the level of retained earnings of the company. Therefore, it could be
understood that income status of the organisation has relevantly increased over time, due to
the accumulation of high revenues and low expenses incurred from operations. According to
Kanapickiene & Grundiene (2015), the analysis of income statement mainly helps investors
in gauging into the expenses and income that is been conducted by the company over the
fiscal year.
3.5 Balance sheet analysis:
Particulars 06/12 06/13 06/14 06/15 06/16 06/17
NCA - PP&E 536,277,
000
548,903,
000
569,057,
000
552,603,
000
580,805,
000
625,112,
000
Percentage change in
PP&E
2.35% 3.67% -2.89% 5.10% 7.63%
Total NCL 767,164,
000
867,119,
000
471,998,
000
518,605,
000
464,114,
000
633,412,
000
Percentage change in
Long term liabilities
13.03% -45.57% 9.87% -10.51% 36.48%
⊘ This is a preview!⊘
Do you want full access?
Subscribe today to unlock all pages.
Trusted by 1+ million students worldwide
FUNDAMENTALS OF VALUE CREATION IN BUSINESSES
6
06/12 06/13 06/14 06/15 06/16 06/17
480,000,000
500,000,000
520,000,000
540,000,000
560,000,000
580,000,000
600,000,000
620,000,000
640,000,000
-4.00%
-2.00%
0.00%
2.00%
4.00%
6.00%
8.00%
10.00%
Percentage change in PP&E
NCA - PP&E Percentage change in PP&E
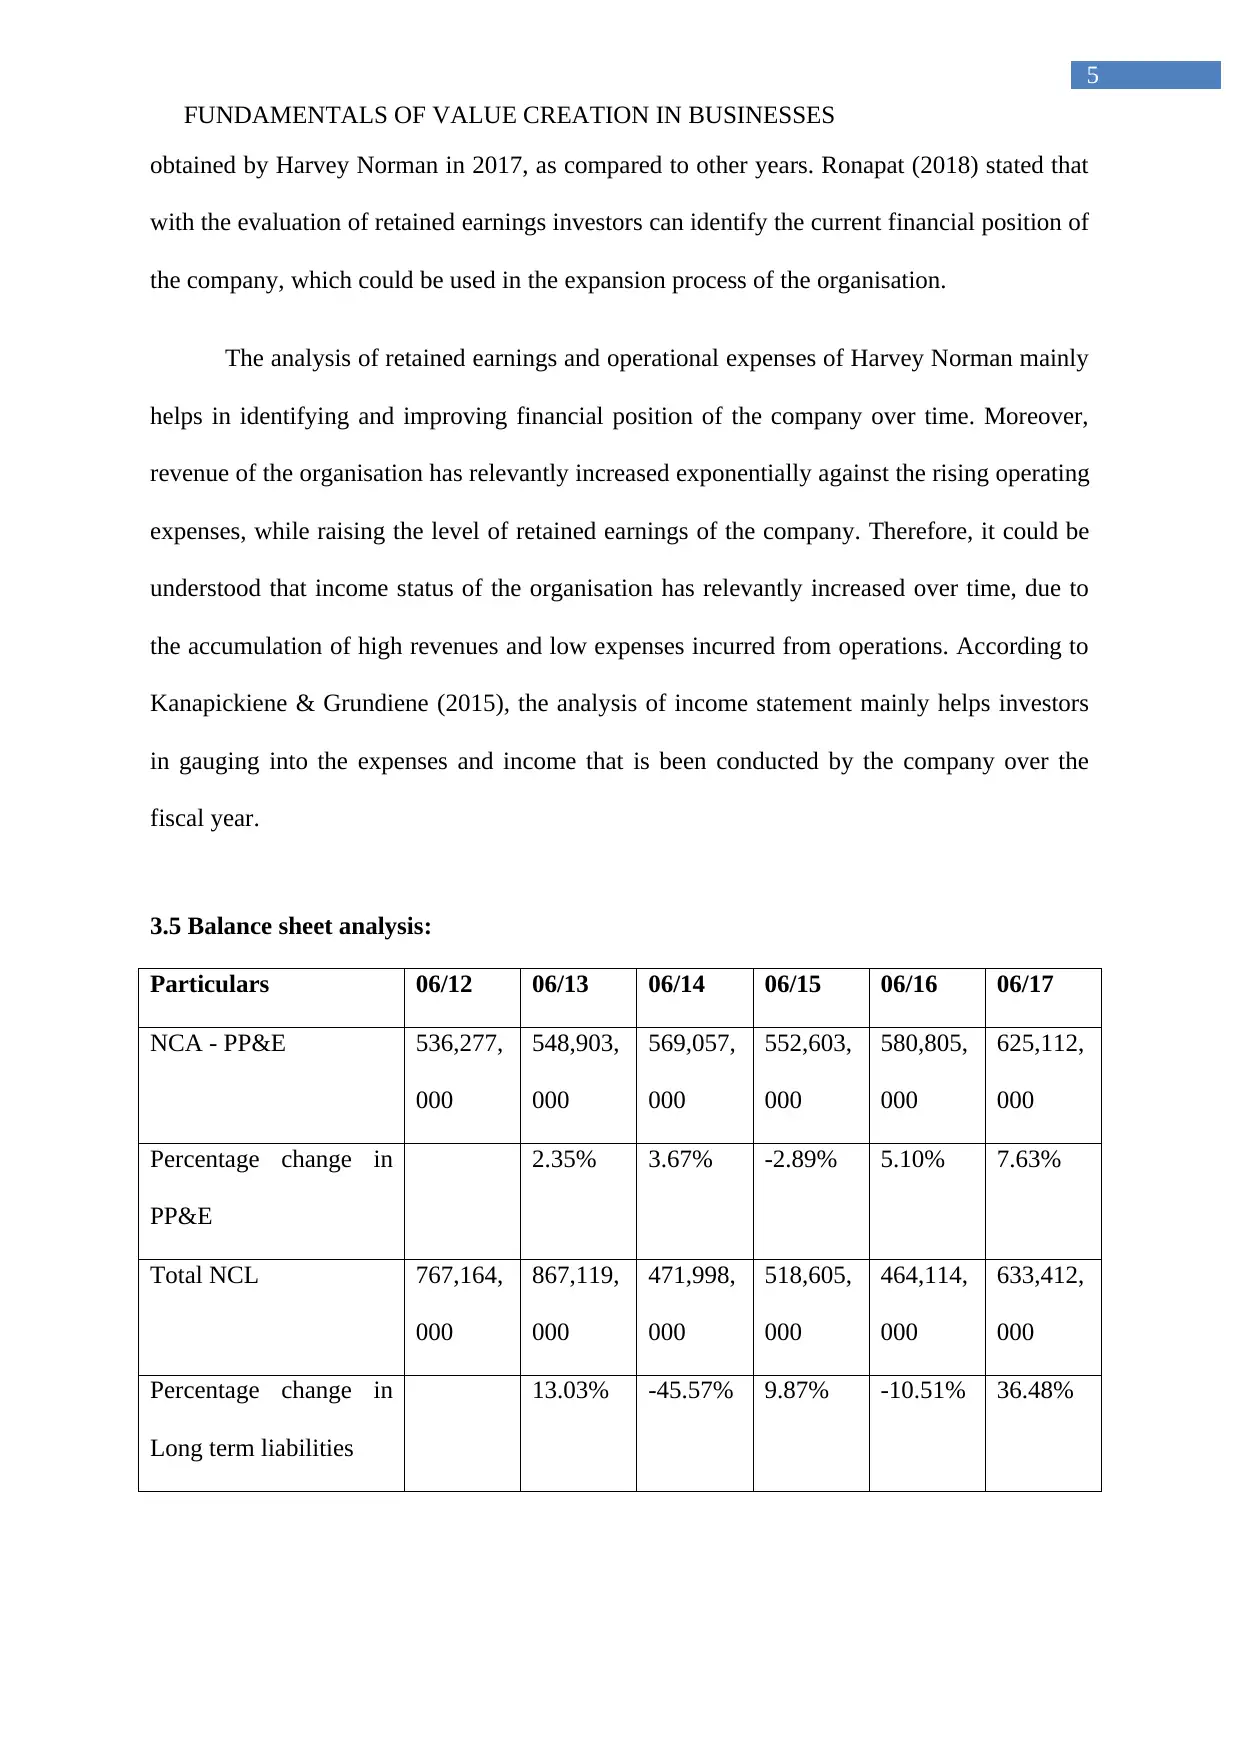
The change in Growth of property, plant and equipment is mainly evaluated with the
help of above figure and tables. The increment in overall valuation of property, plant and
equipment mainly helps in depicting the financial position of the company over time. In
addition, the changes in percentage of property, plant, and equipment from 2012 to 2017 is
relevantly positive, which indicates the accumulation of adequate assets conducted by Harvey
Norman. Furthermore, the financial position, and expenses incurred by the company on
property, plant and equipment can be seen from the above calculations. The values of net
increment in property, plant, and equipment can be seen from the above figure, which has
relevantly increased from 2012 to 2014, while decline in its value can be seen during 2015.
This decline is mainly conducted, due to the reduction in dur to the low accumulation of
revenue and cash conducted during 2015 to support the purchase of assets. Moreover, the
percentage change in property, plant, and equipment during 2015 was mainly at the levels of
-2.89%, which eventually depicts the low expenses incurred in asset accumulation. Buchman,
Harris & Liu (2016) mentioned that with the use of fixed assets analysis the investors
evaluate the operational capability of the company.
6
06/12 06/13 06/14 06/15 06/16 06/17
480,000,000
500,000,000
520,000,000
540,000,000
560,000,000
580,000,000
600,000,000
620,000,000
640,000,000
-4.00%
-2.00%
0.00%
2.00%
4.00%
6.00%
8.00%
10.00%
Percentage change in PP&E
NCA - PP&E Percentage change in PP&E
The change in Growth of property, plant and equipment is mainly evaluated with the
help of above figure and tables. The increment in overall valuation of property, plant and
equipment mainly helps in depicting the financial position of the company over time. In
addition, the changes in percentage of property, plant, and equipment from 2012 to 2017 is
relevantly positive, which indicates the accumulation of adequate assets conducted by Harvey
Norman. Furthermore, the financial position, and expenses incurred by the company on
property, plant and equipment can be seen from the above calculations. The values of net
increment in property, plant, and equipment can be seen from the above figure, which has
relevantly increased from 2012 to 2014, while decline in its value can be seen during 2015.
This decline is mainly conducted, due to the reduction in dur to the low accumulation of
revenue and cash conducted during 2015 to support the purchase of assets. Moreover, the
percentage change in property, plant, and equipment during 2015 was mainly at the levels of
-2.89%, which eventually depicts the low expenses incurred in asset accumulation. Buchman,
Harris & Liu (2016) mentioned that with the use of fixed assets analysis the investors
evaluate the operational capability of the company.
Paraphrase This Document
Need a fresh take? Get an instant paraphrase of this document with our AI Paraphraser
FUNDAMENTALS OF VALUE CREATION IN BUSINESSES
7
Moreover, increment in property, plant, and equipment accumulation during 2016 was
at the levels of 5.10%, while during 2017 the value increased to 7.63%. This relevantly
indicates the accumulation of high end fixed assets, which was used in improving the level of
operations of the company. This increment in in property, plant and equipment mainly
supported the overall financial capability and revenue generation capacity of the organisation.
On the contrary, Paul & Mitra (2017) criticises that the increment in fixed asset accumulation
might reduce the cash availability and working capital capability of the company to continue
its operations smoothly.
06/12 06/13 06/14 06/15 06/16 06/17
0
100,000,000
200,000,000
300,000,000
400,000,000
500,000,000
600,000,000
700,000,000
800,000,000
900,000,000
1,000,000,000
-50.00%
-40.00%
-30.00%
-20.00%
-10.00%
0.00%
10.00%
20.00%
30.00%
40.00%
50.00%
Percentage change in Long term liabilities
Total NCL Percentage change in Long term liabilities
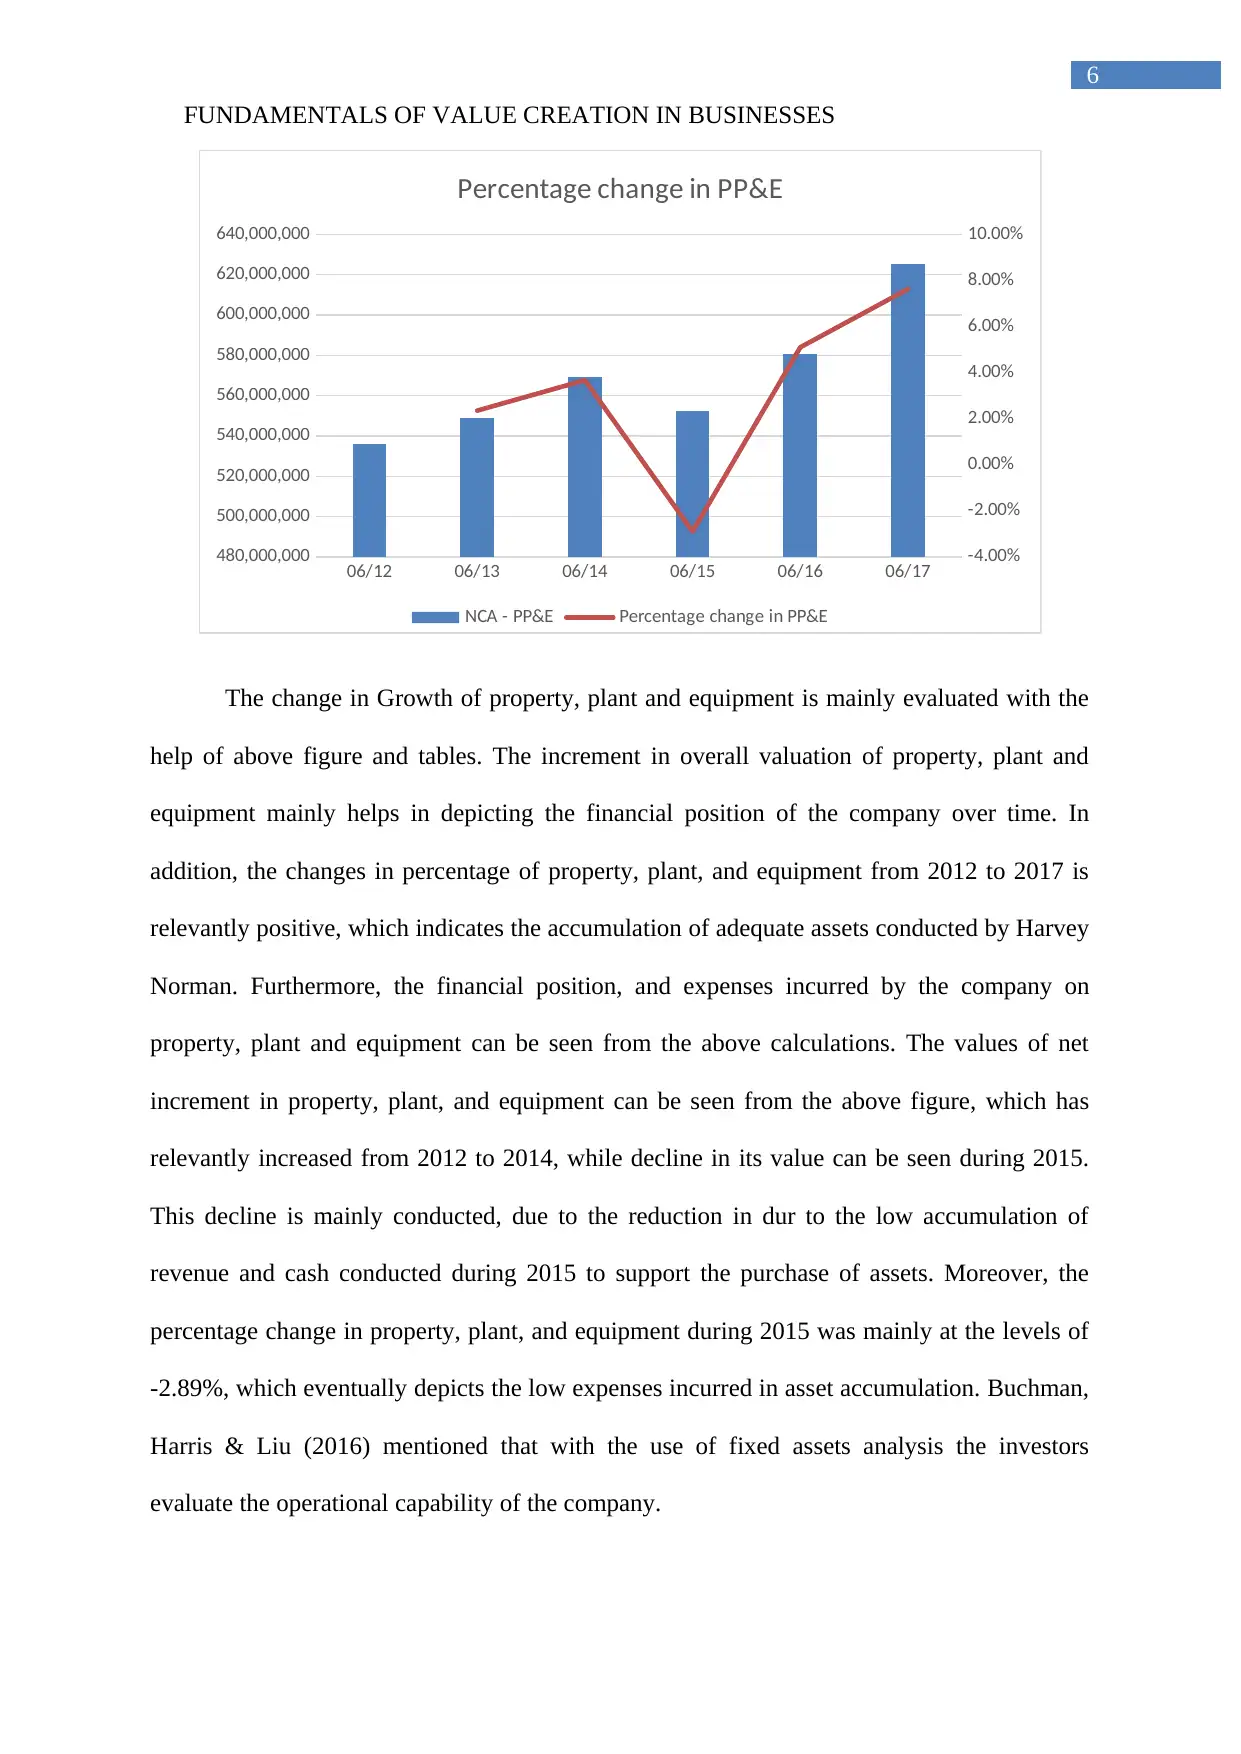
The overall figure helps in understanding the change in long term liabilities of the
company over the period of 5 years, which has changed exponentially over time. In addition,
the changes in percentage of long term liabilities is mainly identified from the non-current
liabilities of Harvey Norman. Moreover, the long-term liabilities accumulated by the
company can be identified from the above figure, which has declined from 2012 to 2017.
Moreover, the financial performance of company mainly improved due to the low
accumulation of debt conducted for supporting its operations. The long-term liabilities mainly
declined in 2014, where the change in long term debt was at the levels of -45.57%. Carlino et
7
Moreover, increment in property, plant, and equipment accumulation during 2016 was
at the levels of 5.10%, while during 2017 the value increased to 7.63%. This relevantly
indicates the accumulation of high end fixed assets, which was used in improving the level of
operations of the company. This increment in in property, plant and equipment mainly
supported the overall financial capability and revenue generation capacity of the organisation.
On the contrary, Paul & Mitra (2017) criticises that the increment in fixed asset accumulation
might reduce the cash availability and working capital capability of the company to continue
its operations smoothly.
06/12 06/13 06/14 06/15 06/16 06/17
0
100,000,000
200,000,000
300,000,000
400,000,000
500,000,000
600,000,000
700,000,000
800,000,000
900,000,000
1,000,000,000
-50.00%
-40.00%
-30.00%
-20.00%
-10.00%
0.00%
10.00%
20.00%
30.00%
40.00%
50.00%
Percentage change in Long term liabilities
Total NCL Percentage change in Long term liabilities
The overall figure helps in understanding the change in long term liabilities of the
company over the period of 5 years, which has changed exponentially over time. In addition,
the changes in percentage of long term liabilities is mainly identified from the non-current
liabilities of Harvey Norman. Moreover, the long-term liabilities accumulated by the
company can be identified from the above figure, which has declined from 2012 to 2017.
Moreover, the financial performance of company mainly improved due to the low
accumulation of debt conducted for supporting its operations. The long-term liabilities mainly
declined in 2014, where the change in long term debt was at the levels of -45.57%. Carlino et
FUNDAMENTALS OF VALUE CREATION IN BUSINESSES
8
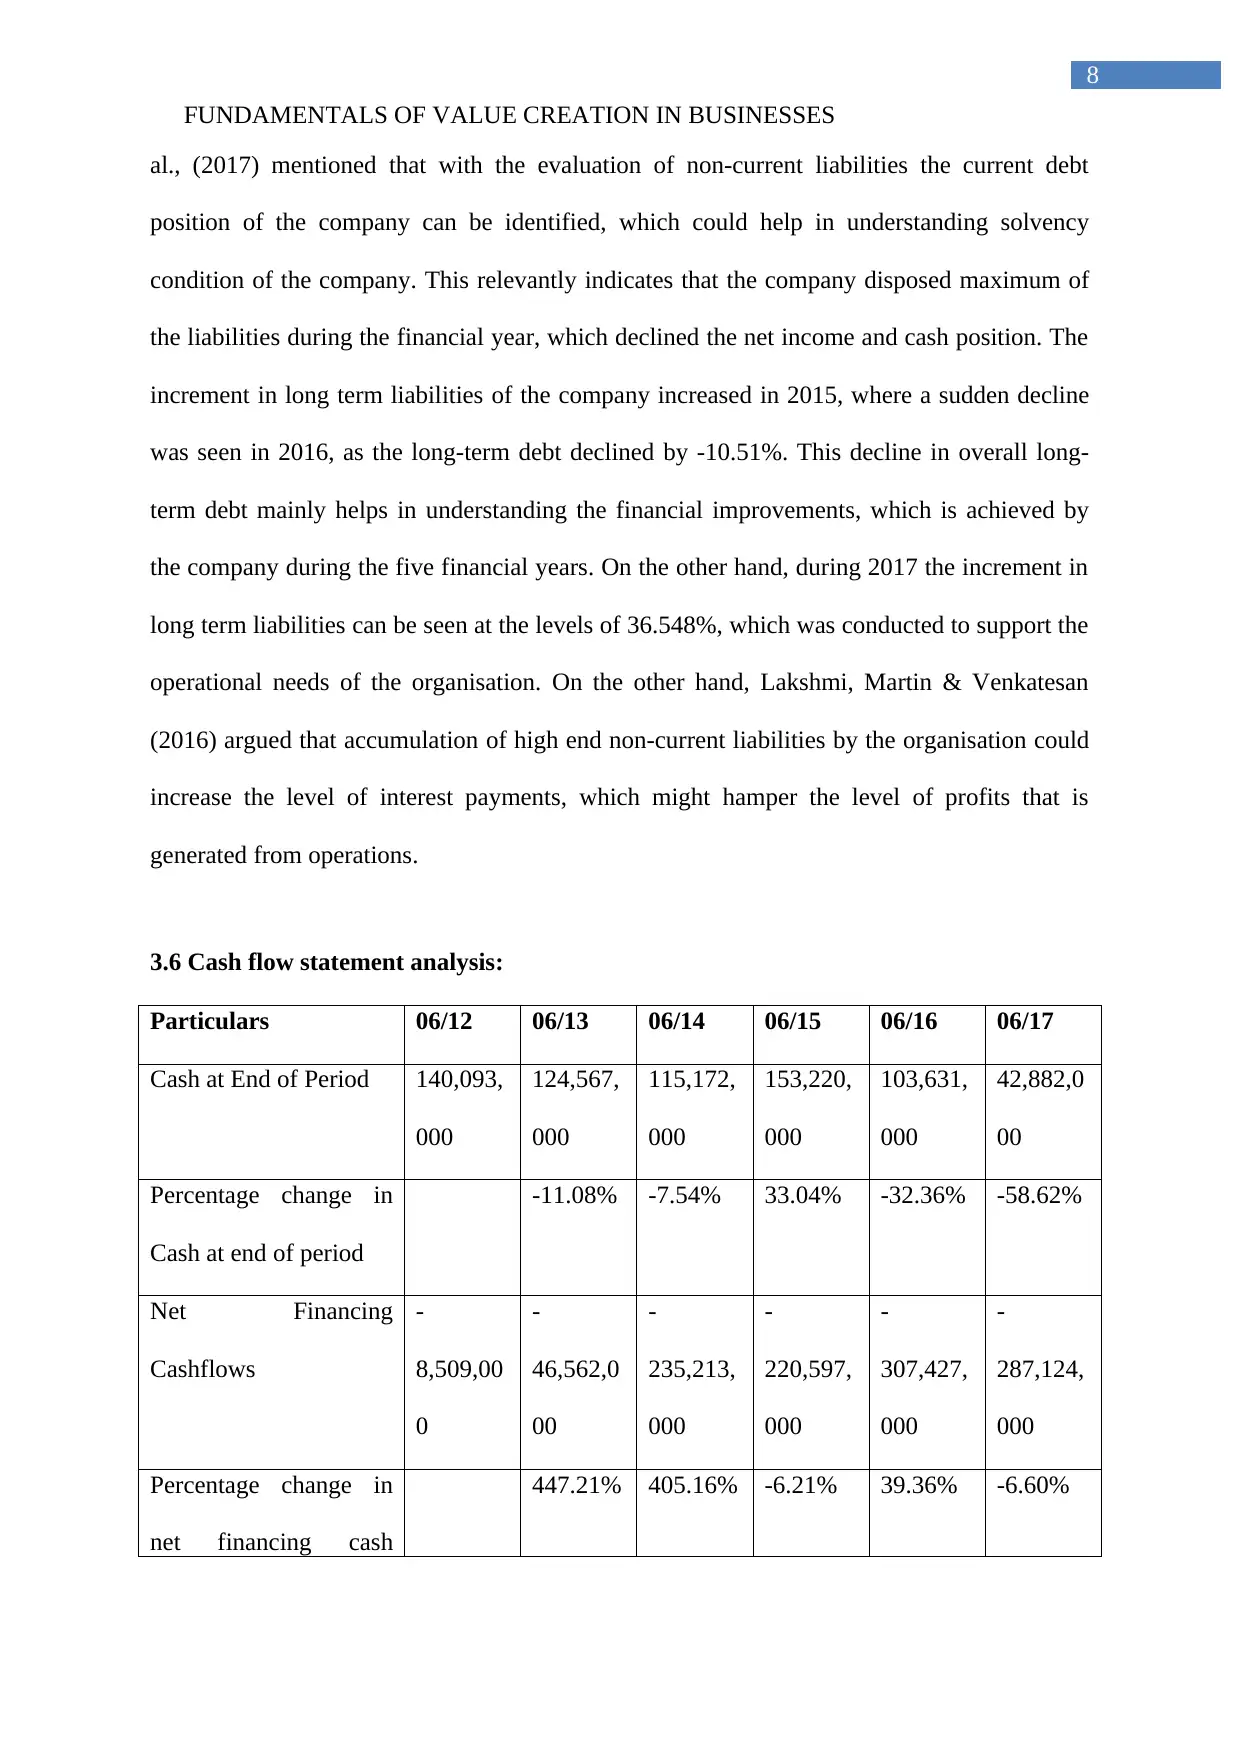
al., (2017) mentioned that with the evaluation of non-current liabilities the current debt
position of the company can be identified, which could help in understanding solvency
condition of the company. This relevantly indicates that the company disposed maximum of
the liabilities during the financial year, which declined the net income and cash position. The
increment in long term liabilities of the company increased in 2015, where a sudden decline
was seen in 2016, as the long-term debt declined by -10.51%. This decline in overall long-
term debt mainly helps in understanding the financial improvements, which is achieved by
the company during the five financial years. On the other hand, during 2017 the increment in
long term liabilities can be seen at the levels of 36.548%, which was conducted to support the
operational needs of the organisation. On the other hand, Lakshmi, Martin & Venkatesan
(2016) argued that accumulation of high end non-current liabilities by the organisation could
increase the level of interest payments, which might hamper the level of profits that is
generated from operations.
3.6 Cash flow statement analysis:
Particulars 06/12 06/13 06/14 06/15 06/16 06/17
Cash at End of Period 140,093,
000
124,567,
000
115,172,
000
153,220,
000
103,631,
000
42,882,0
00
Percentage change in
Cash at end of period
-11.08% -7.54% 33.04% -32.36% -58.62%
Net Financing
Cashflows
-
8,509,00
0
-
46,562,0
00
-
235,213,
000
-
220,597,
000
-
307,427,
000
-
287,124,
000
Percentage change in
net financing cash
447.21% 405.16% -6.21% 39.36% -6.60%
8
al., (2017) mentioned that with the evaluation of non-current liabilities the current debt
position of the company can be identified, which could help in understanding solvency
condition of the company. This relevantly indicates that the company disposed maximum of
the liabilities during the financial year, which declined the net income and cash position. The
increment in long term liabilities of the company increased in 2015, where a sudden decline
was seen in 2016, as the long-term debt declined by -10.51%. This decline in overall long-
term debt mainly helps in understanding the financial improvements, which is achieved by
the company during the five financial years. On the other hand, during 2017 the increment in
long term liabilities can be seen at the levels of 36.548%, which was conducted to support the
operational needs of the organisation. On the other hand, Lakshmi, Martin & Venkatesan
(2016) argued that accumulation of high end non-current liabilities by the organisation could
increase the level of interest payments, which might hamper the level of profits that is
generated from operations.
3.6 Cash flow statement analysis:
Particulars 06/12 06/13 06/14 06/15 06/16 06/17
Cash at End of Period 140,093,
000
124,567,
000
115,172,
000
153,220,
000
103,631,
000
42,882,0
00
Percentage change in
Cash at end of period
-11.08% -7.54% 33.04% -32.36% -58.62%
Net Financing
Cashflows
-
8,509,00
0
-
46,562,0
00
-
235,213,
000
-
220,597,
000
-
307,427,
000
-
287,124,
000
Percentage change in
net financing cash
447.21% 405.16% -6.21% 39.36% -6.60%
⊘ This is a preview!⊘
Do you want full access?
Subscribe today to unlock all pages.
Trusted by 1+ million students worldwide
FUNDAMENTALS OF VALUE CREATION IN BUSINESSES
9
flows
06/12 06/13 06/14 06/15 06/16 06/17
0
20,000,000
40,000,000
60,000,000
80,000,000
100,000,000
120,000,000
140,000,000
160,000,000
180,000,000
-80.00%
-60.00%
-40.00%
-20.00%
0.00%
20.00%
40.00%
Percentage change in Cash at end of period
Cash at End of Period Percentage change in Cash at end of period
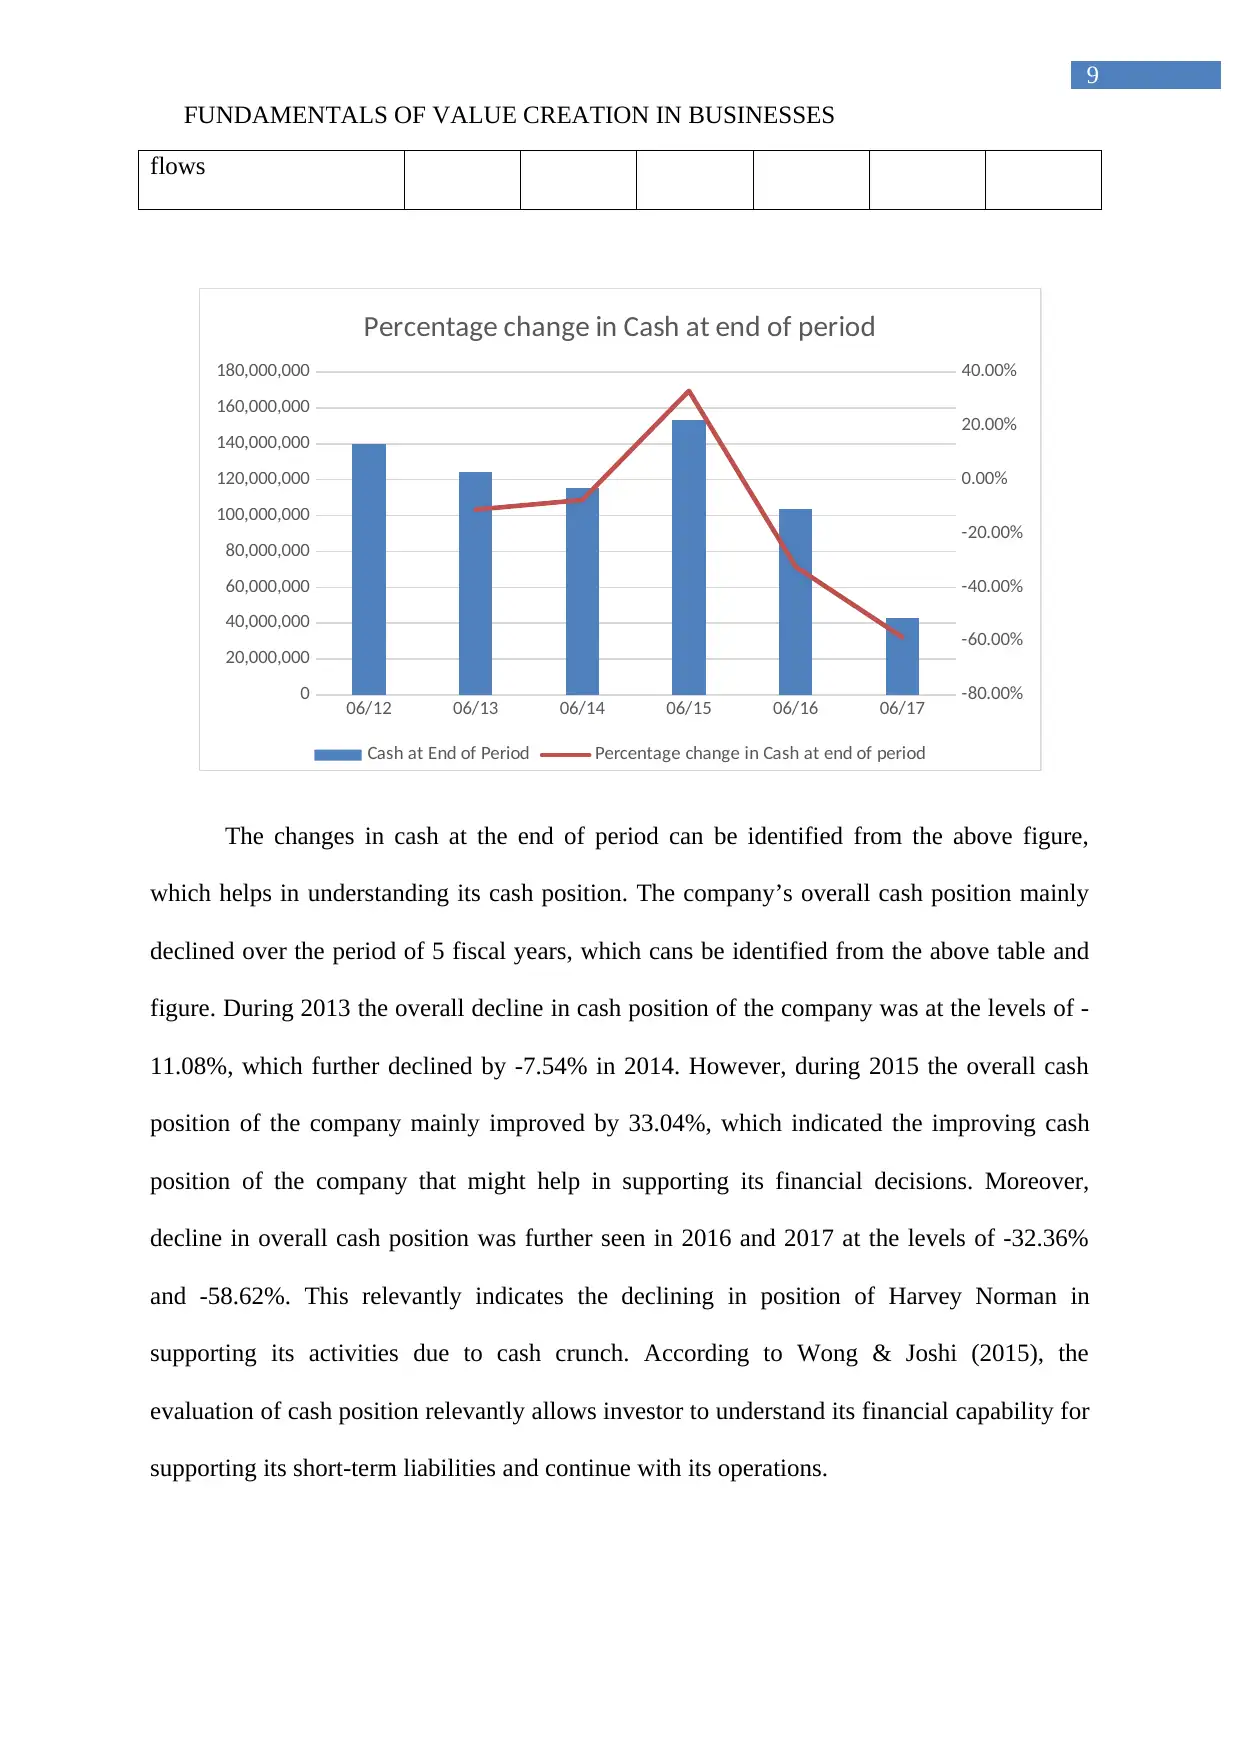
The changes in cash at the end of period can be identified from the above figure,
which helps in understanding its cash position. The company’s overall cash position mainly
declined over the period of 5 fiscal years, which cans be identified from the above table and
figure. During 2013 the overall decline in cash position of the company was at the levels of -
11.08%, which further declined by -7.54% in 2014. However, during 2015 the overall cash
position of the company mainly improved by 33.04%, which indicated the improving cash
position of the company that might help in supporting its financial decisions. Moreover,
decline in overall cash position was further seen in 2016 and 2017 at the levels of -32.36%
and -58.62%. This relevantly indicates the declining in position of Harvey Norman in
supporting its activities due to cash crunch. According to Wong & Joshi (2015), the
evaluation of cash position relevantly allows investor to understand its financial capability for
supporting its short-term liabilities and continue with its operations.
9
flows
06/12 06/13 06/14 06/15 06/16 06/17
0
20,000,000
40,000,000
60,000,000
80,000,000
100,000,000
120,000,000
140,000,000
160,000,000
180,000,000
-80.00%
-60.00%
-40.00%
-20.00%
0.00%
20.00%
40.00%
Percentage change in Cash at end of period
Cash at End of Period Percentage change in Cash at end of period
The changes in cash at the end of period can be identified from the above figure,
which helps in understanding its cash position. The company’s overall cash position mainly
declined over the period of 5 fiscal years, which cans be identified from the above table and
figure. During 2013 the overall decline in cash position of the company was at the levels of -
11.08%, which further declined by -7.54% in 2014. However, during 2015 the overall cash
position of the company mainly improved by 33.04%, which indicated the improving cash
position of the company that might help in supporting its financial decisions. Moreover,
decline in overall cash position was further seen in 2016 and 2017 at the levels of -32.36%
and -58.62%. This relevantly indicates the declining in position of Harvey Norman in
supporting its activities due to cash crunch. According to Wong & Joshi (2015), the
evaluation of cash position relevantly allows investor to understand its financial capability for
supporting its short-term liabilities and continue with its operations.
Paraphrase This Document
Need a fresh take? Get an instant paraphrase of this document with our AI Paraphraser
FUNDAMENTALS OF VALUE CREATION IN BUSINESSES
10
Therefore, it could be understood that cash position of the Harvey Norman mainly
declined over the period of 5 years, which relevantly reduces its ability to conduct smooth
operations. This continuous decline in cash position during 2013, 2014, 2016 and 2017 is
mainly complemented with the rising in net assets. This relevantly indicates that Harvey
Norman has used its spare cash to purchase relevant assets for complementing the increment
in assets such as property, plant, and equipment. Hence, it could be understood that decline in
cash position of Harvey Norman is supported by the increment in total assets, which is used
to improve its operational capability. On the other hand, Wijesundera et al., (2015) argued
that the evaluation of cash position does not allow investors to gauge into the financial
growth and progress, which could be obtained by the company in near future.
06/12 06/13 06/14 06/15 06/16 06/17
-350,000,000
-300,000,000
-250,000,000
-200,000,000
-150,000,000
-100,000,000
-50,000,000
0
-100.00%
0.00%
100.00%
200.00%
300.00%
400.00%
500.00%
Percentage change in net financing cash flows
Net Financing Cashflows Percentage change in net financing cash flows
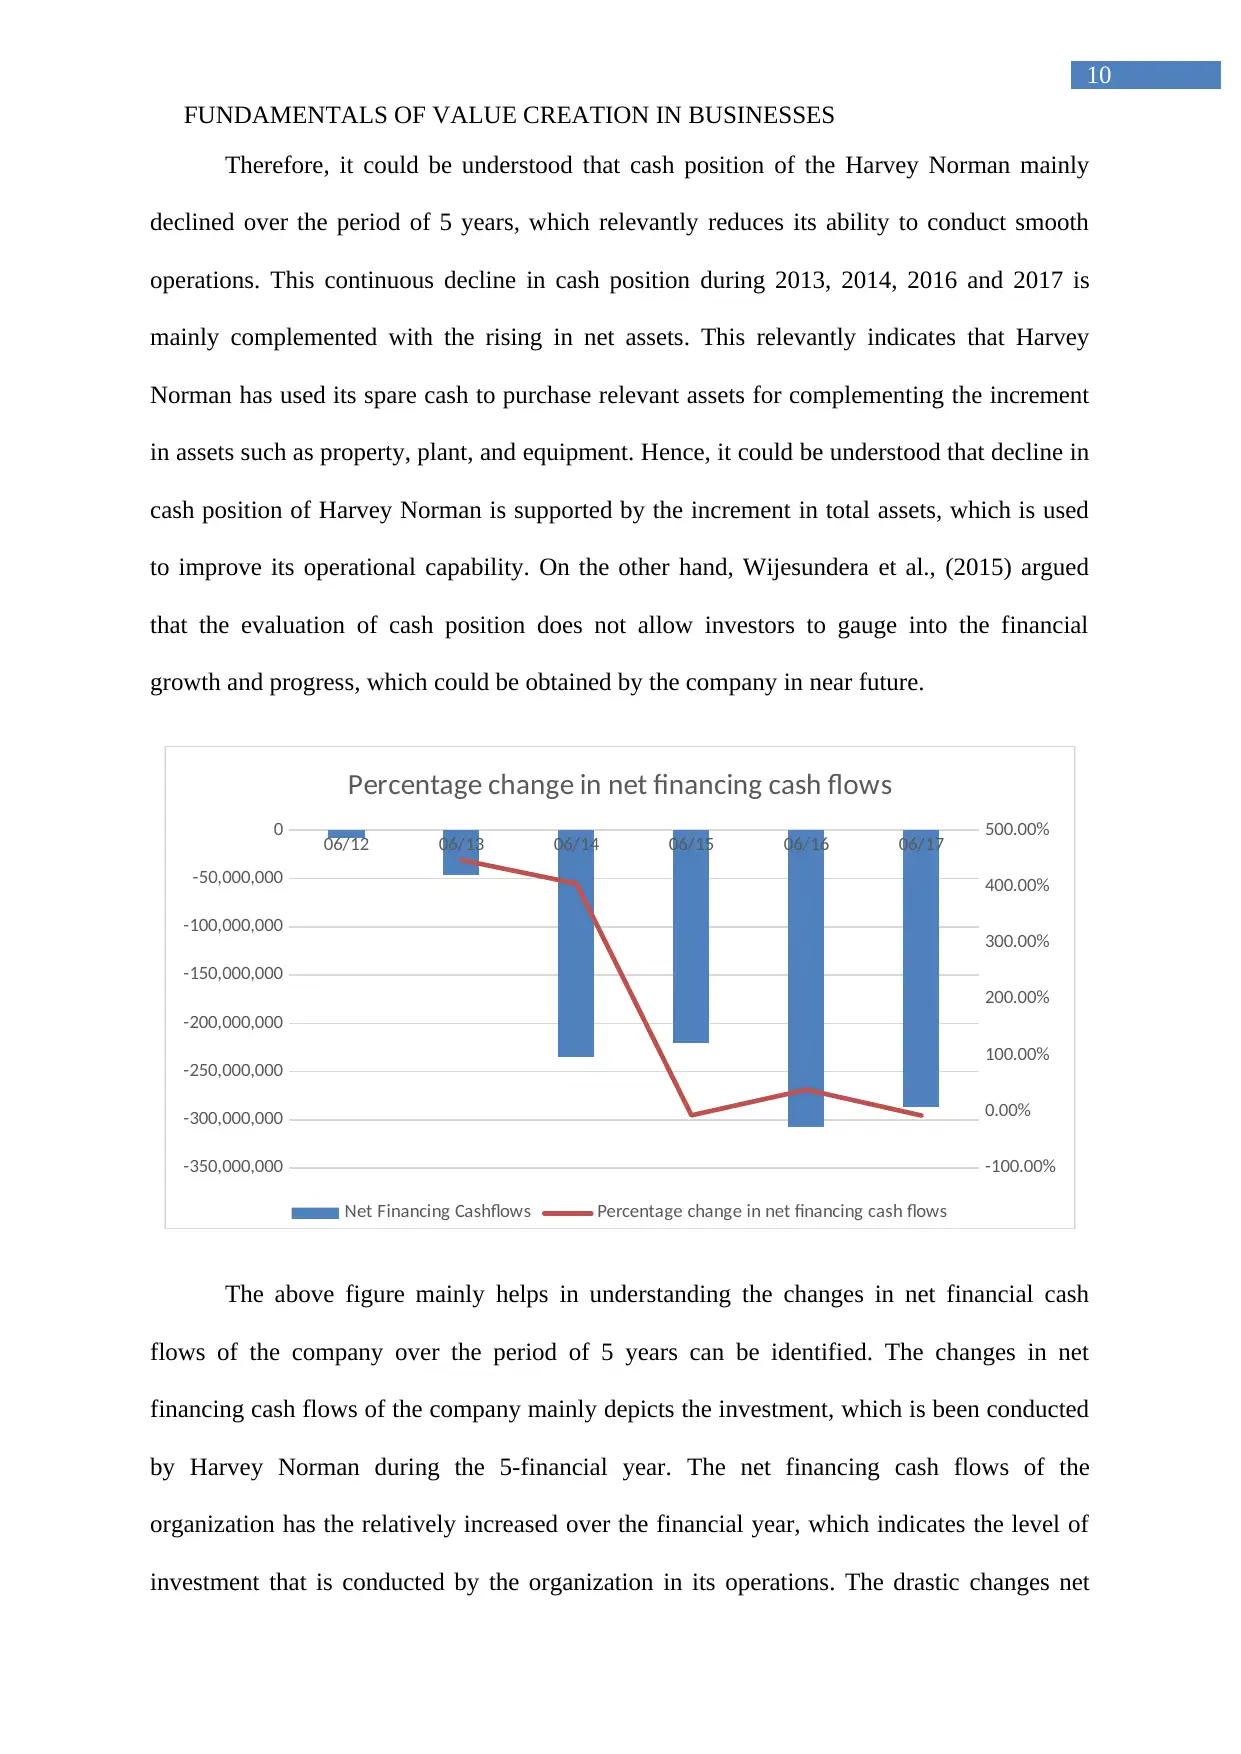
The above figure mainly helps in understanding the changes in net financial cash
flows of the company over the period of 5 years can be identified. The changes in net
financing cash flows of the company mainly depicts the investment, which is been conducted
by Harvey Norman during the 5-financial year. The net financing cash flows of the
organization has the relatively increased over the financial year, which indicates the level of
investment that is conducted by the organization in its operations. The drastic changes net
10
Therefore, it could be understood that cash position of the Harvey Norman mainly
declined over the period of 5 years, which relevantly reduces its ability to conduct smooth
operations. This continuous decline in cash position during 2013, 2014, 2016 and 2017 is
mainly complemented with the rising in net assets. This relevantly indicates that Harvey
Norman has used its spare cash to purchase relevant assets for complementing the increment
in assets such as property, plant, and equipment. Hence, it could be understood that decline in
cash position of Harvey Norman is supported by the increment in total assets, which is used
to improve its operational capability. On the other hand, Wijesundera et al., (2015) argued
that the evaluation of cash position does not allow investors to gauge into the financial
growth and progress, which could be obtained by the company in near future.
06/12 06/13 06/14 06/15 06/16 06/17
-350,000,000
-300,000,000
-250,000,000
-200,000,000
-150,000,000
-100,000,000
-50,000,000
0
-100.00%
0.00%
100.00%
200.00%
300.00%
400.00%
500.00%
Percentage change in net financing cash flows
Net Financing Cashflows Percentage change in net financing cash flows
The above figure mainly helps in understanding the changes in net financial cash
flows of the company over the period of 5 years can be identified. The changes in net
financing cash flows of the company mainly depicts the investment, which is been conducted
by Harvey Norman during the 5-financial year. The net financing cash flows of the
organization has the relatively increased over the financial year, which indicates the level of
investment that is conducted by the organization in its operations. The drastic changes net
FUNDAMENTALS OF VALUE CREATION IN BUSINESSES
11
financing cash flows was seen you during 2013, where the percentage change in client to
447.21%. Moreover, the continuous increment in investment is seen in 2014 with a total
percentage change in investments of 405.16%. However, during 2015 the overall investment
growth mainly declined to -6.21%, which indicated it slow growth and investment capability
of the company to support its operations. Moreover, the net financing cash flows conducted
by Harvey Norman continue to during 2016, which was again halted in 2017, as the change in
percentage of Financing cash flow became -6.60%. In this context, Choi, Kim & Oh (2017)
stated that with the evaluation of cash flow statement the overall financial capability of the
organization can be identified, which is essential for investors while making relevant
investment decisions.
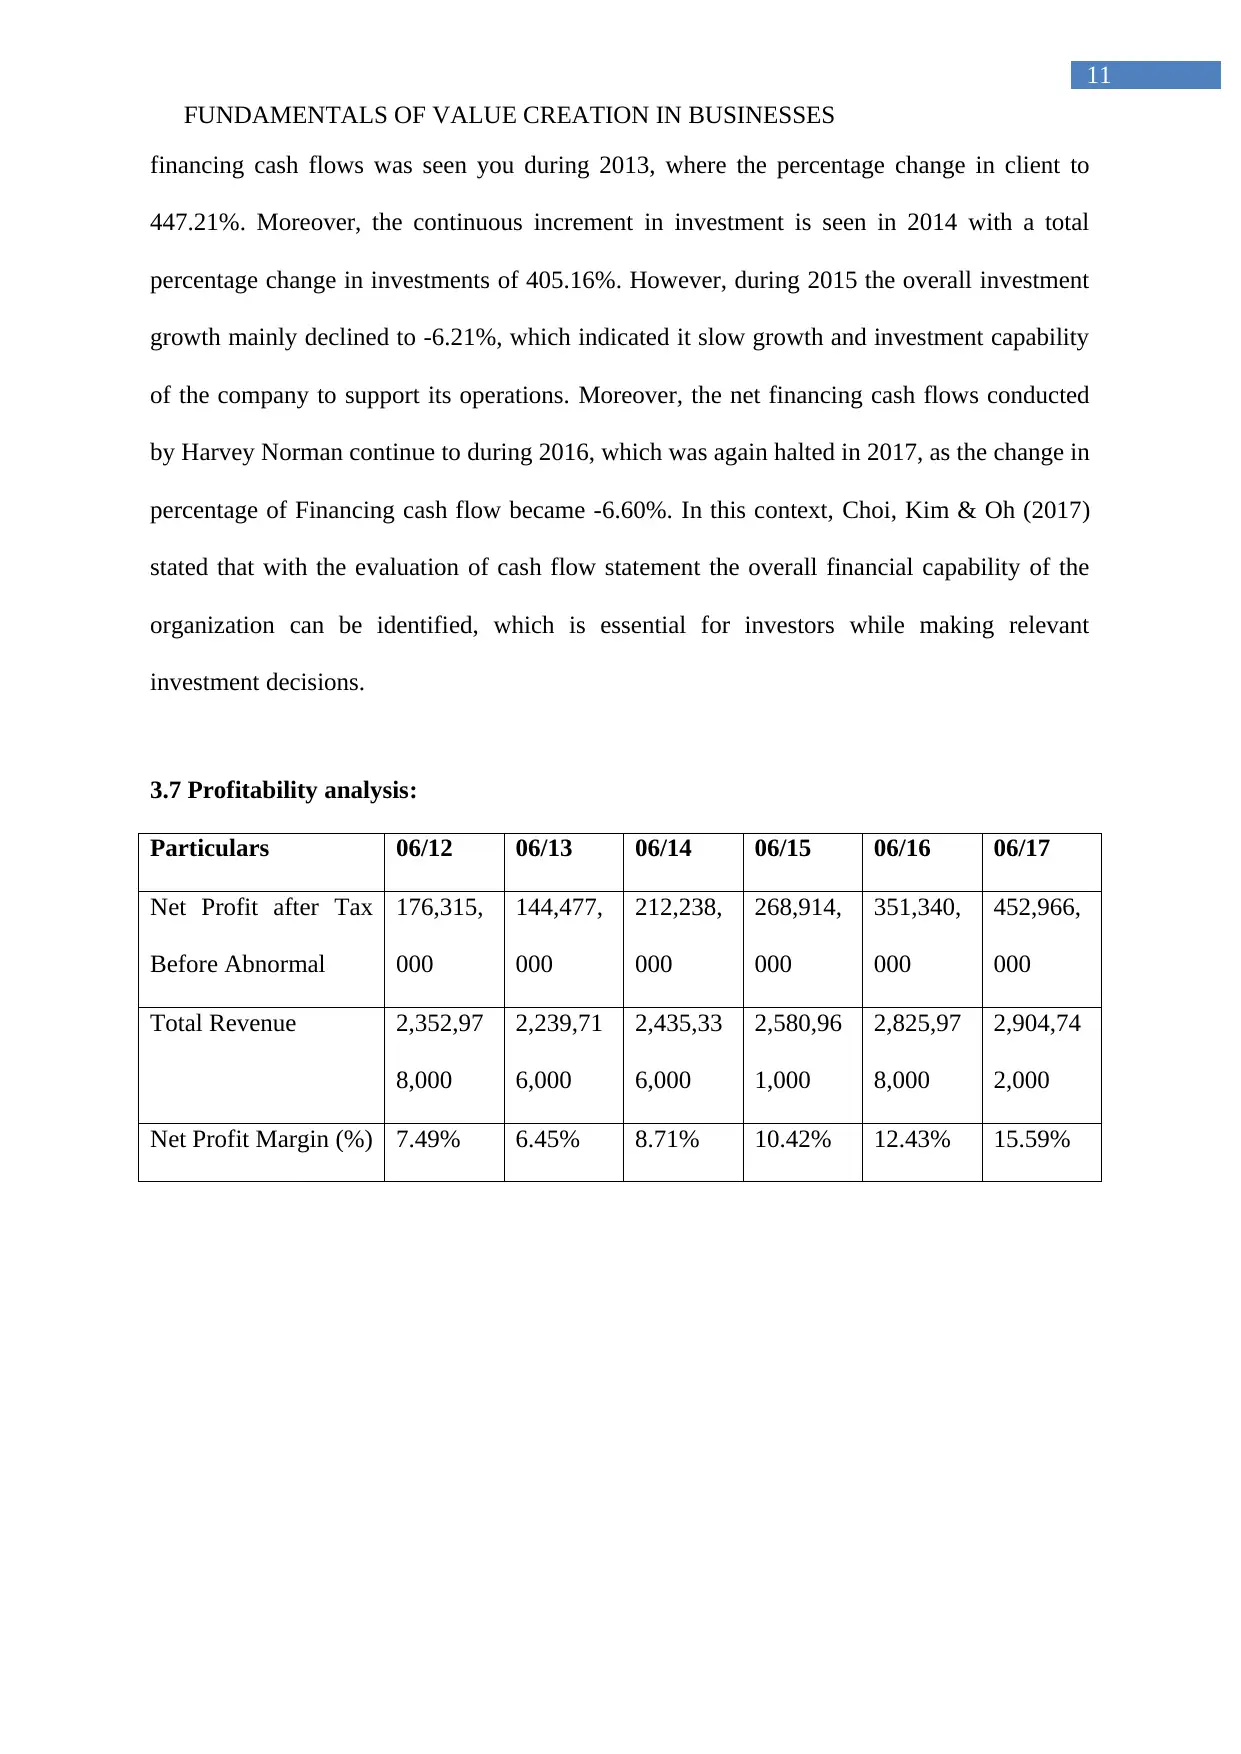
3.7 Profitability analysis:
Particulars 06/12 06/13 06/14 06/15 06/16 06/17
Net Profit after Tax
Before Abnormal
176,315,
000
144,477,
000
212,238,
000
268,914,
000
351,340,
000
452,966,
000
Total Revenue 2,352,97
8,000
2,239,71
6,000
2,435,33
6,000
2,580,96
1,000
2,825,97
8,000
2,904,74
2,000
Net Profit Margin (%) 7.49% 6.45% 8.71% 10.42% 12.43% 15.59%
11
financing cash flows was seen you during 2013, where the percentage change in client to
447.21%. Moreover, the continuous increment in investment is seen in 2014 with a total
percentage change in investments of 405.16%. However, during 2015 the overall investment
growth mainly declined to -6.21%, which indicated it slow growth and investment capability
of the company to support its operations. Moreover, the net financing cash flows conducted
by Harvey Norman continue to during 2016, which was again halted in 2017, as the change in
percentage of Financing cash flow became -6.60%. In this context, Choi, Kim & Oh (2017)
stated that with the evaluation of cash flow statement the overall financial capability of the
organization can be identified, which is essential for investors while making relevant
investment decisions.
3.7 Profitability analysis:
Particulars 06/12 06/13 06/14 06/15 06/16 06/17
Net Profit after Tax
Before Abnormal
176,315,
000
144,477,
000
212,238,
000
268,914,
000
351,340,
000
452,966,
000
Total Revenue 2,352,97
8,000
2,239,71
6,000
2,435,33
6,000
2,580,96
1,000
2,825,97
8,000
2,904,74
2,000
Net Profit Margin (%) 7.49% 6.45% 8.71% 10.42% 12.43% 15.59%
⊘ This is a preview!⊘
Do you want full access?
Subscribe today to unlock all pages.
Trusted by 1+ million students worldwide
1 out of 28
Related Documents


Your All-in-One AI-Powered Toolkit for Academic Success.
+13062052269
info@desklib.com
Available 24*7 on WhatsApp / Email
![[object Object]](/_next/static/media/star-bottom.7253800d.svg)
Unlock your academic potential
Copyright © 2020–2026 A2Z Services. All Rights Reserved. Developed and managed by ZUCOL.