Analysis of BMW's Value Stream Mapping and Improvement
VerifiedAdded on 2022/09/09
|12
|2358
|16
Report
AI Summary
This report provides a detailed analysis of BMW's production process using value stream mapping. It identifies areas of waste and inefficiency within the manufacturing of a bumper, focusing on buffer storage, preparation, and time capacity utilization. The report includes a current state value stream map and proposes improvements, such as eliminating buffer storage and optimizing transition times. It also suggests the implementation of the 5S Kaizen methodology and SMED model. The report highlights the benefits of these improvements, leading to reduced non-value-added time, increased production efficiency, and better capacity utilization. The analysis includes an executive summary, introduction, current state value stream map, potential areas of improvement, and a value stream map after improvements. Finally, the report provides a conclusion and references.
Value Stream Mapping 1
VALUE STREAM MAPPING
By (Name)
Course
Professor’s Name
Institution
Date
VALUE STREAM MAPPING
By (Name)
Course
Professor’s Name
Institution
Date
Paraphrase This Document
Need a fresh take? Get an instant paraphrase of this document with our AI Paraphraser
Value Stream Mapping 2
Contents
Executive Summary.............................................................................................................3
Introduction..........................................................................................................................4
Value stream map of BMW (Current State)........................................................................4
Potential Areas of Improvement..........................................................................................5
Buffer storage...................................................................................................................5
Preparation.......................................................................................................................6
Time capacity utilization..................................................................................................7
Areas to Improve On............................................................................................................8
Value stream Map after Improvements................................................................................8
Conclusion...........................................................................................................................9
References..........................................................................................................................10
Value Stream Mapping 3
Executive Summary
This report explores the automotive manufacturing industry. Specifically, the report
explores the value addition chain in Automotive manufacturing systems focusing on the single
process of manufacturing a bumper. The report identifies, analyses, and proposes the
implementation of improvements to specific processes of the production process.
⊘ This is a preview!⊘
Do you want full access?
Subscribe today to unlock all pages.
Trusted by 1+ million students worldwide
Value Stream Mapping 4
VALUE STREAM MAPPING- THE CASE BMW.
Introduction
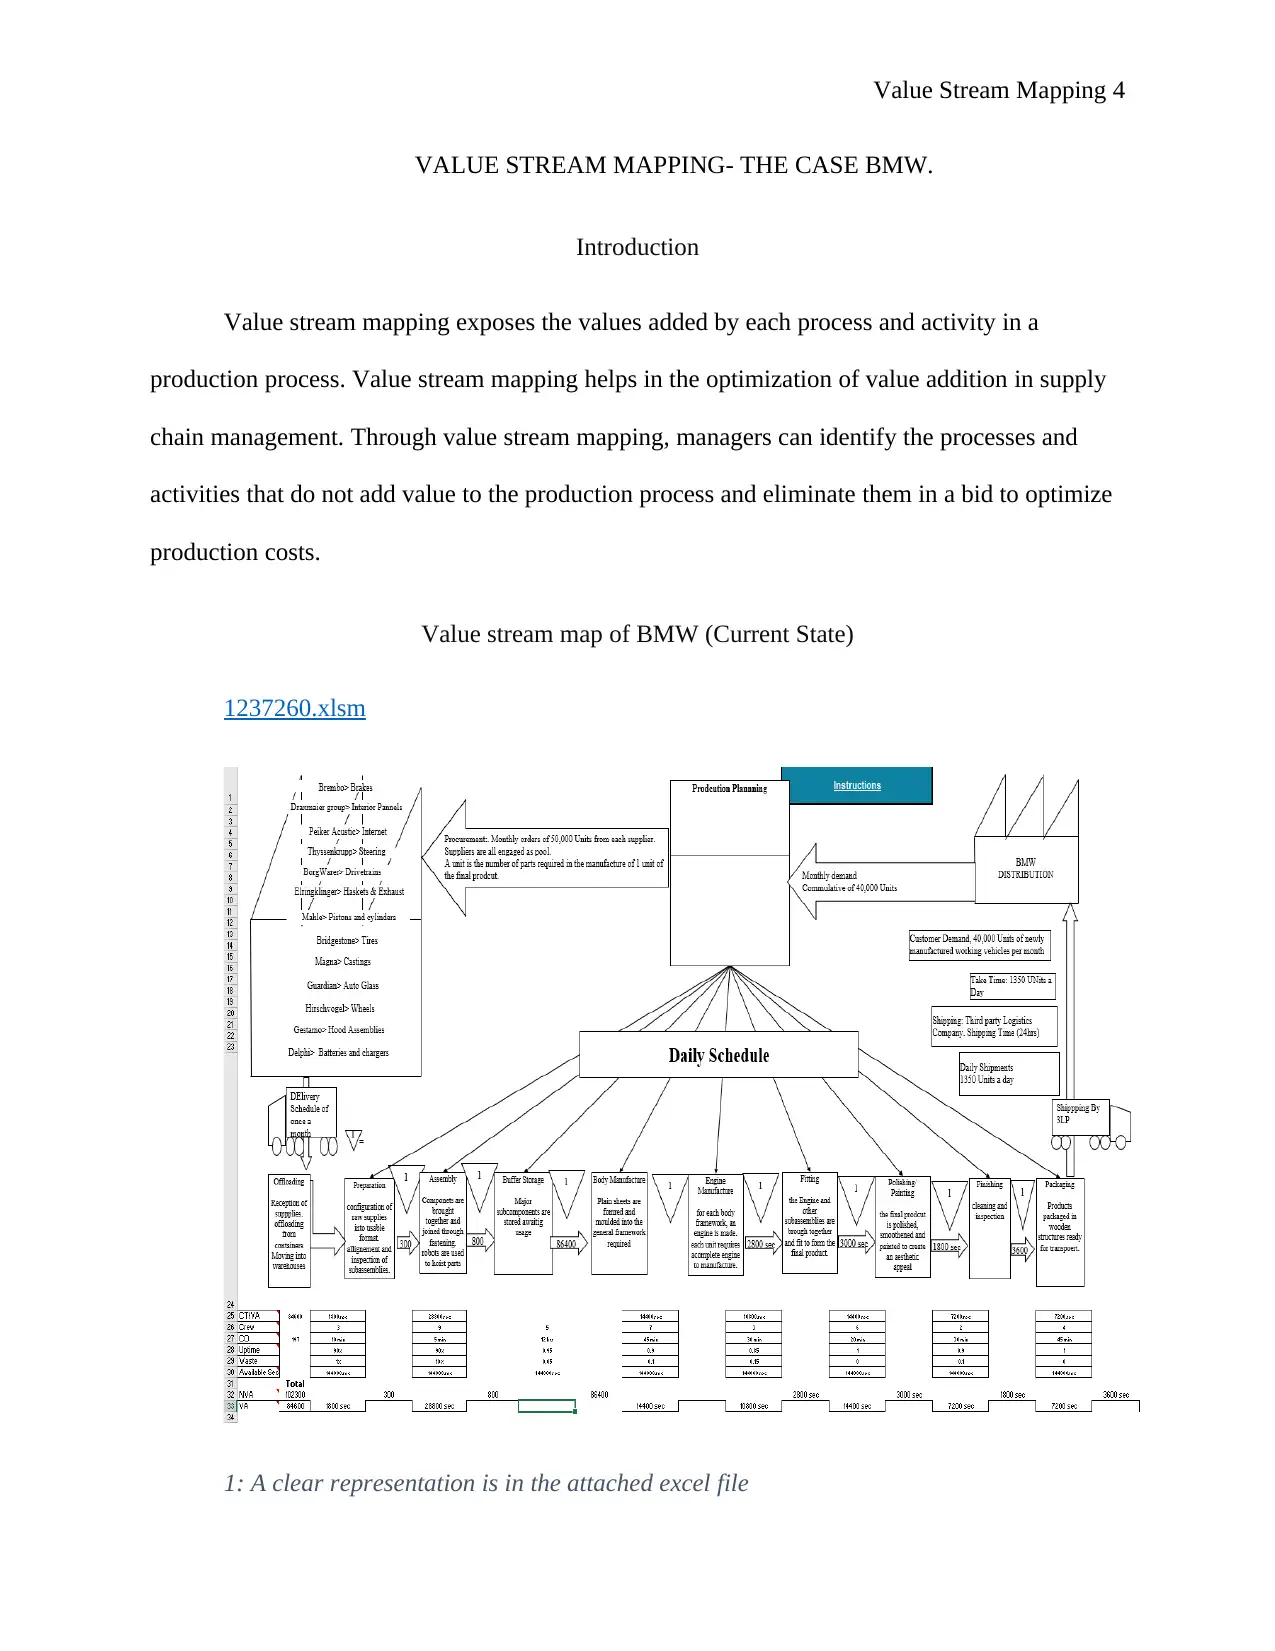
Value stream mapping exposes the values added by each process and activity in a
production process. Value stream mapping helps in the optimization of value addition in supply
chain management. Through value stream mapping, managers can identify the processes and
activities that do not add value to the production process and eliminate them in a bid to optimize
production costs.
Value stream map of BMW (Current State)
1237260.xlsm
1: A clear representation is in the attached excel file
VALUE STREAM MAPPING- THE CASE BMW.
Introduction
Value stream mapping exposes the values added by each process and activity in a
production process. Value stream mapping helps in the optimization of value addition in supply
chain management. Through value stream mapping, managers can identify the processes and
activities that do not add value to the production process and eliminate them in a bid to optimize
production costs.
Value stream map of BMW (Current State)
1237260.xlsm
1: A clear representation is in the attached excel file
Paraphrase This Document
Need a fresh take? Get an instant paraphrase of this document with our AI Paraphraser
Value Stream Mapping 5
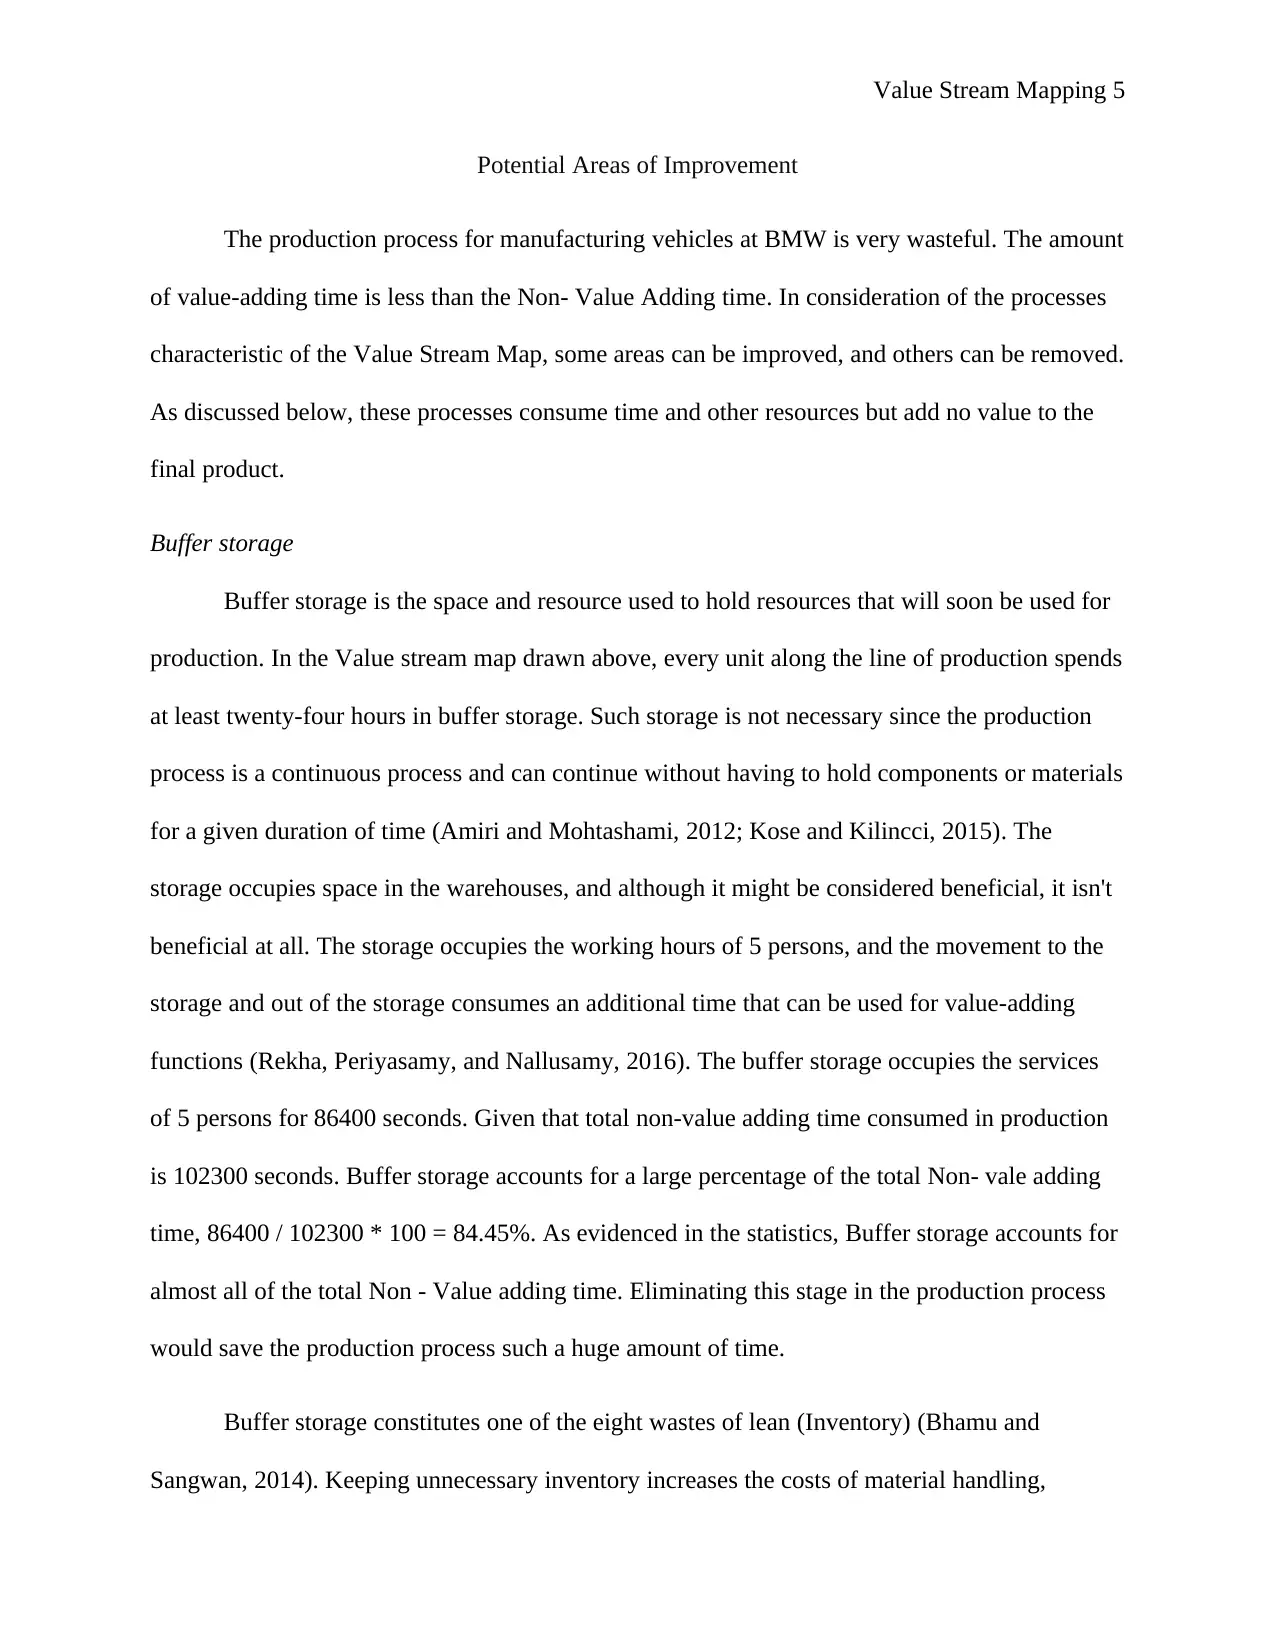
Potential Areas of Improvement
The production process for manufacturing vehicles at BMW is very wasteful. The amount
of value-adding time is less than the Non- Value Adding time. In consideration of the processes
characteristic of the Value Stream Map, some areas can be improved, and others can be removed.
As discussed below, these processes consume time and other resources but add no value to the
final product.
Buffer storage
Buffer storage is the space and resource used to hold resources that will soon be used for
production. In the Value stream map drawn above, every unit along the line of production spends
at least twenty-four hours in buffer storage. Such storage is not necessary since the production
process is a continuous process and can continue without having to hold components or materials
for a given duration of time (Amiri and Mohtashami, 2012; Kose and Kilincci, 2015). The
storage occupies space in the warehouses, and although it might be considered beneficial, it isn't
beneficial at all. The storage occupies the working hours of 5 persons, and the movement to the
storage and out of the storage consumes an additional time that can be used for value-adding
functions (Rekha, Periyasamy, and Nallusamy, 2016). The buffer storage occupies the services
of 5 persons for 86400 seconds. Given that total non-value adding time consumed in production
is 102300 seconds. Buffer storage accounts for a large percentage of the total Non- vale adding
time, 86400 / 102300 * 100 = 84.45%. As evidenced in the statistics, Buffer storage accounts for
almost all of the total Non - Value adding time. Eliminating this stage in the production process
would save the production process such a huge amount of time.
Buffer storage constitutes one of the eight wastes of lean (Inventory) (Bhamu and
Sangwan, 2014). Keeping unnecessary inventory increases the costs of material handling,
Value Stream Mapping 6
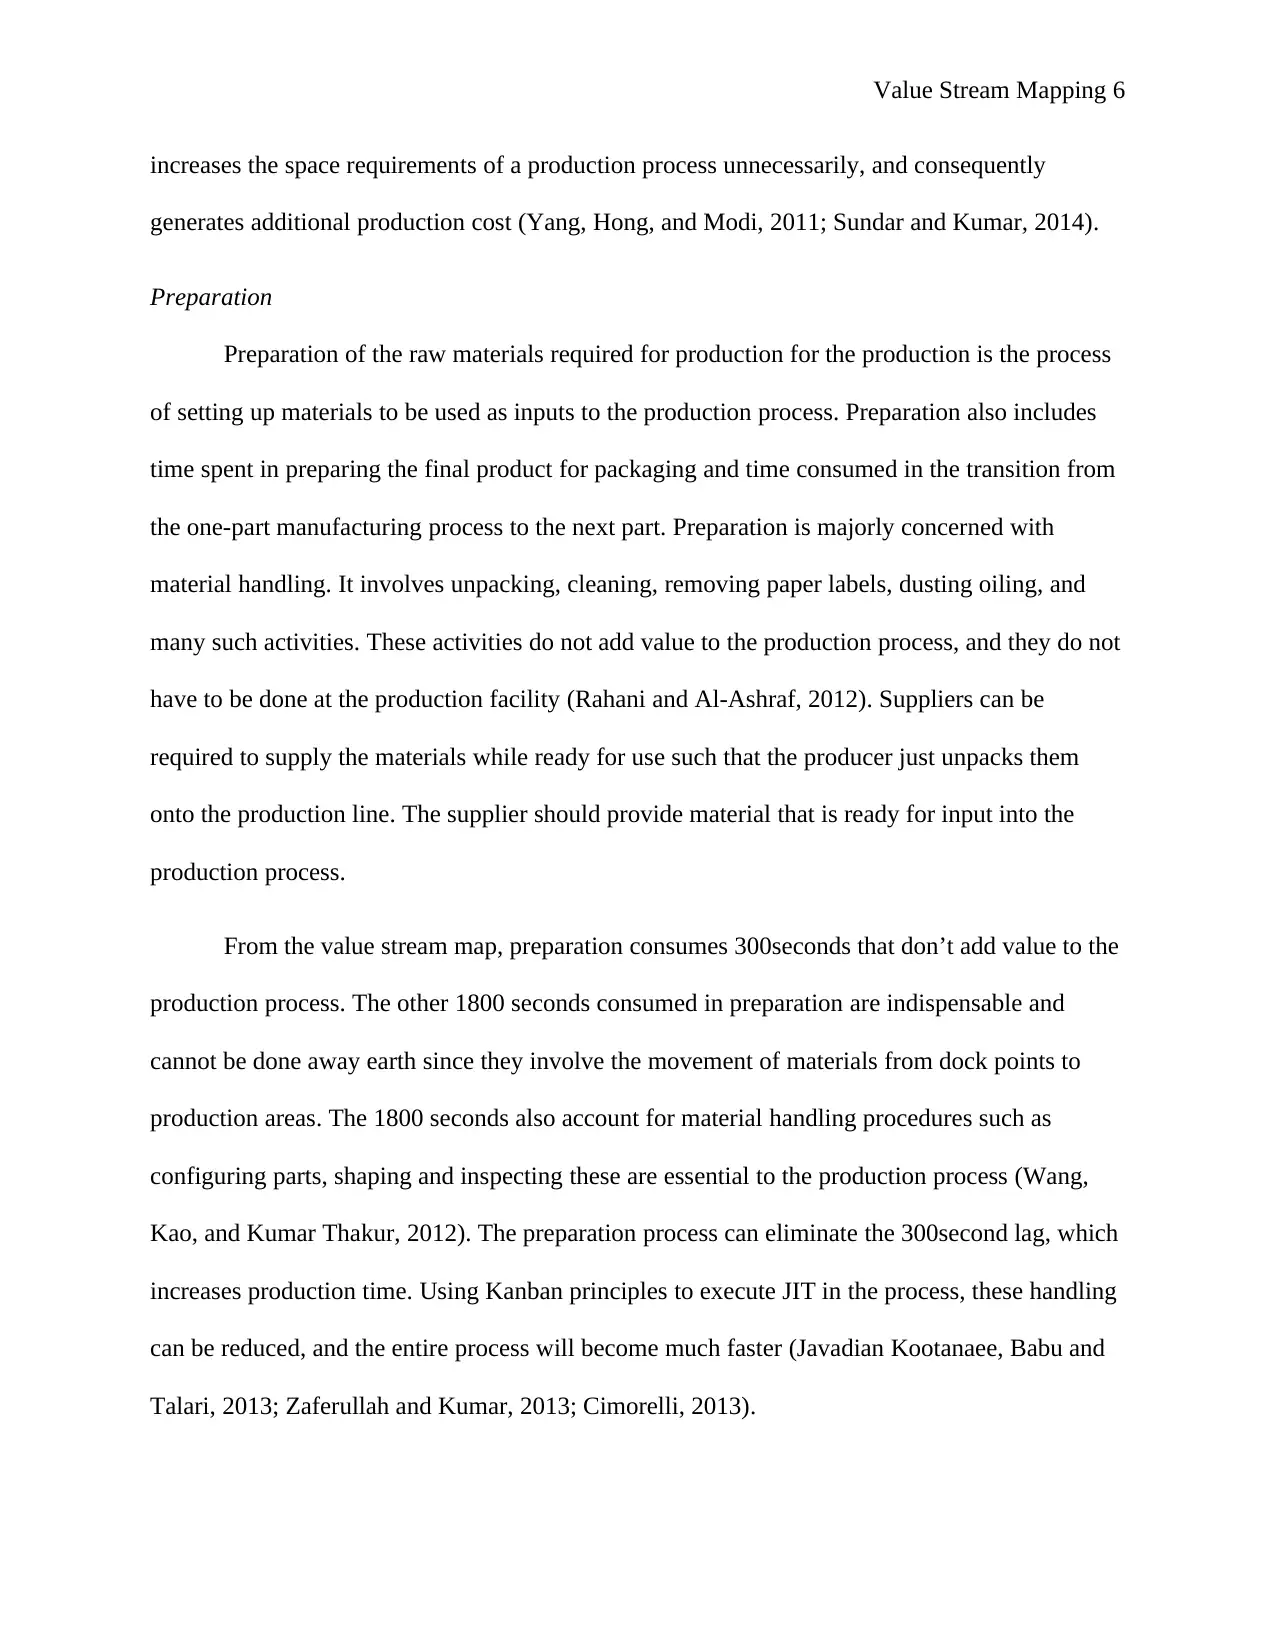
increases the space requirements of a production process unnecessarily, and consequently
generates additional production cost (Yang, Hong, and Modi, 2011; Sundar and Kumar, 2014).
Preparation
Preparation of the raw materials required for production for the production is the process
of setting up materials to be used as inputs to the production process. Preparation also includes
time spent in preparing the final product for packaging and time consumed in the transition from
the one-part manufacturing process to the next part. Preparation is majorly concerned with
material handling. It involves unpacking, cleaning, removing paper labels, dusting oiling, and
many such activities. These activities do not add value to the production process, and they do not
have to be done at the production facility (Rahani and Al-Ashraf, 2012). Suppliers can be
required to supply the materials while ready for use such that the producer just unpacks them
onto the production line. The supplier should provide material that is ready for input into the
production process.
From the value stream map, preparation consumes 300seconds that don’t add value to the
production process. The other 1800 seconds consumed in preparation are indispensable and
cannot be done away earth since they involve the movement of materials from dock points to
production areas. The 1800 seconds also account for material handling procedures such as
configuring parts, shaping and inspecting these are essential to the production process (Wang,
Kao, and Kumar Thakur, 2012). The preparation process can eliminate the 300second lag, which
increases production time. Using Kanban principles to execute JIT in the process, these handling
can be reduced, and the entire process will become much faster (Javadian Kootanaee, Babu and
Talari, 2013; Zaferullah and Kumar, 2013; Cimorelli, 2013).
⊘ This is a preview!⊘
Do you want full access?
Subscribe today to unlock all pages.
Trusted by 1+ million students worldwide
Value Stream Mapping 7
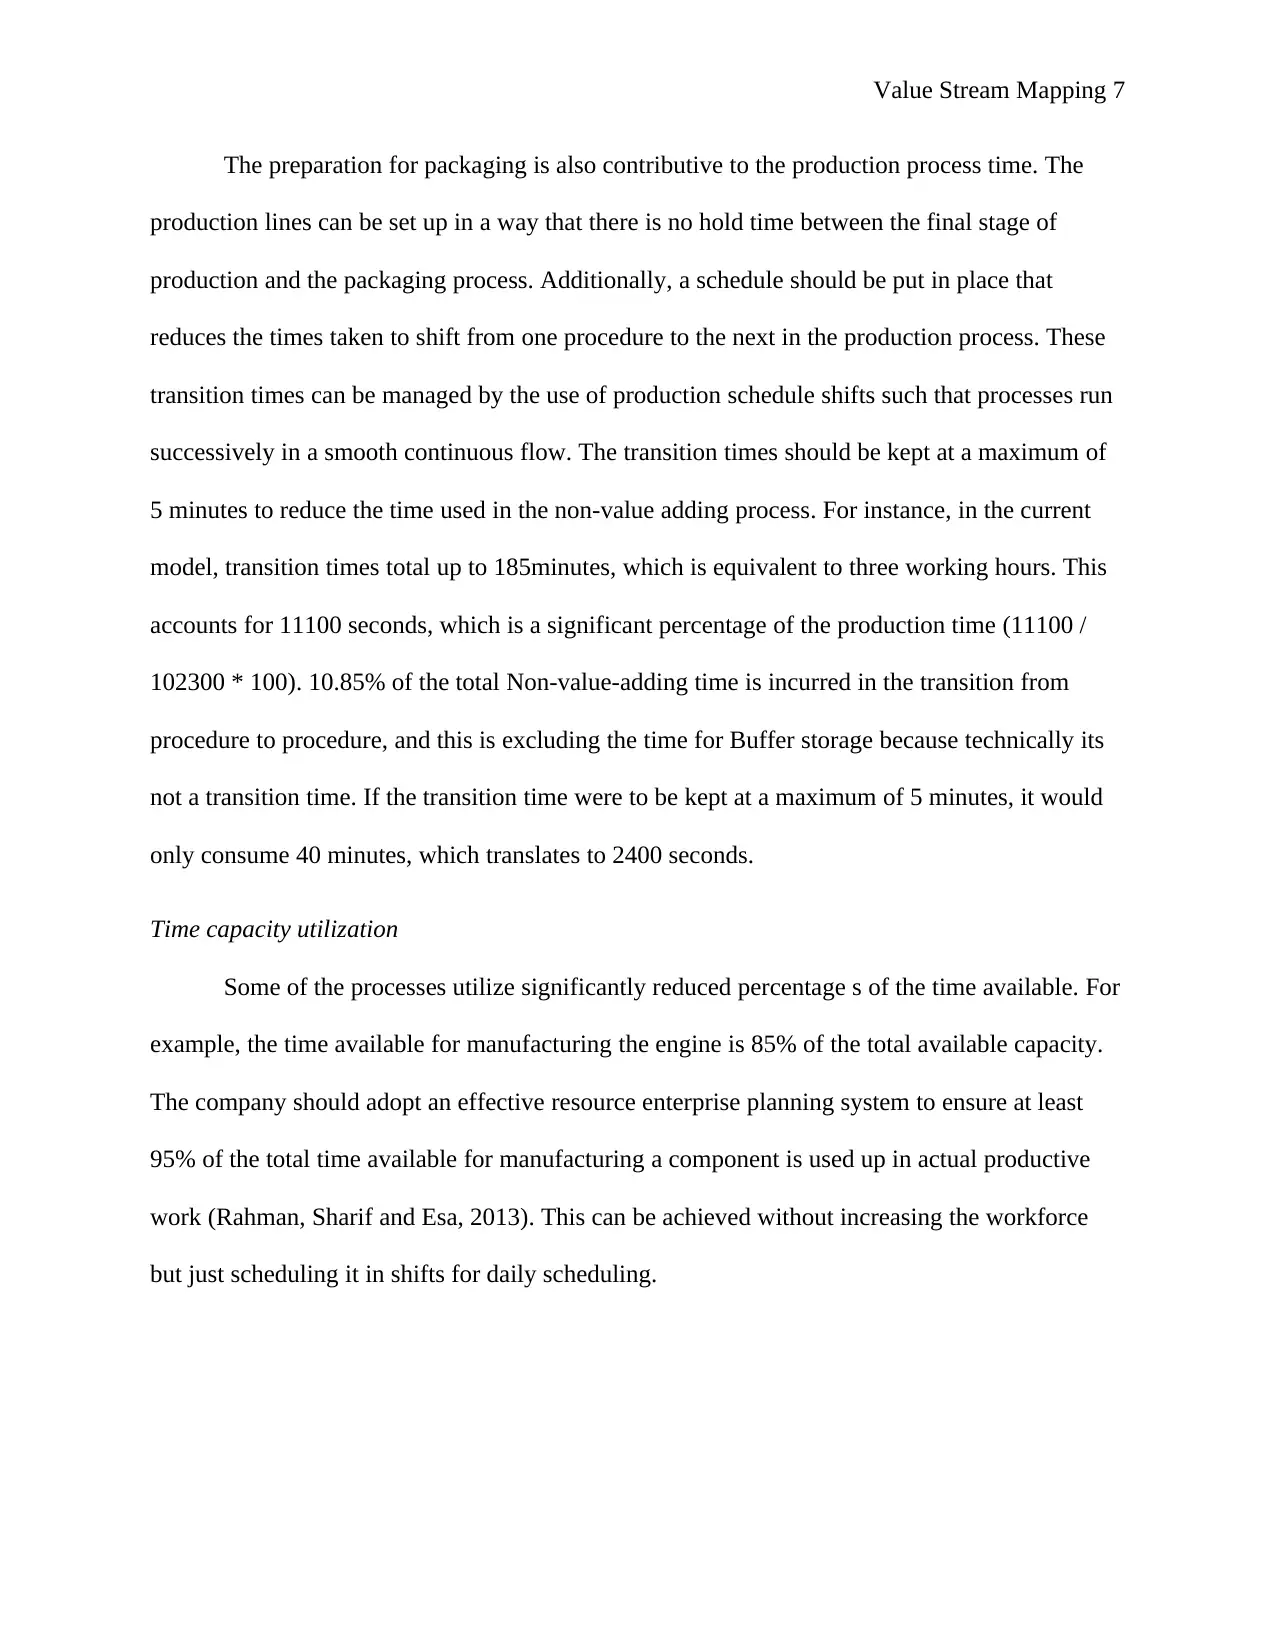
The preparation for packaging is also contributive to the production process time. The
production lines can be set up in a way that there is no hold time between the final stage of
production and the packaging process. Additionally, a schedule should be put in place that
reduces the times taken to shift from one procedure to the next in the production process. These
transition times can be managed by the use of production schedule shifts such that processes run
successively in a smooth continuous flow. The transition times should be kept at a maximum of
5 minutes to reduce the time used in the non-value adding process. For instance, in the current
model, transition times total up to 185minutes, which is equivalent to three working hours. This
accounts for 11100 seconds, which is a significant percentage of the production time (11100 /
102300 * 100). 10.85% of the total Non-value-adding time is incurred in the transition from
procedure to procedure, and this is excluding the time for Buffer storage because technically its
not a transition time. If the transition time were to be kept at a maximum of 5 minutes, it would
only consume 40 minutes, which translates to 2400 seconds.
Time capacity utilization
Some of the processes utilize significantly reduced percentage s of the time available. For
example, the time available for manufacturing the engine is 85% of the total available capacity.
The company should adopt an effective resource enterprise planning system to ensure at least
95% of the total time available for manufacturing a component is used up in actual productive
work (Rahman, Sharif and Esa, 2013). This can be achieved without increasing the workforce
but just scheduling it in shifts for daily scheduling.
Paraphrase This Document
Need a fresh take? Get an instant paraphrase of this document with our AI Paraphraser
Value Stream Mapping 8
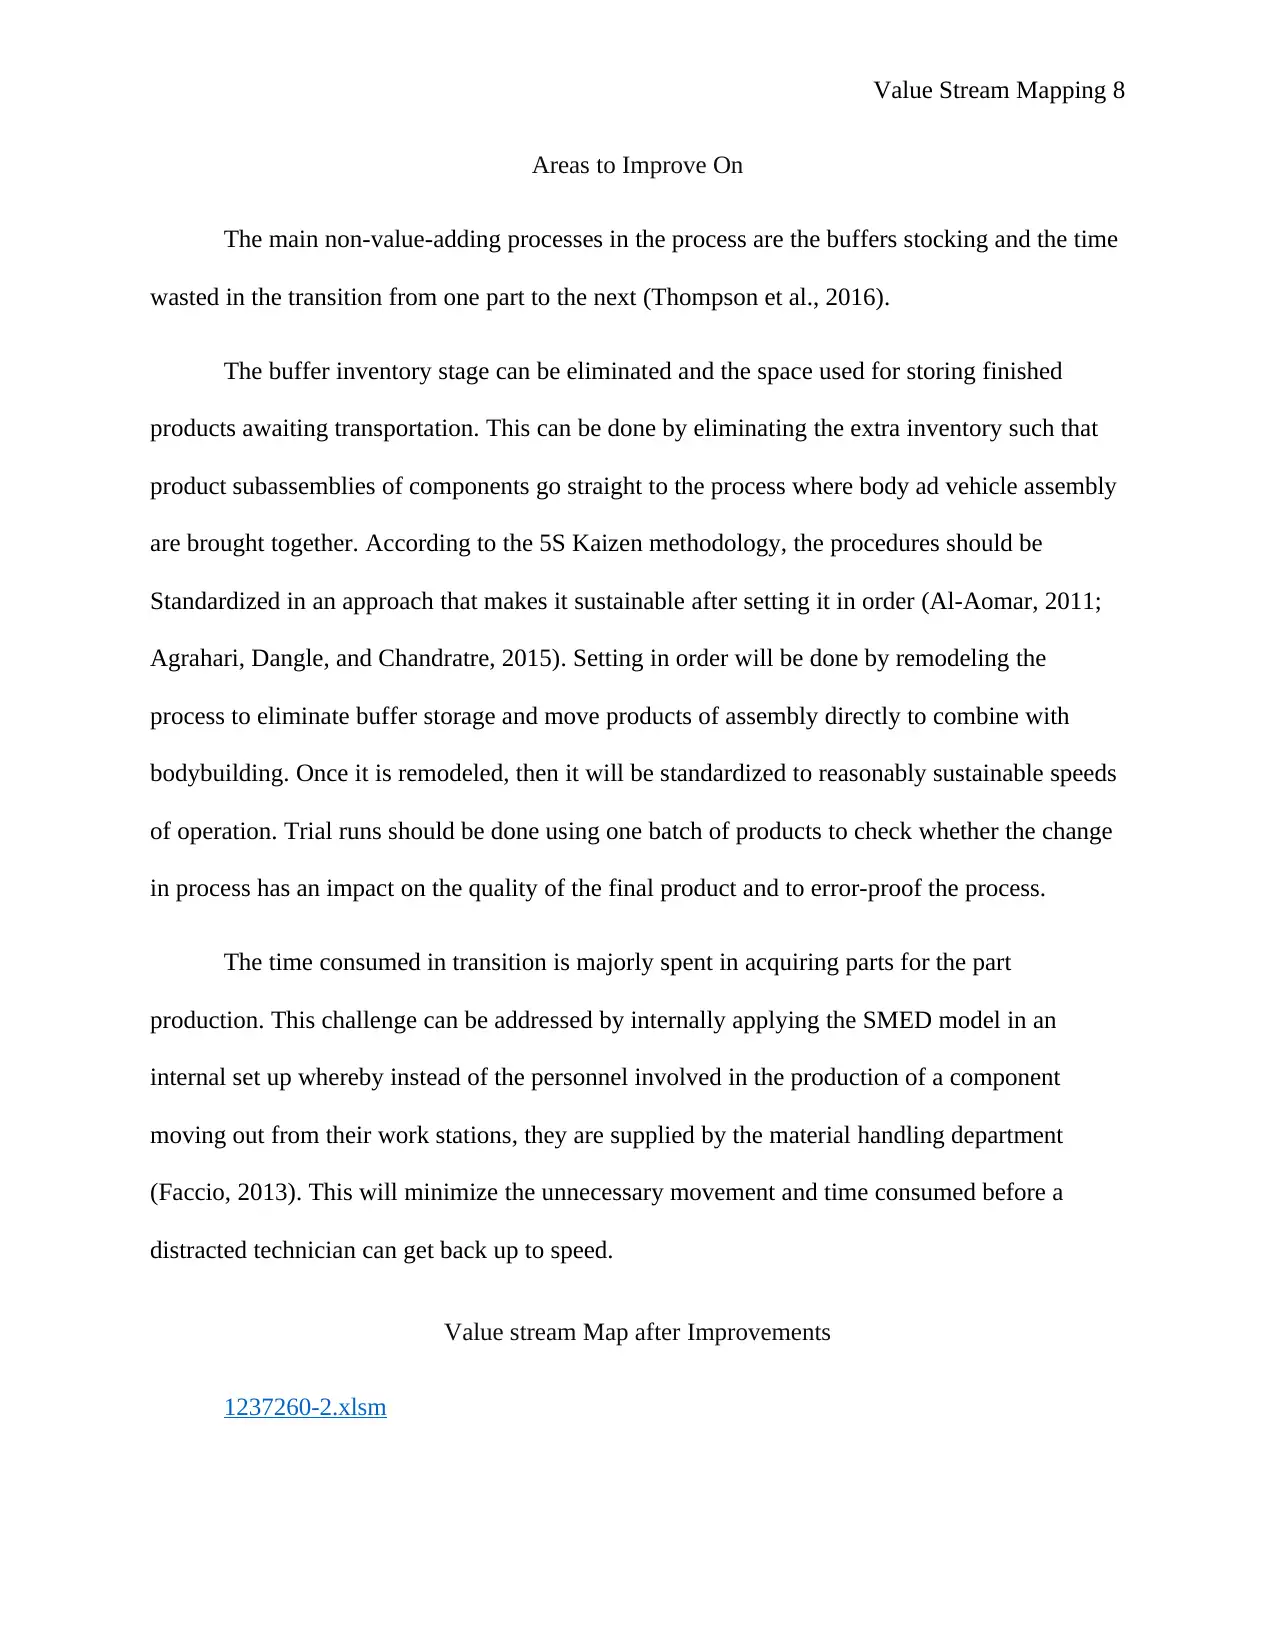
Areas to Improve On
The main non-value-adding processes in the process are the buffers stocking and the time
wasted in the transition from one part to the next (Thompson et al., 2016).
The buffer inventory stage can be eliminated and the space used for storing finished
products awaiting transportation. This can be done by eliminating the extra inventory such that
product subassemblies of components go straight to the process where body ad vehicle assembly
are brought together. According to the 5S Kaizen methodology, the procedures should be
Standardized in an approach that makes it sustainable after setting it in order (Al-Aomar, 2011;
Agrahari, Dangle, and Chandratre, 2015). Setting in order will be done by remodeling the
process to eliminate buffer storage and move products of assembly directly to combine with
bodybuilding. Once it is remodeled, then it will be standardized to reasonably sustainable speeds
of operation. Trial runs should be done using one batch of products to check whether the change
in process has an impact on the quality of the final product and to error-proof the process.
The time consumed in transition is majorly spent in acquiring parts for the part
production. This challenge can be addressed by internally applying the SMED model in an
internal set up whereby instead of the personnel involved in the production of a component
moving out from their work stations, they are supplied by the material handling department
(Faccio, 2013). This will minimize the unnecessary movement and time consumed before a
distracted technician can get back up to speed.
Value stream Map after Improvements
1237260-2.xlsm
Value Stream Mapping 9
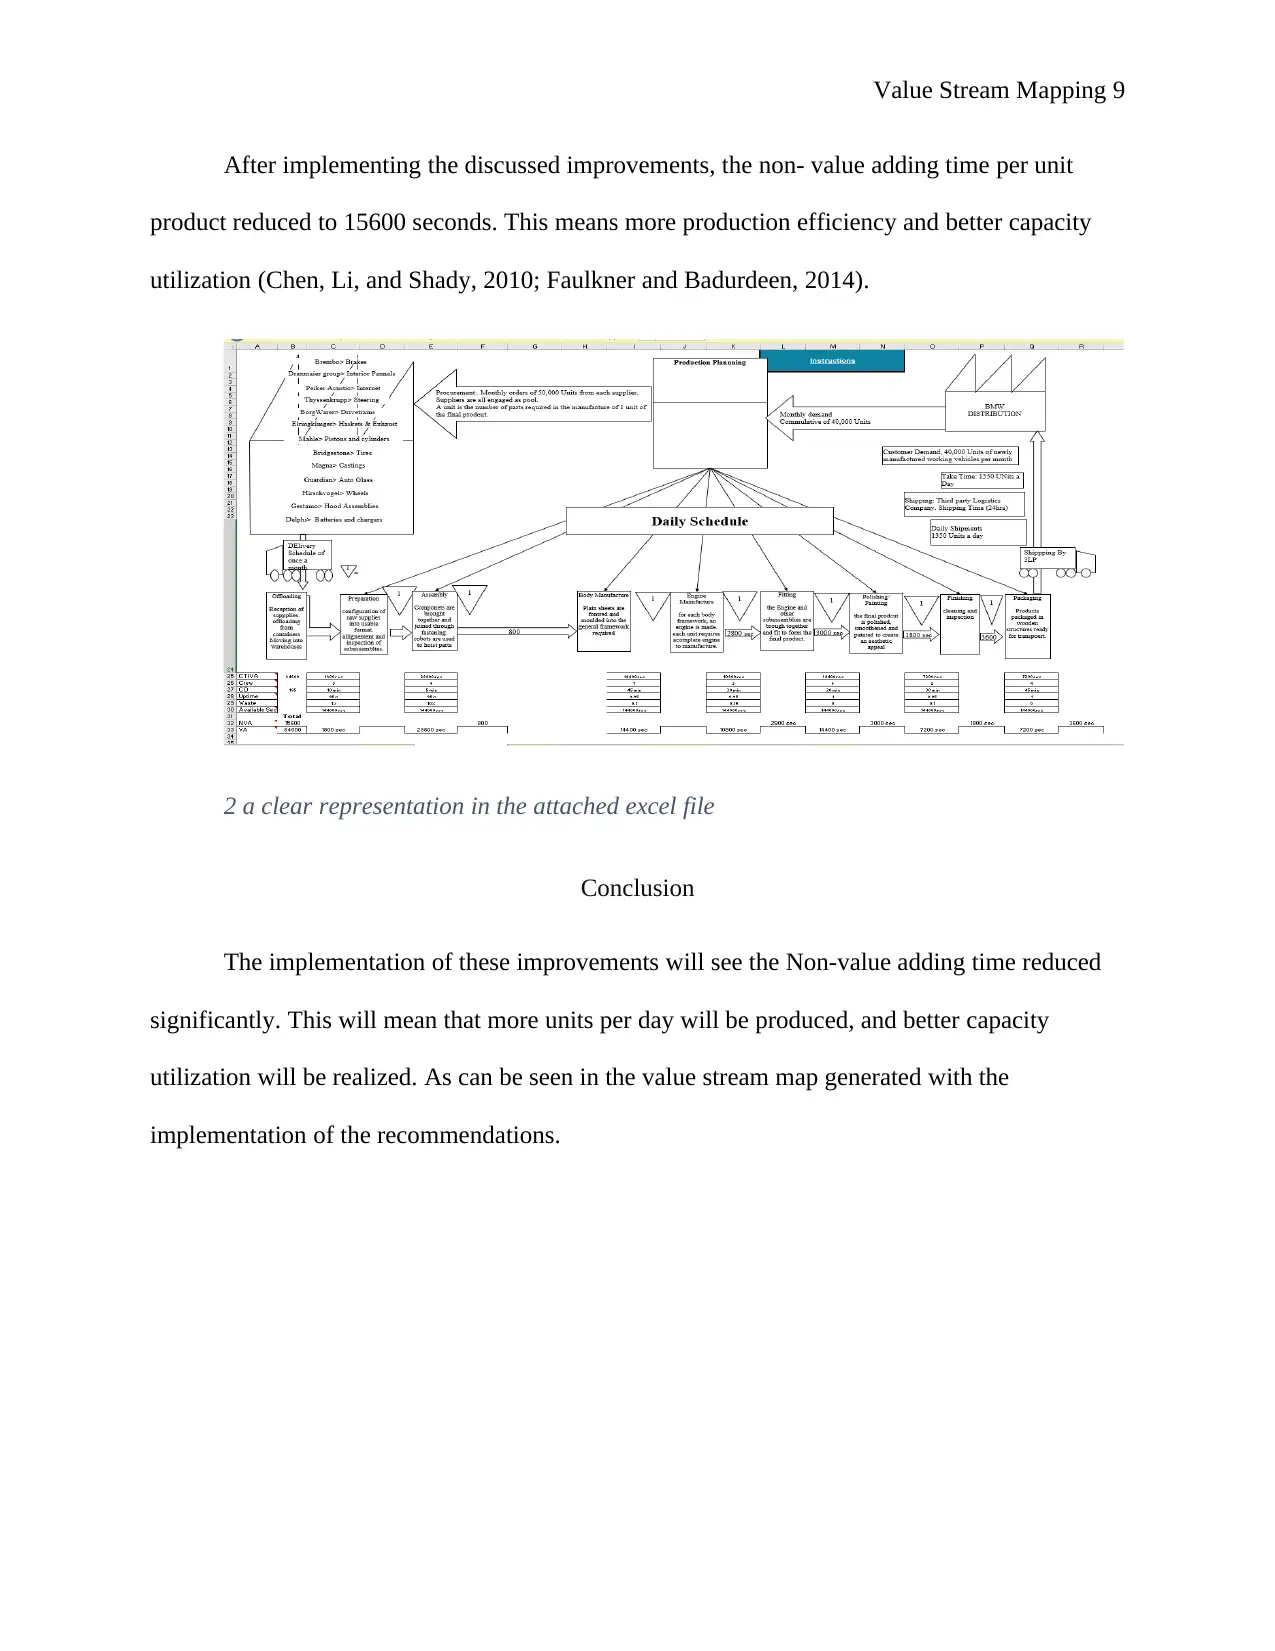
After implementing the discussed improvements, the non- value adding time per unit
product reduced to 15600 seconds. This means more production efficiency and better capacity
utilization (Chen, Li, and Shady, 2010; Faulkner and Badurdeen, 2014).
2 a clear representation in the attached excel file
Conclusion
The implementation of these improvements will see the Non-value adding time reduced
significantly. This will mean that more units per day will be produced, and better capacity
utilization will be realized. As can be seen in the value stream map generated with the
implementation of the recommendations.
⊘ This is a preview!⊘
Do you want full access?
Subscribe today to unlock all pages.
Trusted by 1+ million students worldwide
Value Stream Mapping 10
References
Agrahari, R., Dangle, P. and Chandratre, K. (2015) 'Implementation of 5S methodology in the
small scale industry: A case study', International Journal of Scientific \& Technology Research,
vol. 4, no. 4, pp. 180-187.
Al-Aomar, R.A. (2011) 'Applying 5S LEAN Technology: An infrastructure for continuous
process improvement', World Academy of Science, Engineering and Technology, vol. 59, pp.
2014-2019.
Amiri, M. and Mohtashami, A. (2012) 'Buffer allocation in unreliable production lines based on
the design of experiments, simulation, and genetic algorithm,' The International Journal of
Advanced Manufacturing Technology, vol. 62, no. 1-4, pp. 371-383.
Bhamu, J. and Sangwan, KS (2014) 'Lean manufacturing: literature review and research issues,'
International Journal of Operations \& Production Management.
Chen, J.C., Li, Y. and Shady, B.D. (2010) 'from value stream mapping toward a lean/sigma
continuous improvement process: an industrial case study,' International Journal of Production
Research, vol. 48, no. 4, pp. 1069-1086.
Cimorelli, S. (2013) Kanban for the supply chain: fundamental practices for manufacturing
management, CRC Press.
Faccio, M. (2013) 'setup time reduction: SMED-balancing integrated model for manufacturing
systems with automated transfer,' International Journal of Engineering and Technology, vol. 5,
no. 5, pp. 4075-4084.
Paraphrase This Document
Need a fresh take? Get an instant paraphrase of this document with our AI Paraphraser
Value Stream Mapping 11
Faulkner, W. and Badurdeen, F. (2014) 'Sustainable Value Stream Mapping (Sus-VSM):
methodology to visualize and assess manufacturing sustainability performance,' Journal of
cleaner production, vol. 85, pp. 8-18.
Javadian Kootanaee, A., Babu, K.N. and Talari, H. (2013) 'Just-in-time manufacturing system:
from introduction to implement,' Available at SSRN 2253243.
Kose, SY. and Kilincci, O. (2015) 'Hybrid approach for buffer allocation in open serial
production lines,' Computers \& Operations Research, vol. 60, pp. 67-78.
Rahani, A. and Al-Ashraf, M. (2012) 'production flow analysis through value stream mapping: a
lean manufacturing process case study', Procedia Engineering, vol. 41, pp. 1727-1734.
Rahman, N.A.A., Sharif, S.M. and Esa, M.M. (2013) 'Lean manufacturing case study with
Kanban system implementation,' Procedia Economics and Finance, vol. 7, no. 1, pp. 174-180.
Rekha, R.S., Periyasamy, P. and Nallusamy, S. (2016) 'Lean tools implementation for lead time
reduction in CNC shop floor of an automotive component manufacturing industry,' Indian
Journal of Science and Technology, vol. 9, no. 45, pp. 01-06.
Sundar, RBA and Kumar, R.S. (2014) 'A review on lean manufacturing implementation
techniques,' Procedia Engineering, vol. 97, no. 1, pp. 1875-1885.
Thompson, M.K., Moroni, G., Vaneker, T., Fadel, G., Campbell, R.I., Gibson, I., Bernard, A.,
Schulz, J., Graf, P. and Ahuja, B. (2016) 'Design for Additive Manufacturing: Trends,
opportunities, considerations, and constraints,'
Value Stream Mapping 12
Wang, C.H., Kao, J.H., and Kumar Thakur, S. (2012) 'Implementation of the Lean Model for
Carrying out Value Stream Mapping and SMED in the Aerospace Engine Case Production,'
Advanced Materials Research, vol. 542, pp. 302-310.
Yang, M.G.M., Hong, P. and Modi, S.B. (2011) 'Impact of lean manufacturing and
environmental management on business performance: An empirical study of manufacturing
firms', International Journal of Production Economics, vol. 129, no. 2, pp. 252-261.
Zaferullah, K. and Kumar, S. (2013) 'Manufacturing Excellence through JIT Approach-A
Review,' International Journal of Application or Innovation in Engineering \& Management,
vol. 2, no. 12, pp. 302-305.
⊘ This is a preview!⊘
Do you want full access?
Subscribe today to unlock all pages.
Trusted by 1+ million students worldwide
1 out of 12
Related Documents


Your All-in-One AI-Powered Toolkit for Academic Success.
+13062052269
info@desklib.com
Available 24*7 on WhatsApp / Email
![[object Object]](/_next/static/media/star-bottom.7253800d.svg)
Unlock your academic potential
Copyright © 2020–2026 A2Z Services. All Rights Reserved. Developed and managed by ZUCOL.