Level 8 Lean Operations and Deviations Management: VSM and Improvement
VerifiedAdded on 2022/11/25
|9
|2079
|491
Report
AI Summary
This report presents a detailed analysis of a business's value stream map (VSM) within the context of Level 8 Lean Operations and Deviations Management. The student begins by constructing a current-state VSM for an imaginary manufacturing company, outlining its processes from raw materials to customer delivery. The report then identifies areas of waste and non-value-added activities, focusing on potential improvements within the milling and inspection processes. Lean tools, including Kanban and signal Kanban, are suggested to minimize waste and increase output. The DMAIC methodology is applied to analyze problems and propose solutions. Finally, a revised VSM is presented, reflecting the implemented improvements and projecting positive outcomes such as reduced lead time and minimized waste. The report underscores the effectiveness of VSM as a lean tool for optimizing production operations and achieving continuous improvement.
Business Value Stream Map
and Improvement Identification
UNIVERSITY NAME
Level 8
Lean Operations and Deviations Management
Student Name:
Student ID Number:
Submission Date:
and Improvement Identification
UNIVERSITY NAME
Level 8
Lean Operations and Deviations Management
Student Name:
Student ID Number:
Submission Date:
Paraphrase This Document
Need a fresh take? Get an instant paraphrase of this document with our AI Paraphraser
Table of Contents
Introduction................................................................................................................................3
Value Stream Map......................................................................................................................3
Potential improvements..............................................................................................................4
Application of lean tools............................................................................................................4
Redrawing of Value Stream Map...............................................................................................6
Conclusion..................................................................................................................................7
References..................................................................................................................................8
List of Figures
Figure 1: Current Layout of Value Stream Map........................................................................3
Figure 2: Revised Layout of Value Stream Map.......................................................................6
Introduction
Value stream mapping (VSM) is a tool for lean improvement that helps to improve
the material and information flow within an organisation (Tyagi, et. al., 2015). The objective
of VSM is to improve processes by eliminating waste and non-value adds activities (Meudt,
Metternich and Abele, 2017). It is in relation to the value and non-value adding steps to
identify the processes related to waste management. Moreover, it aids in visualizing few
techniques or tools for product creation to the end customers. VSM has also emphasis on
gaining an understanding of the process improvement via systematic analysis.
Value Stream Map
Annual Production Plan
Weekly Orders
Market Forecast
Monthly Orders
Weekly schedules
2 days 4 days 3 days 5 days 1 day 5 days Total Lead time: 20 days
2 minutes 5 minutes 10 minutes 2 minutes 1 minutes Value added time: 20 minutes
Production
Control
Supplier 1 Supplier 2
C/T : 2 minutes
C/O : 120 min
Uptime = 70%
No of operators = 2
Waste = 25 lbs
Recieving Milling
C/T : 5 minutes
C/O : 180 min
Uptime = 75%
No of operators = 3
Waste = 15 lbs
Welding
C/T : 10 minutes
C/O : 300 min
Uptime = 55%
No of operators = 1
Waste = 5 lbs
Painting
C/T : 2 minutes
C/O : 30 min
Uptime = 90%
No of operators = 2
Waste = 10 lbs
Assembly
C/T : 1 minutes
C/O : 60 min
Uptime = 80%
No of operators = 1
Waste = 15 lbs
Inspection
Customer
Shipping
5 days
2 days
30 50 70 80 10 20
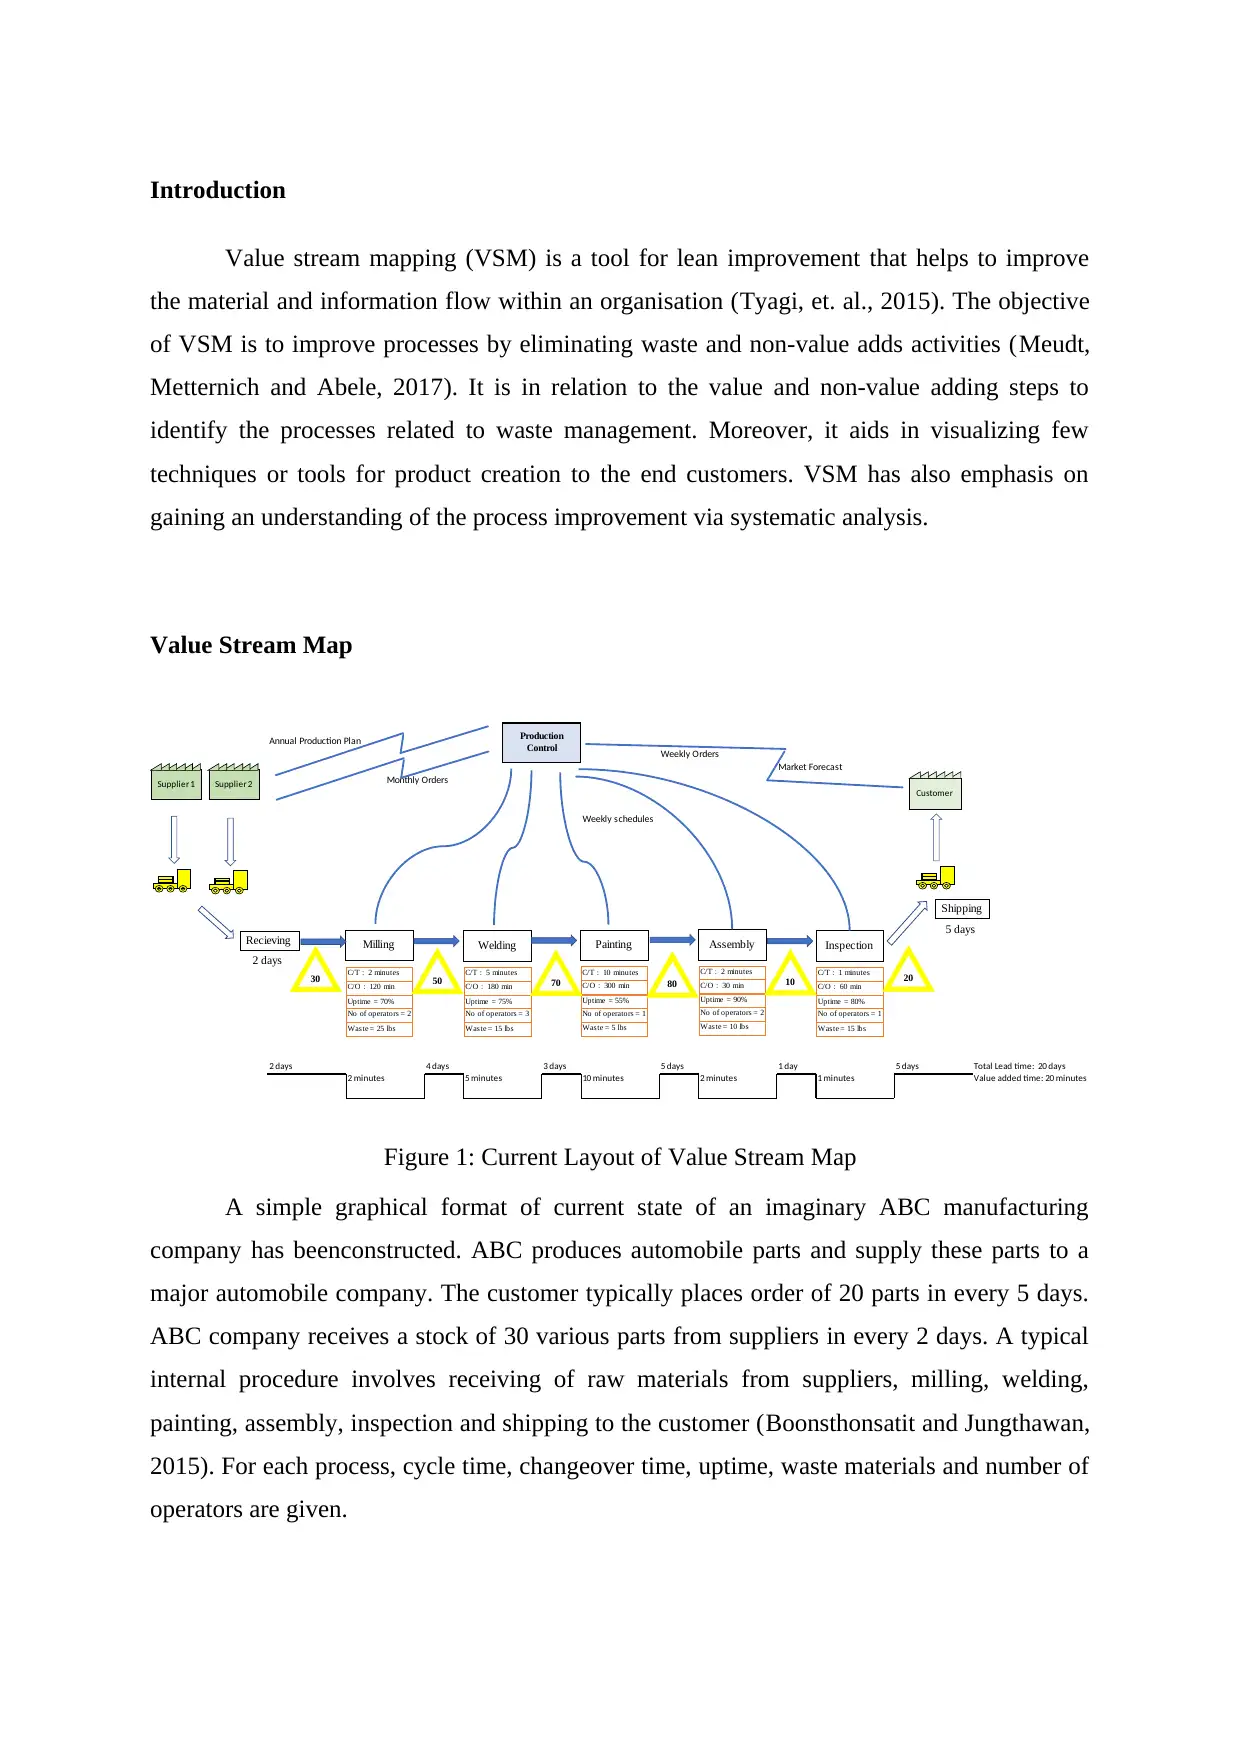
Figure 1: Current Layout of Value Stream Map
A simple graphical format of current state of an imaginary ABC manufacturing
company has beenconstructed. ABC produces automobile parts and supply these parts to a
major automobile company. The customer typically places order of 20 parts in every 5 days.
ABC company receives a stock of 30 various parts from suppliers in every 2 days. A typical
internal procedure involves receiving of raw materials from suppliers, milling, welding,
painting, assembly, inspection and shipping to the customer (Boonsthonsatit and Jungthawan,
2015). For each process, cycle time, changeover time, uptime, waste materials and number of
operators are given.
Value stream mapping (VSM) is a tool for lean improvement that helps to improve
the material and information flow within an organisation (Tyagi, et. al., 2015). The objective
of VSM is to improve processes by eliminating waste and non-value adds activities (Meudt,
Metternich and Abele, 2017). It is in relation to the value and non-value adding steps to
identify the processes related to waste management. Moreover, it aids in visualizing few
techniques or tools for product creation to the end customers. VSM has also emphasis on
gaining an understanding of the process improvement via systematic analysis.
Value Stream Map
Annual Production Plan
Weekly Orders
Market Forecast
Monthly Orders
Weekly schedules
2 days 4 days 3 days 5 days 1 day 5 days Total Lead time: 20 days
2 minutes 5 minutes 10 minutes 2 minutes 1 minutes Value added time: 20 minutes
Production
Control
Supplier 1 Supplier 2
C/T : 2 minutes
C/O : 120 min
Uptime = 70%
No of operators = 2
Waste = 25 lbs
Recieving Milling
C/T : 5 minutes
C/O : 180 min
Uptime = 75%
No of operators = 3
Waste = 15 lbs
Welding
C/T : 10 minutes
C/O : 300 min
Uptime = 55%
No of operators = 1
Waste = 5 lbs
Painting
C/T : 2 minutes
C/O : 30 min
Uptime = 90%
No of operators = 2
Waste = 10 lbs
Assembly
C/T : 1 minutes
C/O : 60 min
Uptime = 80%
No of operators = 1
Waste = 15 lbs
Inspection
Customer
Shipping
5 days
2 days
30 50 70 80 10 20
Figure 1: Current Layout of Value Stream Map
A simple graphical format of current state of an imaginary ABC manufacturing
company has beenconstructed. ABC produces automobile parts and supply these parts to a
major automobile company. The customer typically places order of 20 parts in every 5 days.
ABC company receives a stock of 30 various parts from suppliers in every 2 days. A typical
internal procedure involves receiving of raw materials from suppliers, milling, welding,
painting, assembly, inspection and shipping to the customer (Boonsthonsatit and Jungthawan,
2015). For each process, cycle time, changeover time, uptime, waste materials and number of
operators are given.
⊘ This is a preview!⊘
Do you want full access?
Subscribe today to unlock all pages.
Trusted by 1+ million students worldwide
In relation to the above layout, the production is the controlling unit for the processes
to finish the schedules to complete orders for uninterrupted supply and simultaneously
involved in receiving orders from the customers after the market forecasting. Along with this,
this layout plays the most significant role in fulfilling the annual production plans for smooth
running of all the operations mentioned like painting, welding, milling etc. It is initiated when
the suppliers send the materials to the production house where the resources undergo milling
and further welding for attaining the desired specification of the products. Next painting is
done to make the products presentable and then send it for the assembly. Lastly, it is sent to
the inspection for checking any flaws or defects. The next step is the shipping which
approximately takes 5 days to reach the customers with targeted deadline. Thus, it helps in
fulfilling the value streaming and minimise the wastes (Rahani and Al-Ashraf, 2012).
Potential improvements
The production manager has the main target of ensuring supply to customers as per demand,
minimizing wastes and improving quality by using the VSM techniques. Following potential
improvements are identified:
It can be observed that maximum waste produced at Milling station and during
inspection.
There is significant wait time before welding, painting and assembly stations which
increases the overall lead time.
There is low output at painting and inspection stations which results in large backlogs.
There are recent customer complaints regarding quality issues and missed deadline.
In regard to this, it has also seen that it can be achieved through systematic analysis of
the production operations such as milling, welding, painting, assembly and inspection to
adopt lean techniques (Kurdve et.al., 2015). Moreover, it also assists in avoiding any delays
or resources ineffectiveness through analysis in the value stream mapping.
Application of lean tools
Following two key areas are identified for the improvements
To minimize waste produced at Milling and Inspection
D- These processes generate more waste than the other operations and must be reduced to
attain it by value stream map
Paraphrase This Document
Need a fresh take? Get an instant paraphrase of this document with our AI Paraphraser
M- It can be measured through specifications in both the methods and the involved
materials and in accordance to it, the triggering factors might be assessed.
A- This involves the root cause analysis to understand the obstacles while performing the
operations
I- Here the focus is to design the entire procedure in such a way that it provides solutions
by using the elements
C- This is done through proper monitoring processes on both the methods to minimise the
triggering factors and maintain the
To increase output at Painting and Inspection
D- It is achievable through providing an overview and gaining an understanding about
customers’ requirements via feedbacks
M- Here the capability analysis is to be done to know about the progression and recording
it as well
A- It is evaluated through failure mode and effects analysis that helps in recognising the
defects or any technical issues (Sin et.al., 2015)
I- Kaizen might be feasible to execute the changes and maintain the employees
‘engagement
C- It assesses the quality assurance by documentation and also using the reviewing
process to minimise the risks
The root cause of wastes at Milling station is identified due to faulty raw materials
being supplied. Therefore, it is suggested to add Kanban stock-point (Seth, Seth and
Dhariwal, 2017) before the Milling and materials should be inspected at warehouse after
receiving. Also, Signal Kanban should be used whenever the on-hand inventory levels
between two processes drops to a minimum point at key value add activities like Milling,
Welding, Painting and Assembly.
The main reason for low output at Painting and Inspection is due to using single operators
and low uptime. It is suggested to recruit more staff at these stations and impart training
(King and King, 2017).
Kanban stock point is one of the scheduling systems in the inventory for proper stock
management. It has always outlined the required materials or resources for the uninterrupted
flow of processes. Here the focus is to keep the levels of the inventory as low as possible. In
accordance to the layout, if this is applicable then the milling of the materials would be
accomplished more effectually and also paves the path of low levels of waste generation
(Cimorelli, 2016). Thus, it would be beneficial for the staff to regulate the values and the total
time taken in more specified manner that also aids in proper control and inspection in the
later stages.
Herein, the Signal kanban point is another feature that helps in understanding the
authorization while performing the milling operations. It also helps the employees to know
that the suppliers also need instructions while sending the required resources to the
production site (Kanet and Wells, 2019). Moreover, this is amongst the signalling device to
understand the conveyance of the items to be pulled to precede the operations in simpler and
transparent ways. Therefore, the lean processes support in detecting the flaws or issues and
provide with solutions for the quality maintenance.
Redrawing of Value Stream Map
Annual Production Plan
Weekly Orders
Market Forecast
Monthly Orders
Weekly schedules
Inspection Warehouse
2 days 1 days 1 days 2 days 1 day 1 days Total Lead time: 8 days
2 minutes 5 minutes 10 minutes 2 minutes 1 minutes Value added time: 20 minutes
Production
Control
Supplier 1 Supplier 2
C/T : 2 minutes
C/O : 120 min
Uptime = 70%
No of operators = 2
Recieving Milling
C/T : 5 minutes
C/O : 180 min
Uptime = 75%
No of operators = 3
Welding
C/T : 10 minutes
C/O : 300 min
Uptime = 55%
No of operators = 2
Painting
C/T : 2 minutes
C/O : 30 min
Uptime = 90%
No of operators = 2
Assembly
C/T : 1 minutes
C/O : 60 min
Uptime = 80%
No of operators = 2
Inspection
Customer
Shipping
2 days
20
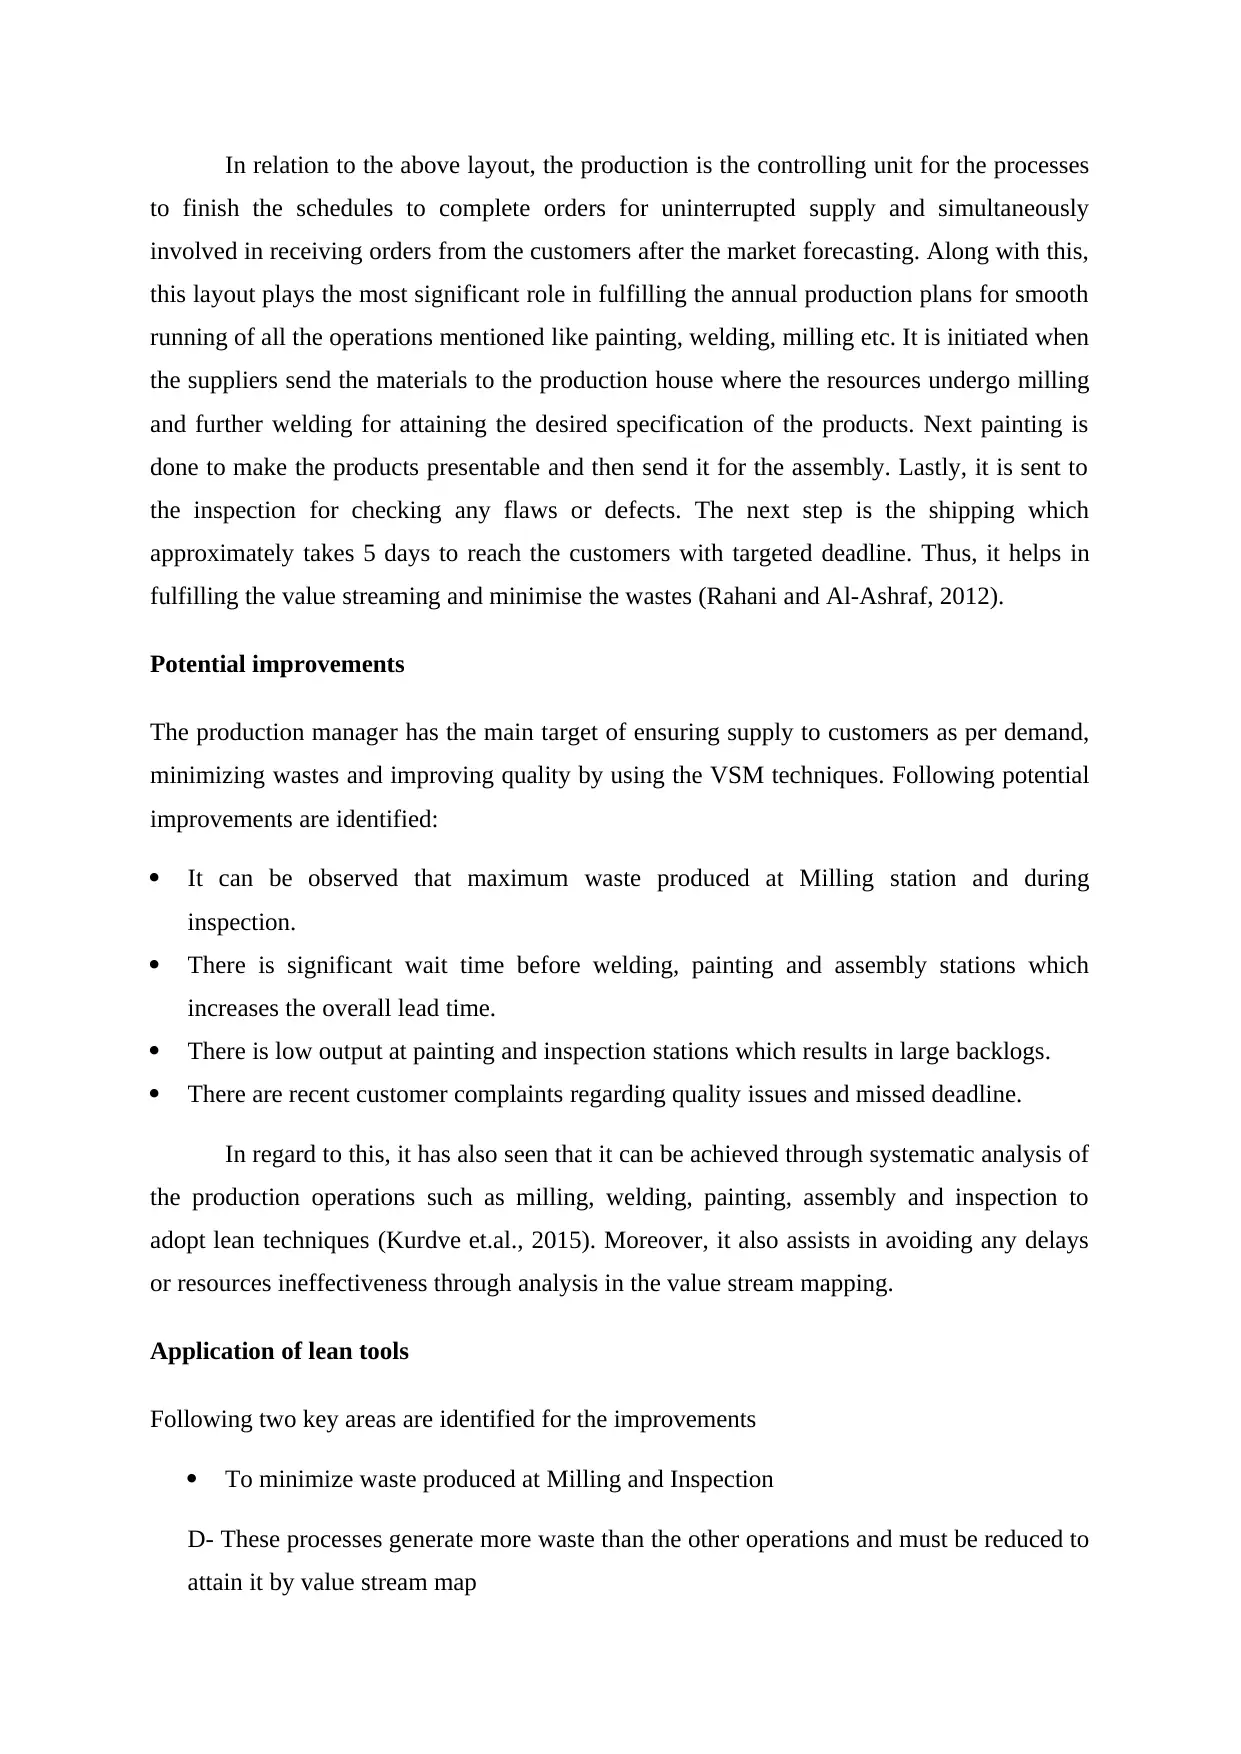
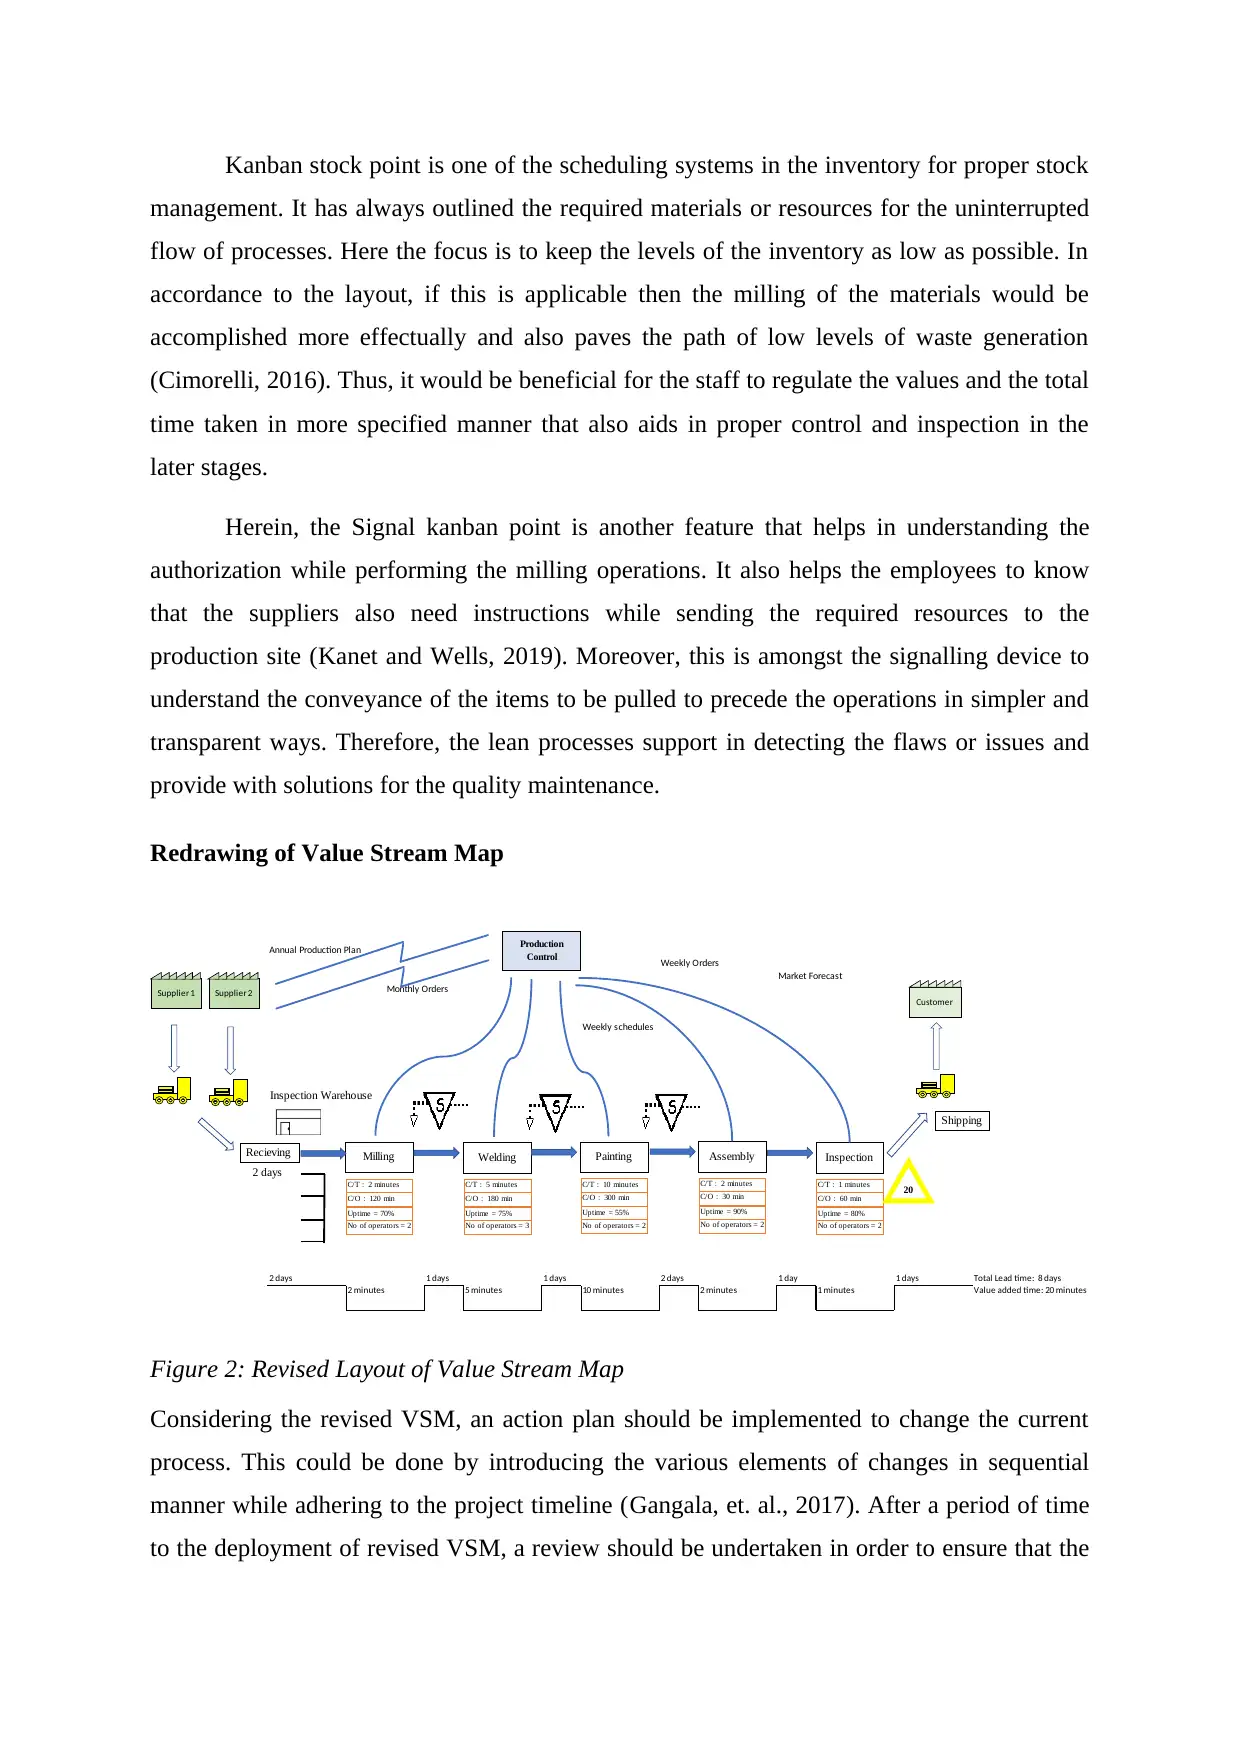
Figure 2: Revised Layout of Value Stream Map
Considering the revised VSM, an action plan should be implemented to change the current
process. This could be done by introducing the various elements of changes in sequential
manner while adhering to the project timeline (Gangala, et. al., 2017). After a period of time
to the deployment of revised VSM, a review should be undertaken in order to ensure that the
management. It has always outlined the required materials or resources for the uninterrupted
flow of processes. Here the focus is to keep the levels of the inventory as low as possible. In
accordance to the layout, if this is applicable then the milling of the materials would be
accomplished more effectually and also paves the path of low levels of waste generation
(Cimorelli, 2016). Thus, it would be beneficial for the staff to regulate the values and the total
time taken in more specified manner that also aids in proper control and inspection in the
later stages.
Herein, the Signal kanban point is another feature that helps in understanding the
authorization while performing the milling operations. It also helps the employees to know
that the suppliers also need instructions while sending the required resources to the
production site (Kanet and Wells, 2019). Moreover, this is amongst the signalling device to
understand the conveyance of the items to be pulled to precede the operations in simpler and
transparent ways. Therefore, the lean processes support in detecting the flaws or issues and
provide with solutions for the quality maintenance.
Redrawing of Value Stream Map
Annual Production Plan
Weekly Orders
Market Forecast
Monthly Orders
Weekly schedules
Inspection Warehouse
2 days 1 days 1 days 2 days 1 day 1 days Total Lead time: 8 days
2 minutes 5 minutes 10 minutes 2 minutes 1 minutes Value added time: 20 minutes
Production
Control
Supplier 1 Supplier 2
C/T : 2 minutes
C/O : 120 min
Uptime = 70%
No of operators = 2
Recieving Milling
C/T : 5 minutes
C/O : 180 min
Uptime = 75%
No of operators = 3
Welding
C/T : 10 minutes
C/O : 300 min
Uptime = 55%
No of operators = 2
Painting
C/T : 2 minutes
C/O : 30 min
Uptime = 90%
No of operators = 2
Assembly
C/T : 1 minutes
C/O : 60 min
Uptime = 80%
No of operators = 2
Inspection
Customer
Shipping
2 days
20
Figure 2: Revised Layout of Value Stream Map
Considering the revised VSM, an action plan should be implemented to change the current
process. This could be done by introducing the various elements of changes in sequential
manner while adhering to the project timeline (Gangala, et. al., 2017). After a period of time
to the deployment of revised VSM, a review should be undertaken in order to ensure that the
⊘ This is a preview!⊘
Do you want full access?
Subscribe today to unlock all pages.
Trusted by 1+ million students worldwide
expected benefits have been achieved. It is expected that the revised plan will produce close
to zero waste as well as the lead time will be reduced to 8 days from the previous 20 days.
Both of these KPIs will ensure timely delivery of customer orders while also ensuring quality
output. Furthermore, the focus is to mainstream the operations in the most optimum levels to
maintain the quality perspectives. For instance, the painting operation takes the maximum
time and the uptime is aggregated to 55%. It clearly demonstrated that the value stream
mapping gave the platform of total lead time to know the exact time taken for the competition
of the process. (Verrier, Rose and Caillaud, 2016) In addition, it focuses on quality review to
build the connectivity more reliably and finish the delivery of the service or products on time
and without any delays in time or damages. Thus, scheduled delivery is the most optimised
accessory to be followed.
Conclusion
It has been summarized that the value mapping stream is the most effective lean tool
that is used by the companies for smooth running of the production operations. Moreover, it
has also emphasis on understanding various features and principles of VSM to gain insights
about the issues or technical failures. This has put unregulated delays in between the
initiation and completion of the processes. The provided layout has established a sequential
order in knowing the root causes, its analysis with monitoring parts and provided with
solutions to remove it. Such layout has assisted in developing a more robust system of
processes.
Paraphrase This Document
Need a fresh take? Get an instant paraphrase of this document with our AI Paraphraser
References
Boonsthonsatit, K. and Jungthawan, S. (2015), May. Lean supply chain management-based
value stream mapping in a case of Thailand automotive industry. In 2015 4th International
Conference on Advanced Logistics and Transport (ICALT) (pp. 65-69). IEEE.
Cimorelli, S. (2016). Kanban for the supply chain: fundamental practices for manufacturing
management. Productivity Press.
Gangala, C., Modi, M., Manupati, V.K., Varela, M.L., Machado, J. and Trojanowska, J.
(2017), April. Cycle time reduction in deck roller assembly production unit with value stream
mapping analysis. In World Conference on Information Systems and Technologies (pp. 509-
518). Springer, Cham.
Kanet, J.J. and Wells, C.E. (2019). Setting bin quantities for 2-Bin Kanban systems (version
3). Omega, 87, pp.142-149.
King, P.L. and King, J.S. (2017). Value stream mapping for the process industries: Creating
a roadmap for lean transformation. Productivity Press.
Kurdve, M. and et.al. (2015). Waste flow mapping to improve sustainability of waste
management: a case study approach. Journal of Cleaner Production, 98, pp.304-315.
Meudt, T., Metternich, J. and Abele, E. (2017). Value stream mapping 4.0: Holistic
examination of value stream and information logistics in production. CIRP Annals, 66(1),
pp.413-416.
Rahani, A. R. and Al-Ashraf, M. (2012). Production flow analysis through value stream
mapping: a lean manufacturing process case study. Procedia Engineering, 41, 1727-1734.
Seth, D., Seth, N. and Dhariwal, P. (2017). Application of value stream mapping (VSM) for
lean and cycle time reduction in complex production environments: a case study. Production
Planning & Control, 28(5), pp.398-419.
Sin, A.B., Zailani, S., Iranmanesh, M. and Ramayah, T. (2015). Structural equation modelling
on knowledge creation in Six Sigma DMAIC project and its impact on organizational
performance. International Journal of Production Economics, 168, pp.105-117.
Tyagi, S., Choudhary, A., Cai, X. and Yang, K. (2015). Value stream mapping to reduce the
lead-time of a product development process. International Journal of Production
Economics, 160, pp.202-212.
Verrier, B., Rose, B. and Caillaud, E. (2016). Lean and Green strategy: the Lean and Green
House and maturity deployment model. Journal of cleaner production, 116, pp.150-156.
lead-time of a product development process. International Journal of Production
Economics, 160, pp.202-212.
Verrier, B., Rose, B. and Caillaud, E. (2016). Lean and Green strategy: the Lean and Green
House and maturity deployment model. Journal of cleaner production, 116, pp.150-156.
⊘ This is a preview!⊘
Do you want full access?
Subscribe today to unlock all pages.
Trusted by 1+ million students worldwide
1 out of 9
Related Documents


Your All-in-One AI-Powered Toolkit for Academic Success.
+13062052269
info@desklib.com
Available 24*7 on WhatsApp / Email
![[object Object]](/_next/static/media/star-bottom.7253800d.svg)
Unlock your academic potential
Copyright © 2020–2026 A2Z Services. All Rights Reserved. Developed and managed by ZUCOL.