Literature Review: Green Consumption Values & Product Responses
VerifiedAdded on 2023/05/30
|19
|20147
|490
Literature Review
AI Summary
This literature review delves into the concept of green consumption values, defined as the tendency to prioritize environmental protection through purchasing and consumption behaviors. It references a study that developed the GREEN scale, a six-item measure designed to reliably capture these values. The review highlights the scale's validation through multiple studies, demonstrating its connection to a broader nomological network encompassing the conservation of financial and physical resources, as well as its predictive power regarding consumer preference for environmentally friendly products. It further investigates how strong green consumption values enhance the appeal of environmentally friendly products by positively influencing the evaluation of their non-environmental attributes. The review also touches upon the increasing attention given to environmentally responsible behavior and the need for concise measures of green consumption values, differentiating it from broader concepts of social responsibility. It concludes by emphasizing the importance of understanding consumer characteristics associated with green consumption values and their role in shaping preferences for sustainable products.
Research Article
Seeing the world through GREEN-tinted glasses: Green consumptio
and responses to environmentally friendly products☆
Kelly L. Hawsa,⁎, Karen Page Winterichb, Rebecca Walker Naylorc
a Owen Graduate School of Management, 401 21st Ave South, Vanderbilt University, Nashville, TN 37203, USA
b Smeal College of Business, Pennsylvania State University, 449 Business Building, University Park, PA, 16802, USA
c Fisher College of Business, The Ohio State University, 2100 Neil Avenue, 538 Fisher Hall, Columbus, OH 43210, USA
Received 30 October 2012; received in revised form 23 October 2013; accepted 4 November 2013
Available online 13 November 2013
Abstract
The primary goal of this research is to conceptualize and develop a scale of green consumption values,which we define as the tendency to
express the value of environmental protection through one's purchases and consumption behaviors. Across six studies, we d
item measure we develop (i.e., the GREEN scale) can be used to capture green consumption values in a reliable, valid, and p
We furthertheorize and empirically demonstrate thatgreen consumption values are partof a largernomologicalnetwork associated with
conservation of not just environmental resources but also personal financial and physical resources. Finally, we demonstrate
predicts consumer preference for environmentally friendly products. In doing so, we demonstrate that stronger green consu
preference for environmentally friendly products through more favorable evaluations of the non-environmental attributes of
results have important implications for consumer responses to the growing number of environmentally friendly products.
© 2013 Society for Consumer Psychology. Published by Elsevier Inc. All rights reserved.
Keywords: Sustainability; Scale development; Environmental marketing; Green marketing; Motivated reasoning
1. Introduction
In today's marketplace,consumers are increasingly faced
with choicesbetween“green”productsand their more
traditionalcounterparts,as more firms produceproducts
whose compositionand/or packagingare positionedas
environmentally friendly. For example, Wal-Mart is pressuring
its suppliers like GeneralElectric and Procter& Gamble to
provideenvironmentally friendly products(Rosenbloom &
Barbaro,2009).Moreover,many corporateinitiativesnow
focus exclusively on environmentalissues,such as KPMG's
GlobalGreen Initiative (KPMG,2010;see also Menon &
Menon, 1997). However, the extent to which consumers va
and therefore positively respond to such offerings through
value-consistent behavior remains questionable.
Clearly not all consumers are willing to buy environment
friendly (EF) products.1 Some consumers may be reluctantto
purchase EF products because they are perceived to be les
effective (Luchset al., 2010).Cost may also be a critical
☆ The authors gratefully acknowledge that this project was funded by the Alton M.
& Marion R. Withers Retailing Research Grant Center for Retailing Studies, Texas
A&M University. The first two authors contributed equally to this research.
⁎ Corresponding author.
E-mail addresses: Kelly.haws@vanderbilt.edu (K.L. Haws),
kpw2@psu.edu (K.P. Winterich), naylor_53@fisher.osu.edu (R.W. Naylor).
1 We define an environmentally friendly product as one with at least one
environmental attribute. An “environmental attribute” is an attribute that
impact of the product on the environment. As such, environmental produc
can be positive (i.e., the product has little to no negative impact on the en
and is considered environmentally friendly) or negative (i.e., the product h
environment). This definition is consistent with the definition of “ethical at
used in past research (Irwin & Naylor, 2009; Luchs, Naylor, Irwin, & Raghu
2010;Peloza,White,& Shang,2013),with thekey distinction being that
environmental attributes are specifically about the environment, not more
about any issue that a consumer sees as relevant to their values/ethics (e
labor concerns;unsafe work environments,donations to charity,discrimination;
Mohr & Webb, 2005).
1057-7408/$ -see front matter © 2013 Society for Consumer Psychology. Published by Elsevier Inc. All rights reserved.
http://dx.doi.org/10.1016/j.jcps.2013.11.002
Available online at www.sciencedirect.com
ScienceDirect
Journal of Consumer Psychology 24, 3 (2014) 336 – 354
Paraphrase This Document
Need a fresh take? Get an instant paraphrase of this document with our AI Paraphraser
deterrent; eco-friendly products have historically cost more than
their traditional2 counterparts (Dale, 2008; Mintel, 2009), and not
all consumers are willing to pay price premiums for ethical or EF
products (Mintel, 2010). Clearly, some consumers are willing to
purchase EF products while others are not, which suggests that
there are individualdifferences among consumers in the value
they placeon conserving theenvironmentin consumption
settings.Therefore,the primary objective of our research is to
develop a method to understand differences across consumers
who do and do not value conserving the environment as part of
their consumption behavior. As such, we introduce the construct
of green consumption values,which we formally define as the
tendencyto expressthe valueof environmentalprotection
through one's purchases and consumption behaviors.
Across six studies, we demonstrate that the six-item measure
we develop (i.e.,the GREEN scale)can be used to reliably
capture green consumption values.We furthersuggestthat
green consumption valuesare partof a largernomological
network associated with conservation of not just environmental
resources but also personal financial and physical resources. In
otherswords,consumerswith strongergreen consumption
values (i.e.,“green” consumers) are generally oriented toward
protecting resources atboth the environmentaland personal
level.We testthese proposed nomologicalnetwork relation-
ships empirically as part of our larger scale development effort.
Finally,to further validate the scale,we demonstrate thatthe
GREEN scale predicts consumer preference for EF products. In
doing so,we show thatstrongergreen consumption values
increase preference forEF products through more favorable
evaluationsof these products'non-environmentalattributes,
consistent with consumers' use of motivated reasoning in other
decision making contexts (Kunda, 1990).
2. Understanding green consumers
Environmentally responsible behavior is receiving increasing
attention in theliterature (Catlin & Wang,2013;Leonidou,
Katsikeas, & Morgan, 2013; Peloza et al., 2013; Trudel & Argo,
2013; White & Simpson,2013).This focus is consistent with a
broader interest in understanding socially responsible consumption
that has persistedfor severaldecades(e.g.,Anderson&
Cunningham, 1972; Antil, 1984; Roberts, 1995; Webb, Mohr, &
Harris,2008;Webster,1975).However,the extentto which
consumers' environmentally responsible behaviors differ among
individuals, and why, is not clear given that existing research has
focused on responses to environmental products at the firm level
(Leonidou et al., 2013) or as a result of differing situational factors
(Catlin & Wang,2013;Peloza etal.,2013;White & Simpson,
2013). To be sure, past research aimed at understanding socially
responsible consumption has soughtto understand differences
among individual consumers. Yet, this research focused on broader
socialissues,as illustrated by Roberts' (1993) description of a
socially responsible consumer as “one who purchases products and
services perceived to have a positive (or less negative) in
the environment or who patronizes businesses that attem
related positive social change” (p. 140).
Although we acknowledge thatenvironmentalissues have
often been conceptualized as part of a broader effort to u
socially conscious consumers (Mohr,Webb,& Harris,2001;
Roberts,1993;Webster,1975),the more generalnotion of
socially responsibleconsumptionis multifaceted.As such,
investigations of socially conscious consumption have oft
to long and complex measures designed to capture the fu
of the constructs involved,which include issues notdirectly
related to the environment (see, for example, Antil, 1984
et al., 2008). Other scales designed to measure consume
responsibility have become dated asperceptionsof socially
responsible behaviors change overtime (Dunlap,Van Liere,
Mertig, & Jones, 2000).3 Thus, our primary goal is to develop a
concise measure ofexclusively green consumption values,as
opposed to broader attitudes toward socially responsible
or environmental consciousness. As we develop this mea
also seek to identify the consumer characteristics associa
green consumption valuesas partof a broadernomological
network and understanding of the green consumer. In ad
the desire of consumers with strong green consumption v
use society's environmentalresources wisely (i.e.,clean water,
cleanair, flora, and fauna;Cunningham,Cunningham,&
Woodworth, 2001), we suggest that green consumers als
conservation of their personal resources.
As such,we focus ourconceptualization and nomological
networkof greenconsumptionvalueson the underlying
characteristics of concern for both individual-level financ
physicalresources.Specifically,we expectconsumerswith
stronger green consumption values to be more conscient
the use of their financial resources, consistent with past r
suggesting thatgreen consumption (orconservation)may be
related to concerns about spending money. For example,
study,price consciousness was the only variable,otherthan
household characteristics (i.e., number of rooms) and fam
to significantly predict energy use (Heslop, Moran, & Cou
1981). In another study, care in shopping (reflecting shop
specials and checking prices) significantly predicted mak
special effort to buy environmentally-friendly products fo
men and women (Shrum, McCarty, & Lowrey, 1995).
Relatedly,we also expectconsumers with strongergreen
consumption valuesto be morecarefulusersof physical
resources, for example by using their products fully and b
using more than the necessary amountof a productfor it to
perform its function effectively,as suggested by Lastovicka,
Bettencourt,Hughner,and Kuntze's(1999)work on frugal
consumption.Specifically,we suggestthatgreen consumers
will be reluctant to give up their physical possessions bec
they willseek to extractfull and complete value from goods
2 When we refer to a “traditional” product, we refer to offerings in which there
is no known environmentally friendly attribute, though they are not necessarily
harmful to the environment.
3 For example, some scale items use figures that become dated (e.g.,
be willing to accept an increase in my family's total expenses of $120 n
to promote the wise use of natural resources” from Antil,1984),while others
focus on avoiding trade with certain countries due to policies that have
over time (e.g., “I do not buy products from companies that have invest
South Africa” from Roberts, 1995).
337K.L. Haws et al. / Journal of Consumer Psychology 24, 3 (2014) 336–354
before discarding them, consistent with Haws, Naylor, Coulter,
and Bearden's(2012)work on productretention tendency.
Additionally,we theorize thatgreen consumers willbe more
likely to be innovative users of existing physical resources, that
is, that they will creatively reuse and find multiple uses for their
products,as suggested by Price and Ridgeway's (1983) work
on use innovativeness, a behavior indicative of self-recycling.
To understand consumers'green consumption values,the
corresponding nomological net, and their predictive validity, we
firstconducta series of four scale developmentand validation
studies. In Study 1a, we discuss our development of a six-item
scale to measure green consumption values,compare itto an
existing measureof socially responsibleconsumption,and
establish a nomologicalnetwork including concern forboth
personalfinancialand physicalresources.Study 1b provides
further validation of the scale and nomological network using an
adult sample. Study 1c demonstrates the test–retest reliability of
the scale while also providing evidence ofpredictive validity
relative to existing measures of environmentalattitudes drawn
from the literature.Study 1d provides furthersupportfor the
predictive validity of our green measure with actual choice.
3. Study 1a: Developing the GREEN scale and testing the
nomological network
3.1. Participants and method
To develop the GREEN scale, we initially compiled a list of
58 items intended to measure how much consumers valued the
environment when making consumption decisions. These items
were generated by the authors by adapting items from existing
environmental attitude scales and drawing upon popular press
articlesregarding green marketing (e.g.,Dale,2008;Stone,
2009).We presented this setof items,plus othermeasures
described below,to 264 undergraduate studentswho were
participating in a multi-phased study for course credit.Given
our intention to parsimoniously assess the tendency to express
the importanceof environmentalprotection through one's
purchasesand consumptionbehaviors,we anticipateda
one-factor model for our GREEN scale.
In addition to the58 proposed itemsto assessgreen
consumption values,we also included the 40-item measure of
Socially Responsible Consumption Behavior(SRCB) devel-
oped by Antilin 1984.Our intentwas notto compare our
measure againstevery existing measure ofenvironmentalor
socially responsible values, attitudes, and behaviors, but rather
to develop aconcisescalethatwould noteasily become
outdated and would compare well with past measures. We used
the Antil (1984) scale for these benchmarking purposes because
of its inclusion of environmental values as a key part of socially
responsible consumption aswell as its existing use in the
literature.We anticipated thatour six-item measure would be
strongly related to this existing 40-item measure.
Additionally,we sought to examine our proposed nomolog-
ical network with respectto the relationship between green
consumption values and existing measures of consumers' use of
personalfinancialand physicalresources.The firstof these
measureswas Lastovickaet al.'s (1999)frugalityscale.
Lastovicka etal. (1999) characterized frugality as being about
both the careful acquisition and careful consumption of goo
encompassing the vigilantuse ofboth financialand physical
resources. Therefore, we expect GREEN to be related to fru
because of the emphasis a frugal consumer places on the c
use of financialresources in acquiring goods and concern for
physicalpossessionsduring consumption (Lastovicka etal.,
1999).We also measuredconsumerspendingself-control
(CSSC) because we expect greener consumers to exercise
thoughtfulness and controlin their spending decision making,
which would be implied in a positive relationship between
GREEN and CSSC (Haws,Bearden,& Nenkov,2012).We
also included Lichtenstein,Netemeyer,and Burton's(1990)
measure of price consciousness and Lichtenstein, Ridgway
Netemeyer's (1993) measure of value consciousness. We e
GREEN to be positively related to both of these constructs a
these tendencies also suggest careful use of financial resou
To address the conservative use of personal physical res
beyond that captured in Lastovicka et al.'s (1999) frugality
we measured the tendency to retain or relinquish possessio
(using the product retention tendency scale; Haws, Naylor
2012) and innovativeness in the use and reuse of products
Price & Ridgeway's, 1983 three-dimensional use innovative
scale).We expectthese constructs to be positively related to
GREEN, as they involve a focus on the careful disposition a
use of physical resources.
Finally,to assess the potential for consumers to misrepres
themselves by responding in a socially desirable manner,which
may be of particularconcernfor sociallyresponsibleand
environmentally friendly behaviors(Luchset al., 2010),we
assessedthe relationshipbetweenGREEN and both self-
deceptiveenhancementand impression managementusing a
shortened version ofPaulhus(1998)Balanced Inventory of
Desirable Responding (BIDR) scale.
3.2. Results
We first conducted a series of factor analyses to reduce t
set of 58 items.An initial exploratory factor analysis revealed
that there was one primary factor that emerged from the s
58 items, with an eigenvalue of 19.23 for the first factor ve
5.00 for the second factor, which explained 33% versus 9%
variance,respectively.A careful inspectionof the factor
loadings forthe second and subsequentfactors showed that
the loadings were significantly smaller than the loadings on
first factor,supportingthe proposedone-factormodelas
sufficiently capturing our construct.4 As such,we focused on
identifying items from this one factor that would assess gre
consumption values.
We found that 10 items had a loading of at least .70 or h
the first factor. We carefully examined these 10 items to lim
use of redundant or unclear items in order to use as few ite
4 We also compared theone-factormodelto a seriesof othermodels
including two,three,and fourfactormodels,and we consistently found
evidence that one factor provided the best fitting model.
338 K.L. Haws et al. / Journal of Consumer Psychology 24, 3 (2014) 336–354
⊘ This is a preview!⊘
Do you want full access?
Subscribe today to unlock all pages.
Trusted by 1+ million students worldwide
possible while retaining high validity,which is consistentwith
recommendations by Bearden, Netemeyer, and Haws (2010) and
Bearden,Netemeyer,and Teel(1989).This process led to the
elimination of four items.Accordingly,we determined thatthe
remaining six items were highly reliable (α = .89)and could
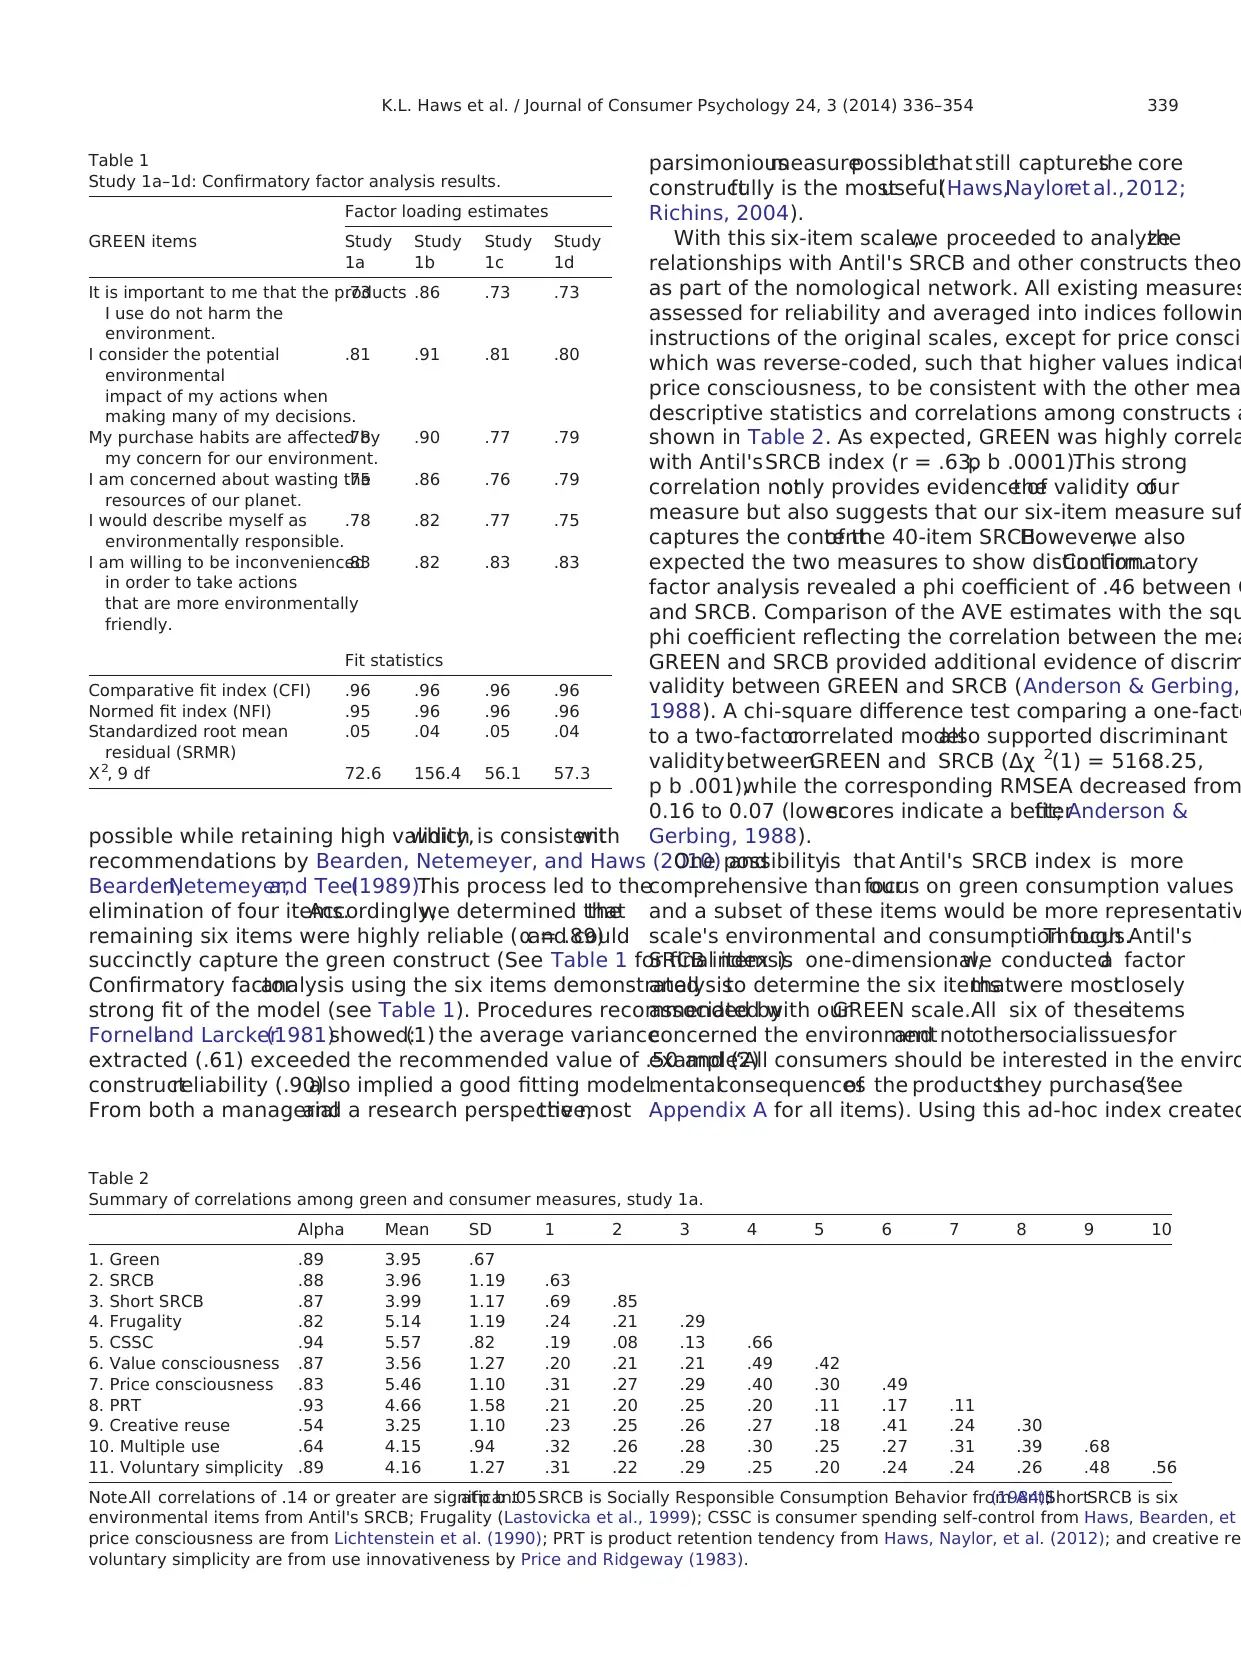
succinctly capture the green construct (See Table 1 for final items).
Confirmatory factoranalysis using the six items demonstrated
strong fit of the model (see Table 1). Procedures recommended by
Fornelland Larcker(1981)showed:(1) the average variance
extracted (.61) exceeded the recommended value of .50 and (2)
constructreliability (.90)also implied a good fitting model.
From both a managerialand a research perspective,the most
parsimoniousmeasurepossiblethat still capturesthe core
constructfully is the mostuseful(Haws,Nayloret al.,2012;
Richins, 2004).
With this six-item scale,we proceeded to analyzethe
relationships with Antil's SRCB and other constructs theo
as part of the nomological network. All existing measures
assessed for reliability and averaged into indices followin
instructions of the original scales, except for price consci
which was reverse-coded, such that higher values indicat
price consciousness, to be consistent with the other mea
descriptive statistics and correlations among constructs a
shown in Table 2. As expected, GREEN was highly correla
with Antil'sSRCB index (r = .63,p b .0001).This strong
correlation notonly provides evidence ofthe validity ofour
measure but also suggests that our six-item measure suffi
captures the contentof the 40-item SRCB.However,we also
expected the two measures to show distinction.Confirmatory
factor analysis revealed a phi coefficient of .46 between G
and SRCB. Comparison of the AVE estimates with the squ
phi coefficient reflecting the correlation between the mea
GREEN and SRCB provided additional evidence of discrim
validity between GREEN and SRCB (Anderson & Gerbing,
1988). A chi-square difference test comparing a one-facto
to a two-factorcorrelated modelalso supported discriminant
validitybetweenGREEN and SRCB (Δχ 2(1) = 5168.25,
p b .001),while the corresponding RMSEA decreased from
0.16 to 0.07 (lowerscores indicate a betterfit; Anderson &
Gerbing, 1988).
One possibilityis that Antil's SRCB index is more
comprehensive than ourfocus on green consumption values
and a subset of these items would be more representativ
scale's environmental and consumption focus.Though Antil's
SRCB index is one-dimensional,we conducteda factor
analysisto determine the six itemsthatwere mostclosely
associated with ourGREEN scale.All six of theseitems
concerned the environmentand notothersocialissues;for
example:“All consumers should be interested in the enviro
mentalconsequencesof the productsthey purchase”(see
Appendix A for all items). Using this ad-hoc index created
Table 1
Study 1a–1d: Confirmatory factor analysis results.
Factor loading estimates
GREEN items Study
1a
Study
1b
Study
1c
Study
1d
It is important to me that the products
I use do not harm the
environment.
.73 .86 .73 .73
I consider the potential
environmental
impact of my actions when
making many of my decisions.
.81 .91 .81 .80
My purchase habits are affected by
my concern for our environment.
.78 .90 .77 .79
I am concerned about wasting the
resources of our planet.
.75 .86 .76 .79
I would describe myself as
environmentally responsible.
.78 .82 .77 .75
I am willing to be inconvenienced
in order to take actions
that are more environmentally
friendly.
.83 .82 .83 .83
Fit statistics
Comparative fit index (CFI) .96 .96 .96 .96
Normed fit index (NFI) .95 .96 .96 .96
Standardized root mean
residual (SRMR)
.05 .04 .05 .04
Χ 2, 9 df 72.6 156.4 56.1 57.3
Table 2
Summary of correlations among green and consumer measures, study 1a.
Alpha Mean SD 1 2 3 4 5 6 7 8 9 10
1. Green .89 3.95 .67
2. SRCB .88 3.96 1.19 .63
3. Short SRCB .87 3.99 1.17 .69 .85
4. Frugality .82 5.14 1.19 .24 .21 .29
5. CSSC .94 5.57 .82 .19 .08 .13 .66
6. Value consciousness .87 3.56 1.27 .20 .21 .21 .49 .42
7. Price consciousness .83 5.46 1.10 .31 .27 .29 .40 .30 .49
8. PRT .93 4.66 1.58 .21 .20 .25 .20 .11 .17 .11
9. Creative reuse .54 3.25 1.10 .23 .25 .26 .27 .18 .41 .24 .30
10. Multiple use .64 4.15 .94 .32 .26 .28 .30 .25 .27 .31 .39 .68
11. Voluntary simplicity .89 4.16 1.27 .31 .22 .29 .25 .20 .24 .24 .26 .48 .56
Note.All correlations of .14 or greater are significantat p b .05.SRCB is Socially Responsible Consumption Behavior from Antil(1984);ShortSRCB is six
environmental items from Antil's SRCB; Frugality (Lastovicka et al., 1999); CSSC is consumer spending self-control from Haws, Bearden, et
price consciousness are from Lichtenstein et al. (1990); PRT is product retention tendency from Haws, Naylor, et al. (2012); and creative re
voluntary simplicity are from use innovativeness by Price and Ridgeway (1983).
339K.L. Haws et al. / Journal of Consumer Psychology 24, 3 (2014) 336–354
recommendations by Bearden, Netemeyer, and Haws (2010) and
Bearden,Netemeyer,and Teel(1989).This process led to the
elimination of four items.Accordingly,we determined thatthe
remaining six items were highly reliable (α = .89)and could
succinctly capture the green construct (See Table 1 for final items).
Confirmatory factoranalysis using the six items demonstrated
strong fit of the model (see Table 1). Procedures recommended by
Fornelland Larcker(1981)showed:(1) the average variance
extracted (.61) exceeded the recommended value of .50 and (2)
constructreliability (.90)also implied a good fitting model.
From both a managerialand a research perspective,the most
parsimoniousmeasurepossiblethat still capturesthe core
constructfully is the mostuseful(Haws,Nayloret al.,2012;
Richins, 2004).
With this six-item scale,we proceeded to analyzethe
relationships with Antil's SRCB and other constructs theo
as part of the nomological network. All existing measures
assessed for reliability and averaged into indices followin
instructions of the original scales, except for price consci
which was reverse-coded, such that higher values indicat
price consciousness, to be consistent with the other mea
descriptive statistics and correlations among constructs a
shown in Table 2. As expected, GREEN was highly correla
with Antil'sSRCB index (r = .63,p b .0001).This strong
correlation notonly provides evidence ofthe validity ofour
measure but also suggests that our six-item measure suffi
captures the contentof the 40-item SRCB.However,we also
expected the two measures to show distinction.Confirmatory
factor analysis revealed a phi coefficient of .46 between G
and SRCB. Comparison of the AVE estimates with the squ
phi coefficient reflecting the correlation between the mea
GREEN and SRCB provided additional evidence of discrim
validity between GREEN and SRCB (Anderson & Gerbing,
1988). A chi-square difference test comparing a one-facto
to a two-factorcorrelated modelalso supported discriminant
validitybetweenGREEN and SRCB (Δχ 2(1) = 5168.25,
p b .001),while the corresponding RMSEA decreased from
0.16 to 0.07 (lowerscores indicate a betterfit; Anderson &
Gerbing, 1988).
One possibilityis that Antil's SRCB index is more
comprehensive than ourfocus on green consumption values
and a subset of these items would be more representativ
scale's environmental and consumption focus.Though Antil's
SRCB index is one-dimensional,we conducteda factor
analysisto determine the six itemsthatwere mostclosely
associated with ourGREEN scale.All six of theseitems
concerned the environmentand notothersocialissues;for
example:“All consumers should be interested in the enviro
mentalconsequencesof the productsthey purchase”(see
Appendix A for all items). Using this ad-hoc index created
Table 1
Study 1a–1d: Confirmatory factor analysis results.
Factor loading estimates
GREEN items Study
1a
Study
1b
Study
1c
Study
1d
It is important to me that the products
I use do not harm the
environment.
.73 .86 .73 .73
I consider the potential
environmental
impact of my actions when
making many of my decisions.
.81 .91 .81 .80
My purchase habits are affected by
my concern for our environment.
.78 .90 .77 .79
I am concerned about wasting the
resources of our planet.
.75 .86 .76 .79
I would describe myself as
environmentally responsible.
.78 .82 .77 .75
I am willing to be inconvenienced
in order to take actions
that are more environmentally
friendly.
.83 .82 .83 .83
Fit statistics
Comparative fit index (CFI) .96 .96 .96 .96
Normed fit index (NFI) .95 .96 .96 .96
Standardized root mean
residual (SRMR)
.05 .04 .05 .04
Χ 2, 9 df 72.6 156.4 56.1 57.3
Table 2
Summary of correlations among green and consumer measures, study 1a.
Alpha Mean SD 1 2 3 4 5 6 7 8 9 10
1. Green .89 3.95 .67
2. SRCB .88 3.96 1.19 .63
3. Short SRCB .87 3.99 1.17 .69 .85
4. Frugality .82 5.14 1.19 .24 .21 .29
5. CSSC .94 5.57 .82 .19 .08 .13 .66
6. Value consciousness .87 3.56 1.27 .20 .21 .21 .49 .42
7. Price consciousness .83 5.46 1.10 .31 .27 .29 .40 .30 .49
8. PRT .93 4.66 1.58 .21 .20 .25 .20 .11 .17 .11
9. Creative reuse .54 3.25 1.10 .23 .25 .26 .27 .18 .41 .24 .30
10. Multiple use .64 4.15 .94 .32 .26 .28 .30 .25 .27 .31 .39 .68
11. Voluntary simplicity .89 4.16 1.27 .31 .22 .29 .25 .20 .24 .24 .26 .48 .56
Note.All correlations of .14 or greater are significantat p b .05.SRCB is Socially Responsible Consumption Behavior from Antil(1984);ShortSRCB is six
environmental items from Antil's SRCB; Frugality (Lastovicka et al., 1999); CSSC is consumer spending self-control from Haws, Bearden, et
price consciousness are from Lichtenstein et al. (1990); PRT is product retention tendency from Haws, Naylor, et al. (2012); and creative re
voluntary simplicity are from use innovativeness by Price and Ridgeway (1983).
339K.L. Haws et al. / Journal of Consumer Psychology 24, 3 (2014) 336–354
Paraphrase This Document
Need a fresh take? Get an instant paraphrase of this document with our AI Paraphraser
just thesesix SRCB items, the correlation with GREEN
increased only from .63 with all40 itemsto .69. Other
discriminantvalidity remained similarly unchanged.As such,
we believe thatGREEN is notonly more parsimonious than
Antil's SRCB scale, but is also distinct from an equally concise
version of the Antil SRCB scale.
We nextexplored the nomologicalnetwork by examining
the proposed relationships between GREEN and the measures
of how consumers use theirpersonalfinancialand physical
resources (see Table 2).Consumers with higher scores on the
GREEN scale were found to be more frugal (r = .24, p b .01),
more self-controlled in their spending (r = .19,p b .05),and
both more value (r = .20, p b .05) and price (r = .31, p b .001)
conscious, supporting our theory that consumers with stronger
green consumption values are concerned with the wise use of
their personalfinancialresources.Productretention tendency
(r = .21, p b .01) and the creative reuse, multiple use potential,
and voluntary simplicity subscales ofthe use innovativeness
scale were also all positively related to GREEN (r's = .23, .32,
and .31,respectively,all p's b .01),indicating that consumers
with strongergreen consumption values are more carefulin
how they usetheir personalphysicalresources;they are
reluctant to discard possessions and are likely to extend the life
of their possessions by finding new ways to use them.5 We note
thatGREEN was notrelated to socially desirable responding
(r = − .08for self-deceptiveenhancementand r = .08for
impression management;both p's N .10).As such,we con-
clude that GREEN provides good reliability and validity while
also demonstrating the expected relationships with the careful
use of personal financial and physical resources. We proceed to
furthertestthe scale'svalidity and reliability in additional
studies.
4. Study 1b: Confirmatory factor analysis and validation of
the GREEN scale with an adult sample
To provide further evidence of the reliability and validity of
our GREEN measure, we used a sample of adult participants,
which allowed us to conduct confirmatory factor analyses on a
separateset of data,provideadditionalsupportfor the
nomologicalnetwork,and examine the relationship between
GREEN and demographicvariables.To ensurethat our
measure and nomological network is valid for a more diverse
population,we also included a subset(to limitrespondent
fatigue) of the measures used in study 1a: frugality (Lastovicka
et al.,1999),consumer spending self-control (CSSC) (Haws,
Bearden et al., 2012), and the creative reuse subscale of Price
and Ridgeway's(1983)use innovativenessscale.We also
includedseveraldemographicvariablesgiven that past
research has shown mixed results regarding the relationship
betweenenvironmentalism anddemographics(e.g. Antil,
1984; Straughan & Roberts, 1999; also see Roberts, 1995 f
summary of relationships).
4.1. Participants and method
Data was collected from 370 adultconsumers who were
members of an online (Qualtrics) research panel and had b
recruitedto completean onlinesurveythatconsistedof
multiple sections,notall of which were related to the present
research.The focalmeasures for this study were our GREEN
measure,scales assessing concern forfinancialand physical
resources,and a series of demographic items.Participantage
ranged from under22 to over70,with the median category
falling into the 50–59 yearrange.Fifty percentof the
respondents were female.Approximately 50% of the sample
had atleasta bachelor's degree,while another33% of the
respondentshad somecollegeeducation.About 55% of
respondents had household incomes of less than $80,000.
4.2. Results
This adultsample confirmed the reliability of our GREEN
measure, as it had a coefficient alpha of .95. We again used
procedures of Fornelland Larcker (1981) to demonstrate the
reliabilityof our construct,finding an averagevariance
extracted estimate of .74 and a constructreliability of .85.In
addition, the one-factor model fit the data well (see Table 1
details).As such,we find supporting evidence for the validity
of the GREEN scale with an adult population.
Next,we considered the personalfinancialand physical
resource usage components.With respect to the use of both
financial and physical resources,we find that frugality (α =
.89, r = .26,p b .001)is positivelyrelatedto GREEN.
Regardingfinancialresources,consumerspendingself-
control(α = .95,r = .26,p b .001)was again positively
correlated with GREEN. Finally, support for the relationship
between GREEN and use of physical resources was evident
in a significant positive relationship with creative reuse (α =
.88, r = .30,p b .001).These relationshipsare consistent
with the results of Study 1a. Thus, this adult sample provid
furtherevidenceof the underlyingrelationship between
GREEN and careful management of individual-level financia
and physical resources.
A brief examination of the relationships between GREEN
and the demographic items revealed mixed evidence,which
is consistentwith pastexaminationsof the demographic
correlates of environmentalism (Roberts,1995).Specifically,
GREEN did not differ basedon gender(Males = 4.44,
Females = 4.53; F(1, 369) = .46, p = .49), but it did increas
with age (F (6, 364) = 4.75; p b .0001) and level of educati
(F(4, 366) = 4.1,p b .01).Higherincome participants also
tended to have higherscoreson the GREEN scale(F(7,
354) = 3.5, p b .001). Thus, while green consumption value
did not vary based on gender,resultsindicated thatolder
consumers,more educated consumers,and higherincome
consumers hold stronger green consumption values. This s
5 We note that these relationships between green consumption values and the
use offinancialand physicalresources were generally consistentfor either
Antil's original or the ad-hoc shortened environmental SRCB. However, we did
find ourmeasure ofGREEN was more strongly associated with financial
resource concerns based on stronger correlations of GREEN with CSSC and
Price Consciousnessthan with Antil'ssix-item measure (see Table 2 for
details).
340 K.L. Haws et al. / Journal of Consumer Psychology 24, 3 (2014) 336–354
providesfurthervalidation ofGREEN and its nomological
network by using an adultsample with more diverse demo-
graphics than an undergraduate student sample.We next move
beyond the nomological network to assess the predictive validity
of GREEN.
5. Study 1c: Test–retest reliability and predictive validity
In Study 1c, we test the ability of the GREEN scale to predict
preference for an EF versus traditional product.Recall that we
define an EF product as any product that has one or more known
positive environmental attributes.In doing so,we compare the
predictive validity of GREEN to that of existing environmental
measuresused in the literaturethat assessenvironmental
consumption ora more generalenvironmentalconsciousness.
This study wasconducted in two partswith a two week
separation in order to (1) assess the test–retest reliability of the
GREEN measure and (2) temporally separate the measurement of
GREEN and the related measuresfrom consumerdecisions
regarding environmentally-friendly behaviors.
5.1. Participants and method
A total of 167 undergraduate students participated in this study
in exchange forcourse credit.In the firstpartof the study,
participants responded to a series of environmental measures in a
randomized order,as described below.In the second part,
conducted two weeks later, participants responded to a series of
consumerdecisions,including three regarding environmentally
friendly consumption that we anticipated to be predicted by green
consumption values.Finally,following an unrelated distractor
task involving evaluations of photographs, participants once again
completed the GREEN measure.
5.1.1. Measures of environmental consumption and consciousness
In addition to our GREEN measure, in part one of the study,
participantswere also asked to complete othermeasuresof
environmentalconsumption and environmentalconsciousness
drawn from previousresearch.In study 1a,we compared
performance of GREEN to the Antil (1984) measure of socially
responsible consumption,a measure thatincluded itemsnot
related to the environment.In this study,we instead compared
GREEN to scalesdrawnfrom the literaturethatfocused
exclusively on the environment. While there are several measures
in the literature, we focused on those that were used in existing
research and were relevant to product acquisition, consumption,
and/ordisposition.Specifically,we included (1)the 26-item
Socially Responsible Purchase and Disposal(SRPD) measure
from Webb et al. (2008),6 and (2) Straughan and Roberts (1999)
30-item Ecologically Conscious ConsumerBehavior(ECCB)
scale. We also included the 14-item connectedness to nature scale
(CNS) proposed and validated by Mayer and Frantz (2004) to
compare ourmeasure ofgreen consumption values to more
general environmental consciousness that is not directly
consumption.
5.1.2. Measures for predictive validity
In part two of this study,participants responded to various
consumer decision making tasks, three of which were rel
to green consumption values (others included,for example,
deciding between two snack choices).
First,participants were asked to make a choice betwee
traditionalproduct(a pack ofpens)and an EF product(a
reusable grocery bag) of equal retail value ($1.50, clearly
for each product). A pretest (n = 82) indicated that partic
perceived the pack of pens to be of equal value to the reu
grocery bag (M = 2.74 vs.2.71,F(1, 80) = .007,p = .99,
where 1 = “notatall valuable” and 7 = “very valuable”).To
indicate theirrelative preference between these two items
participantsresponded to one item on a seven-pointscale
ranging from one,“I have a strong preference for the bag,” t
seven,“I have a strong preference for the pens.” We recod
this item such that higher values equal stronger preferen
the EF option.
The second decision relevantto green consumption values
was participants'willingnessto pay fora new eco-friendly
version of a well-known brand of laundry detergent (altho
specific brand name was not revealed,participants were told it
was a real, well-known brand on the market). Participants
shown information about two laundry detergents offered
brand:a traditionaland an “eco-friendly”version.The two
detergentsdifferedonly on the product's“EPC” rating.
Specifically,participants read the following information abo
the (hypothetical) EPC (adapted from Luchs et al., 2010):
EnvironmentalProductCouncil(EPC) rates similarproducts
based upon theirpro-environmentalbehaviors,actions,and
processes and provides independent judgments of each p
environmentalfriendliness.”The traditionalversionof the
laundry detergent was rated as a five out of 10 (average)
the eco-friendly version was rated as a 10 out of 10 (supe
the EPC. Participants were asked how much they would p
the eco-friendly version. To provide a useful anchor, the r
version of the product was stated to retail at $7.99.
Finally,participants were shown information aboutan all-
purpose cleaner presented as “Non-toxic, biodegradable,
for the environment.” They were then asked to rate how
were to buy this cleaner on a nine-point scale, with highe
indicating stronger likelihood of purchase. After completi
three green consumption relevant decisions and a distrac
consisting of evaluating pictures unrelated to the currentstudy,
participants once again completed our GREEN scale to as
test–retest reliability. See Appendix A for study stimuli.
5.2. Results
All measures were assessed for reliability (see Table 3)
averaged into indices following the instructions of the ori
scales.Consistentwith theirtreatmentin the originalscale
developmentby Straughan and Roberts (1999),we examined
6 We note that we included SRPD as opposed to several other environmental
scales because Webb etal. (2008)demonstrated greatervalidity ofSRPD
relative to other environmental scales. Thus, we felt inclusion of SRPD was a
succinct way to effectively compare GREEN to numerous past measures.
341K.L. Haws et al. / Journal of Consumer Psychology 24, 3 (2014) 336–354
⊘ This is a preview!⊘
Do you want full access?
Subscribe today to unlock all pages.
Trusted by 1+ million students worldwide
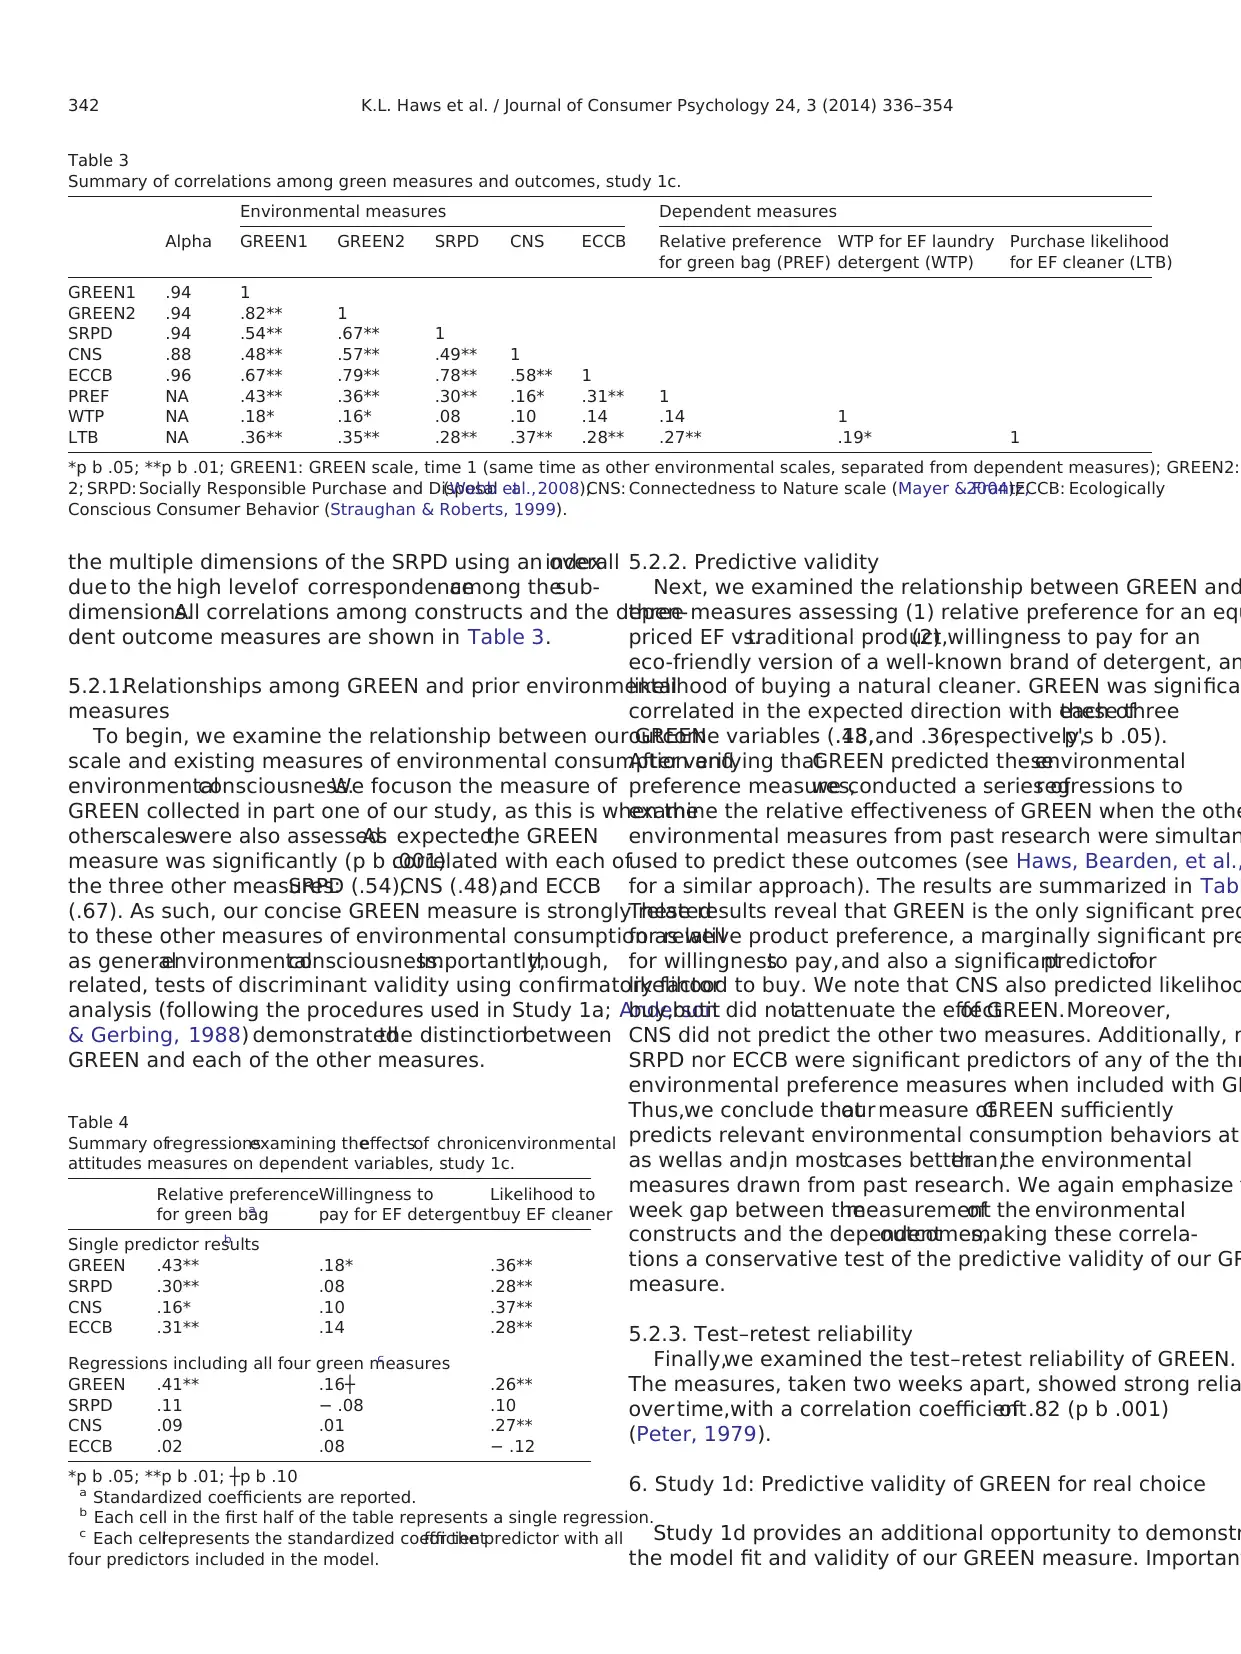
the multiple dimensions of the SRPD using an overallindex
due to the high levelof correspondenceamong thesub-
dimensions.All correlations among constructs and the depen-
dent outcome measures are shown in Table 3.
5.2.1.Relationships among GREEN and prior environmental
measures
To begin, we examine the relationship between our GREEN
scale and existing measures of environmental consumption and
environmentalconsciousness.We focuson the measure of
GREEN collected in part one of our study, as this is when the
otherscaleswere also assessed.As expected,the GREEN
measure was significantly (p b .001)correlated with each of
the three other measures:SRPD (.54),CNS (.48),and ECCB
(.67). As such, our concise GREEN measure is strongly related
to these other measures of environmental consumption as well
as generalenvironmentalconsciousness.Importantly,though,
related, tests of discriminant validity using confirmatory factor
analysis (following the procedures used in Study 1a; Anderson
& Gerbing, 1988) demonstratedthe distinctionbetween
GREEN and each of the other measures.
5.2.2. Predictive validity
Next, we examined the relationship between GREEN and
three measures assessing (1) relative preference for an equ
priced EF vs.traditional product,(2) willingness to pay for an
eco-friendly version of a well-known brand of detergent, an
likelihood of buying a natural cleaner. GREEN was significa
correlated in the expected direction with each ofthese three
outcome variables (.43,.18,and .36,respectively,p's b .05).
After verifying thatGREEN predicted theseenvironmental
preference measures,we conducted a series ofregressions to
examine the relative effectiveness of GREEN when the othe
environmental measures from past research were simultan
used to predict these outcomes (see Haws, Bearden, et al.,
for a similar approach). The results are summarized in Tabl
These results reveal that GREEN is the only significant pred
for relative product preference, a marginally significant pre
for willingnessto pay,and also a significantpredictorfor
likelihood to buy. We note that CNS also predicted likelihoo
buy,butit did notattenuate the effectof GREEN.Moreover,
CNS did not predict the other two measures. Additionally, n
SRPD nor ECCB were significant predictors of any of the thr
environmental preference measures when included with GR
Thus,we conclude thatour measure ofGREEN sufficiently
predicts relevant environmental consumption behaviors at
as wellas and,in mostcases betterthan,the environmental
measures drawn from past research. We again emphasize t
week gap between themeasurementof the environmental
constructs and the dependentoutcomes,making these correla-
tions a conservative test of the predictive validity of our GR
measure.
5.2.3. Test–retest reliability
Finally,we examined the test–retest reliability of GREEN.
The measures, taken two weeks apart, showed strong relia
over time,with a correlation coefficientof .82 (p b .001)
(Peter, 1979).
6. Study 1d: Predictive validity of GREEN for real choice
Study 1d provides an additional opportunity to demonstr
the model fit and validity of our GREEN measure. Importan
Table 3
Summary of correlations among green measures and outcomes, study 1c.
Environmental measures Dependent measures
Alpha GREEN1 GREEN2 SRPD CNS ECCB Relative preference
for green bag (PREF)
WTP for EF laundry
detergent (WTP)
Purchase likelihood
for EF cleaner (LTB)
GREEN1 .94 1
GREEN2 .94 .82** 1
SRPD .94 .54** .67** 1
CNS .88 .48** .57** .49** 1
ECCB .96 .67** .79** .78** .58** 1
PREF NA .43** .36** .30** .16* .31** 1
WTP NA .18* .16* .08 .10 .14 .14 1
LTB NA .36** .35** .28** .37** .28** .27** .19* 1
*p b .05; **p b .01; GREEN1: GREEN scale, time 1 (same time as other environmental scales, separated from dependent measures); GREEN2:
2; SRPD: Socially Responsible Purchase and Disposal(Webb etal.,2008);CNS: Connectedness to Nature scale (Mayer & Frantz,2004);ECCB: Ecologically
Conscious Consumer Behavior (Straughan & Roberts, 1999).
Table 4
Summary ofregressionsexamining theeffectsof chronicenvironmental
attitudes measures on dependent variables, study 1c.
Relative preference
for green baga
Willingness to
pay for EF detergent
Likelihood to
buy EF cleaner
Single predictor resultsb
GREEN .43** .18* .36**
SRPD .30** .08 .28**
CNS .16* .10 .37**
ECCB .31** .14 .28**
Regressions including all four green measuresc
GREEN .41** .16┼ .26**
SRPD .11 − .08 .10
CNS .09 .01 .27**
ECCB .02 .08 − .12
*p b .05; **p b .01; ┼p b .10
a Standardized coefficients are reported.
b Each cell in the first half of the table represents a single regression.
c Each cellrepresents the standardized coefficientfor the predictor with all
four predictors included in the model.
342 K.L. Haws et al. / Journal of Consumer Psychology 24, 3 (2014) 336–354
Paraphrase This Document
Need a fresh take? Get an instant paraphrase of this document with our AI Paraphraser
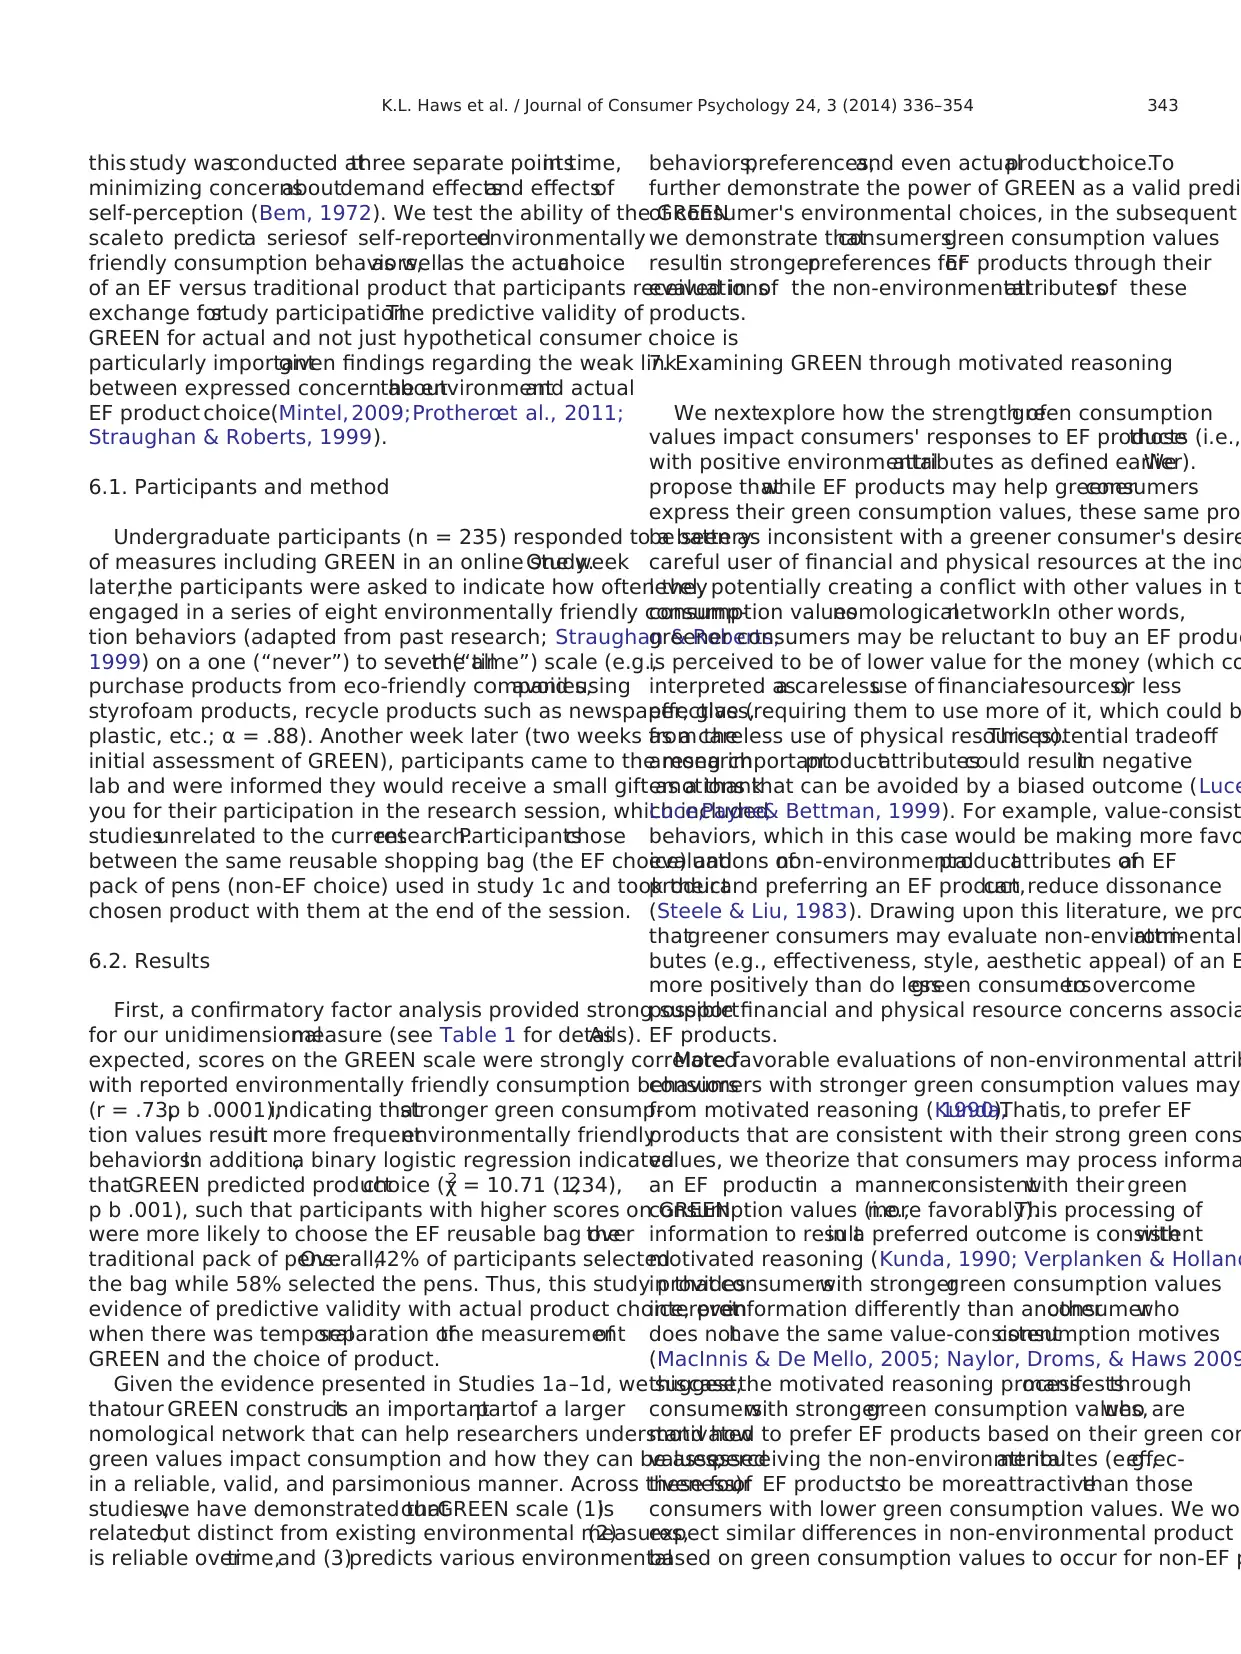
this study wasconducted atthree separate pointsin time,
minimizing concernsaboutdemand effectsand effectsof
self-perception (Bem, 1972). We test the ability of the GREEN
scaleto predicta seriesof self-reportedenvironmentally
friendly consumption behaviors,as wellas the actualchoice
of an EF versus traditional product that participants received in
exchange forstudy participation.The predictive validity of
GREEN for actual and not just hypothetical consumer choice is
particularly importantgiven findings regarding the weak link
between expressed concern aboutthe environmentand actual
EF product choice(Mintel, 2009;Protheroet al., 2011;
Straughan & Roberts, 1999).
6.1. Participants and method
Undergraduate participants (n = 235) responded to a battery
of measures including GREEN in an online study.One week
later,the participants were asked to indicate how often they
engaged in a series of eight environmentally friendly consump-
tion behaviors (adapted from past research; Straughan & Roberts,
1999) on a one (“never”) to seven (“allthe time”) scale (e.g.,
purchase products from eco-friendly companies,avoid using
styrofoam products, recycle products such as newspaper, glass,
plastic, etc.; α = .88). Another week later (two weeks from the
initial assessment of GREEN), participants came to the research
lab and were informed they would receive a small gift as a thank
you for their participation in the research session, which included
studiesunrelated to the currentresearch.Participantschose
between the same reusable shopping bag (the EF choice) and
pack of pens (non-EF choice) used in study 1c and took their
chosen product with them at the end of the session.
6.2. Results
First, a confirmatory factor analysis provided strong support
for our unidimensionalmeasure (see Table 1 for details).As
expected, scores on the GREEN scale were strongly correlated
with reported environmentally friendly consumption behaviors
(r = .73,p b .0001),indicating thatstronger green consump-
tion values resultin more frequentenvironmentally friendly
behaviors.In addition,a binary logistic regression indicated
thatGREEN predicted productchoice (χ2 = 10.71 (1,234),
p b .001), such that participants with higher scores on GREEN
were more likely to choose the EF reusable bag overthe
traditional pack of pens.Overall,42% of participants selected
the bag while 58% selected the pens. Thus, this study provides
evidence of predictive validity with actual product choice, even
when there was temporalseparation ofthe measurementof
GREEN and the choice of product.
Given the evidence presented in Studies 1a–1d, we suggest
thatour GREEN constructis an importantpartof a larger
nomological network that can help researchers understand how
green values impact consumption and how they can be assessed
in a reliable, valid, and parsimonious manner. Across these four
studies,we have demonstrated thatourGREEN scale (1)is
related,but distinct from existing environmental measures,(2)
is reliable overtime,and (3)predicts various environmental
behaviors,preferences,and even actualproductchoice.To
further demonstrate the power of GREEN as a valid predi
of consumer's environmental choices, in the subsequent
we demonstrate thatconsumers'green consumption values
resultin strongerpreferences forEF products through their
evaluationsof the non-environmentalattributesof these
products.
7. Examining GREEN through motivated reasoning
We nextexplore how the strength ofgreen consumption
values impact consumers' responses to EF products (i.e.,those
with positive environmentalattributes as defined earlier).We
propose thatwhile EF products may help greenerconsumers
express their green consumption values, these same pro
be seen as inconsistent with a greener consumer's desire
careful user of financial and physical resources at the ind
level, potentially creating a conflict with other values in t
consumption valuesnomologicalnetwork.In other words,
greener consumers may be reluctant to buy an EF produc
is perceived to be of lower value for the money (which co
interpreted asa carelessuse of financialresources)or less
effective (requiring them to use more of it, which could b
as a careless use of physical resources).This potential tradeoff
among importantproductattributescould resultin negative
emotions that can be avoided by a biased outcome (Luce
Luce,Payne,& Bettman, 1999). For example, value-consist
behaviors, which in this case would be making more favo
evaluations ofnon-environmentalproductattributes ofan EF
productand preferring an EF product,can reduce dissonance
(Steele & Liu, 1983). Drawing upon this literature, we pro
thatgreener consumers may evaluate non-environmentalattri-
butes (e.g., effectiveness, style, aesthetic appeal) of an E
more positively than do lessgreen consumersto overcome
possible financial and physical resource concerns associa
EF products.
More favorable evaluations of non-environmental attrib
consumers with stronger green consumption values may
from motivated reasoning (Kunda,1990).Thatis, to prefer EF
products that are consistent with their strong green cons
values, we theorize that consumers may process informa
an EF productin a mannerconsistentwith their green
consumption values (i.e.,more favorably).This processing of
information to resultin a preferred outcome is consistentwith
motivated reasoning (Kunda, 1990; Verplanken & Holland
in that consumerswith strongergreen consumption values
interpretinformation differently than anotherconsumerwho
does nothave the same value-consistentconsumption motives
(MacInnis & De Mello, 2005; Naylor, Droms, & Haws 2009
thiscase,the motivated reasoning processmanifeststhrough
consumerswith strongergreen consumption values,who are
motivated to prefer EF products based on their green con
values,perceiving the non-environmentalattributes (e.g.,effec-
tiveness)of EF productsto be moreattractivethan those
consumers with lower green consumption values. We wo
expect similar differences in non-environmental product
based on green consumption values to occur for non-EF p
343K.L. Haws et al. / Journal of Consumer Psychology 24, 3 (2014) 336–354
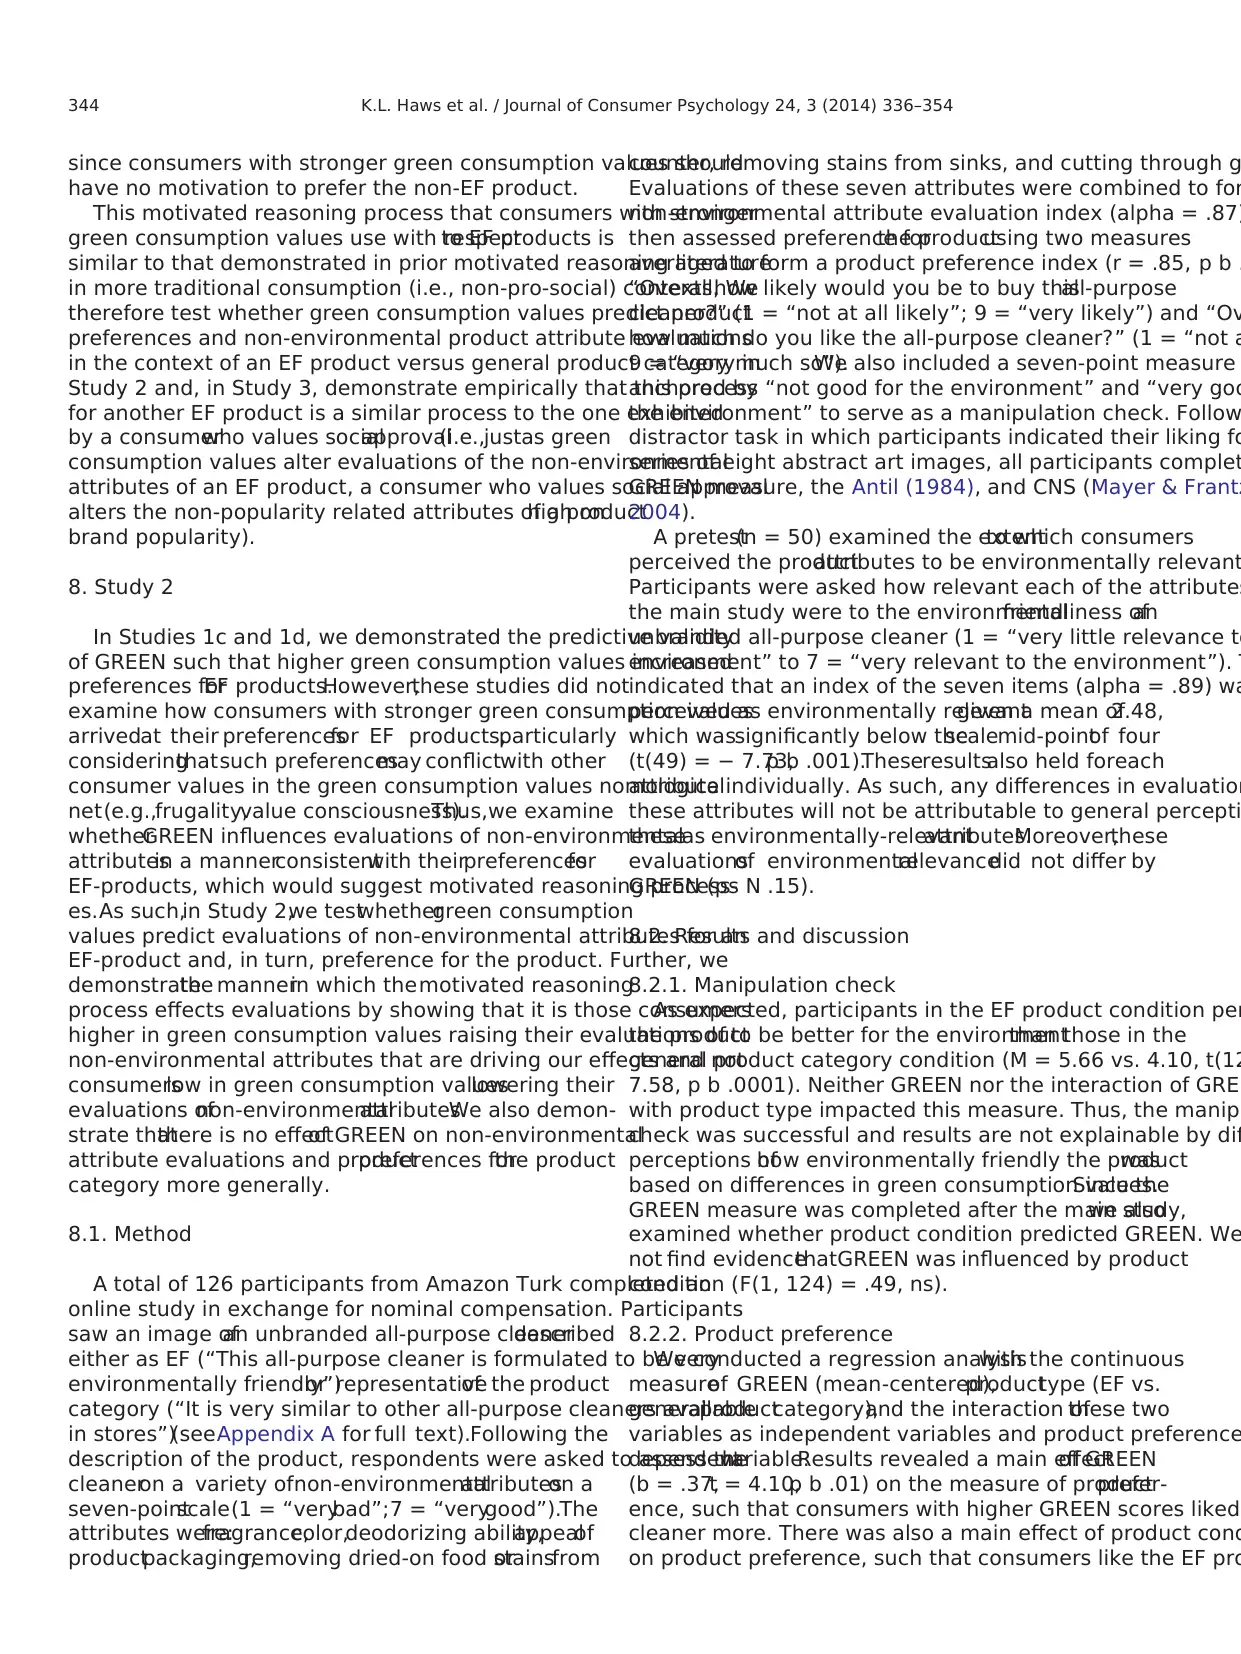
since consumers with stronger green consumption values should
have no motivation to prefer the non-EF product.
This motivated reasoning process that consumers with stronger
green consumption values use with respectto EF products is
similar to that demonstrated in prior motivated reasoning literature
in more traditional consumption (i.e., non-pro-social) contexts. We
therefore test whether green consumption values predict product
preferences and non-environmental product attribute evaluations
in the context of an EF product versus general product category in
Study 2 and, in Study 3, demonstrate empirically that this process
for another EF product is a similar process to the one exhibited
by a consumerwho values socialapproval(i.e.,justas green
consumption values alter evaluations of the non-environmental
attributes of an EF product, a consumer who values social approval
alters the non-popularity related attributes of a producthigh on
brand popularity).
8. Study 2
In Studies 1c and 1d, we demonstrated the predictive validity
of GREEN such that higher green consumption values increased
preferences forEF products.However,these studies did not
examine how consumers with stronger green consumption values
arrivedat their preferencesfor EF products,particularly
consideringthatsuch preferencesmay conflictwith other
consumer values in the green consumption values nomological
net(e.g.,frugality,value consciousness).Thus,we examine
whetherGREEN influences evaluations of non-environmental
attributesin a mannerconsistentwith theirpreferencesfor
EF-products, which would suggest motivated reasoning process-
es.As such,in Study 2,we testwhethergreen consumption
values predict evaluations of non-environmental attributes for an
EF-product and, in turn, preference for the product. Further, we
demonstratethe mannerin which themotivated reasoning
process effects evaluations by showing that it is those consumers
higher in green consumption values raising their evaluations of
non-environmental attributes that are driving our effects and not
consumerslow in green consumption valueslowering their
evaluations ofnon-environmentalattributes.We also demon-
strate thatthere is no effectof GREEN on non-environmental
attribute evaluations and productpreferences forthe product
category more generally.
8.1. Method
A total of 126 participants from Amazon Turk completed an
online study in exchange for nominal compensation. Participants
saw an image ofan unbranded all-purpose cleanerdescribed
either as EF (“This all-purpose cleaner is formulated to be very
environmentally friendly”)or representativeof the product
category (“It is very similar to other all-purpose cleaners available
in stores”)(seeAppendix A for full text).Following the
description of the product, respondents were asked to assess the
cleaneron a variety ofnon-environmentalattributeson a
seven-pointscale(1 = “verybad”;7 = “verygood”).The
attributes were:fragrance,color,deodorizing ability,appealof
productpackaging,removing dried-on food orstainsfrom
counter, removing stains from sinks, and cutting through g
Evaluations of these seven attributes were combined to for
non-environmental attribute evaluation index (alpha = .87)
then assessed preference forthe productusing two measures
averaged to form a product preference index (r = .85, p b .
“Overall,how likely would you be to buy thisall-purpose
cleaner?” (1 = “not at all likely”; 9 = “very likely”) and “Ov
how much do you like the all-purpose cleaner?” (1 = “not a
9 = “very much so”).We also included a seven-point measure
anchored by “not good for the environment” and “very goo
the environment” to serve as a manipulation check. Follow
distractor task in which participants indicated their liking fo
series of eight abstract art images, all participants complet
GREEN measure, the Antil (1984), and CNS (Mayer & Frantz
2004).
A pretest(n = 50) examined the extentto which consumers
perceived the productattributes to be environmentally relevant
Participants were asked how relevant each of the attributes
the main study were to the environmentalfriendliness ofan
unbranded all-purpose cleaner (1 = “very little relevance to
environment” to 7 = “very relevant to the environment”). T
indicated that an index of the seven items (alpha = .89) wa
perceived as environmentally relevantgiven a mean of2.48,
which wassignificantly below thescalemid-pointof four
(t(49) = − 7.73,p b .001).Theseresultsalso held foreach
attribute individually. As such, any differences in evaluation
these attributes will not be attributable to general percepti
theseas environmentally-relevantattributes.Moreover,these
evaluationsof environmentalrelevancedid not differ by
GREEN (ps N .15).
8.2. Results and discussion
8.2.1. Manipulation check
As expected, participants in the EF product condition per
the productto be better for the environmentthan those in the
general product category condition (M = 5.66 vs. 4.10, t(12
7.58, p b .0001). Neither GREEN nor the interaction of GREE
with product type impacted this measure. Thus, the manipu
check was successful and results are not explainable by diff
perceptions ofhow environmentally friendly the productwas
based on differences in green consumption values.Since the
GREEN measure was completed after the main study,we also
examined whether product condition predicted GREEN. We
not find evidencethatGREEN was influenced by product
condition (F(1, 124) = .49, ns).
8.2.2. Product preference
We conducted a regression analysiswith the continuous
measureof GREEN (mean-centered),producttype (EF vs.
generalproductcategory),and the interaction ofthese two
variables as independent variables and product preference
dependentvariable.Results revealed a main effectof GREEN
(b = .37,t = 4.10,p b .01) on the measure of productprefer-
ence, such that consumers with higher GREEN scores liked
cleaner more. There was also a main effect of product cond
on product preference, such that consumers like the EF pro
344 K.L. Haws et al. / Journal of Consumer Psychology 24, 3 (2014) 336–354
⊘ This is a preview!⊘
Do you want full access?
Subscribe today to unlock all pages.
Trusted by 1+ million students worldwide
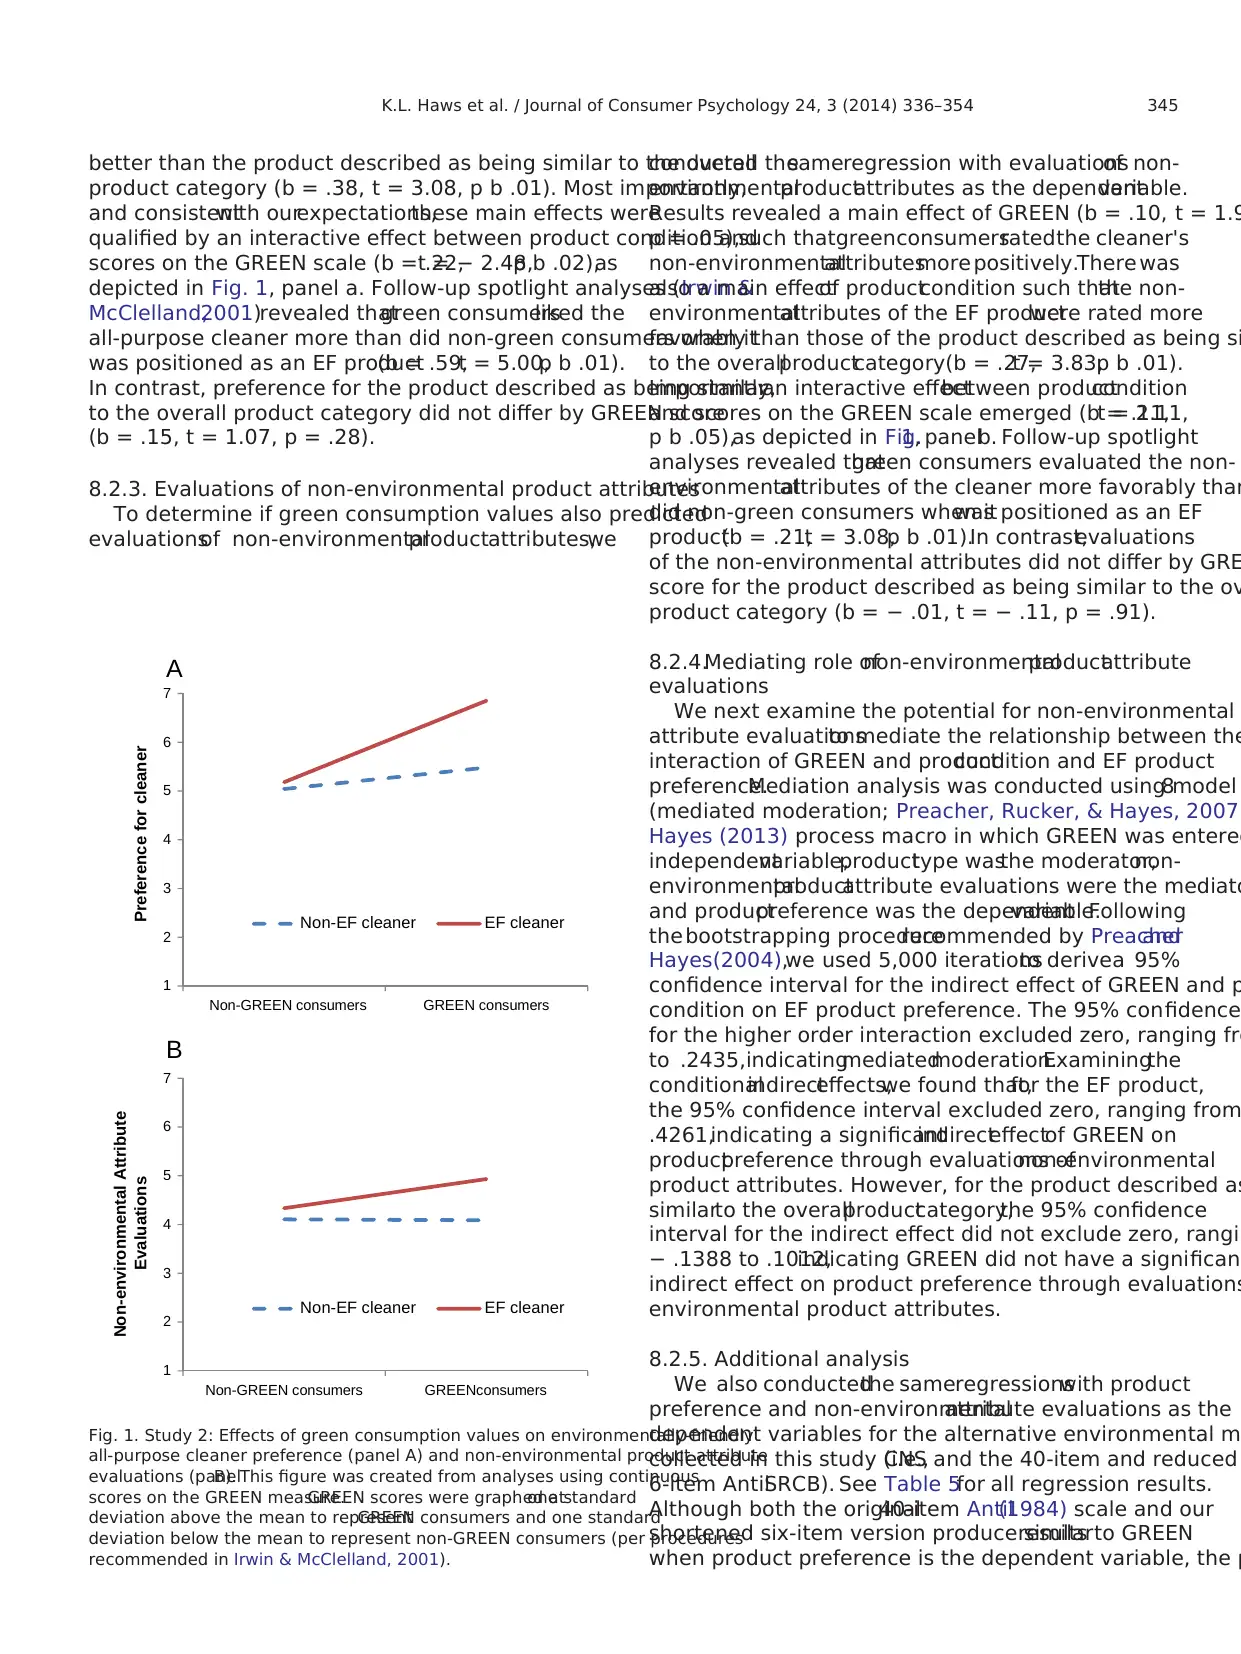
better than the product described as being similar to the overall
product category (b = .38, t = 3.08, p b .01). Most importantly,
and consistentwith ourexpectations,these main effects were
qualified by an interactive effect between product condition and
scores on the GREEN scale (b = .22,t = − 2.48,p b .02),as
depicted in Fig. 1, panel a. Follow-up spotlight analyses (Irwin &
McClelland,2001)revealed thatgreen consumersliked the
all-purpose cleaner more than did non-green consumers when it
was positioned as an EF product(b = .59,t = 5.00,p b .01).
In contrast, preference for the product described as being similar
to the overall product category did not differ by GREEN score
(b = .15, t = 1.07, p = .28).
8.2.3. Evaluations of non-environmental product attributes
To determine if green consumption values also predicted
evaluationsof non-environmentalproductattributes,we
conducted thesameregression with evaluationsof non-
environmentalproductattributes as the dependentvariable.
Results revealed a main effect of GREEN (b = .10, t = 1.9
p = .05),such thatgreenconsumersratedthe cleaner's
non-environmentalattributesmore positively.There was
also a main effectof productcondition such thatthe non-
environmentalattributes of the EF productwere rated more
favorably than those of the product described as being si
to the overallproductcategory(b = .27,t = 3.83,p b .01).
Importantly,an interactive effectbetween productcondition
and scores on the GREEN scale emerged (b = .11,t = 2.11,
p b .05),as depicted in Fig.1, panelb. Follow-up spotlight
analyses revealed thatgreen consumers evaluated the non-
environmentalattributes of the cleaner more favorably than
did non-green consumers when itwas positioned as an EF
product(b = .21,t = 3.08,p b .01).In contrast,evaluations
of the non-environmental attributes did not differ by GRE
score for the product described as being similar to the ov
product category (b = − .01, t = − .11, p = .91).
8.2.4.Mediating role ofnon-environmentalproductattribute
evaluations
We next examine the potential for non-environmental
attribute evaluationsto mediate the relationship between the
interaction of GREEN and productcondition and EF product
preference.Mediation analysis was conducted using model8
(mediated moderation; Preacher, Rucker, & Hayes, 2007)
Hayes (2013) process macro in which GREEN was entered
independentvariable,producttype wasthe moderator,non-
environmentalproductattribute evaluations were the mediato
and productpreference was the dependentvariable.Following
the bootstrapping procedurerecommended by Preacherand
Hayes(2004),we used 5,000 iterationsto derivea 95%
confidence interval for the indirect effect of GREEN and p
condition on EF product preference. The 95% confidence
for the higher order interaction excluded zero, ranging fro
to .2435,indicatingmediatedmoderation.Examiningthe
conditionalindirecteffects,we found that,for the EF product,
the 95% confidence interval excluded zero, ranging from
.4261,indicating a significantindirecteffectof GREEN on
productpreference through evaluations ofnon-environmental
product attributes. However, for the product described as
similarto the overallproductcategory,the 95% confidence
interval for the indirect effect did not exclude zero, rangin
− .1388 to .1012,indicating GREEN did not have a significan
indirect effect on product preference through evaluations
environmental product attributes.
8.2.5. Additional analysis
We also conductedthe sameregressionswith product
preference and non-environmentalattribute evaluations as the
dependent variables for the alternative environmental m
collected in this study (i.e.,CNS and the 40-item and reduced
6-item AntilSRCB). See Table 5for all regression results.
Although both the original40-item Antil(1984) scale and our
shortened six-item version produce similarresults to GREEN
when product preference is the dependent variable, the p
A
B
1
2
3
4
5
6
7
Non-GREEN consumers GREEN consumers
Preference for cleaner
Non-EF cleaner EF cleaner
1
2
3
4
5
6
7
Non-GREEN consumers GREENconsumers
Non-environmental Attribute
Evaluations
Non-EF cleaner EF cleaner
Fig. 1. Study 2: Effects of green consumption values on environmentally-friendly
all-purpose cleaner preference (panel A) and non-environmental product attribute
evaluations (panelB). This figure was created from analyses using continuous
scores on the GREEN measure.GREEN scores were graphed atone standard
deviation above the mean to representGREEN consumers and one standard
deviation below the mean to represent non-GREEN consumers (per procedures
recommended in Irwin & McClelland, 2001).
345K.L. Haws et al. / Journal of Consumer Psychology 24, 3 (2014) 336–354
Paraphrase This Document
Need a fresh take? Get an instant paraphrase of this document with our AI Paraphraser
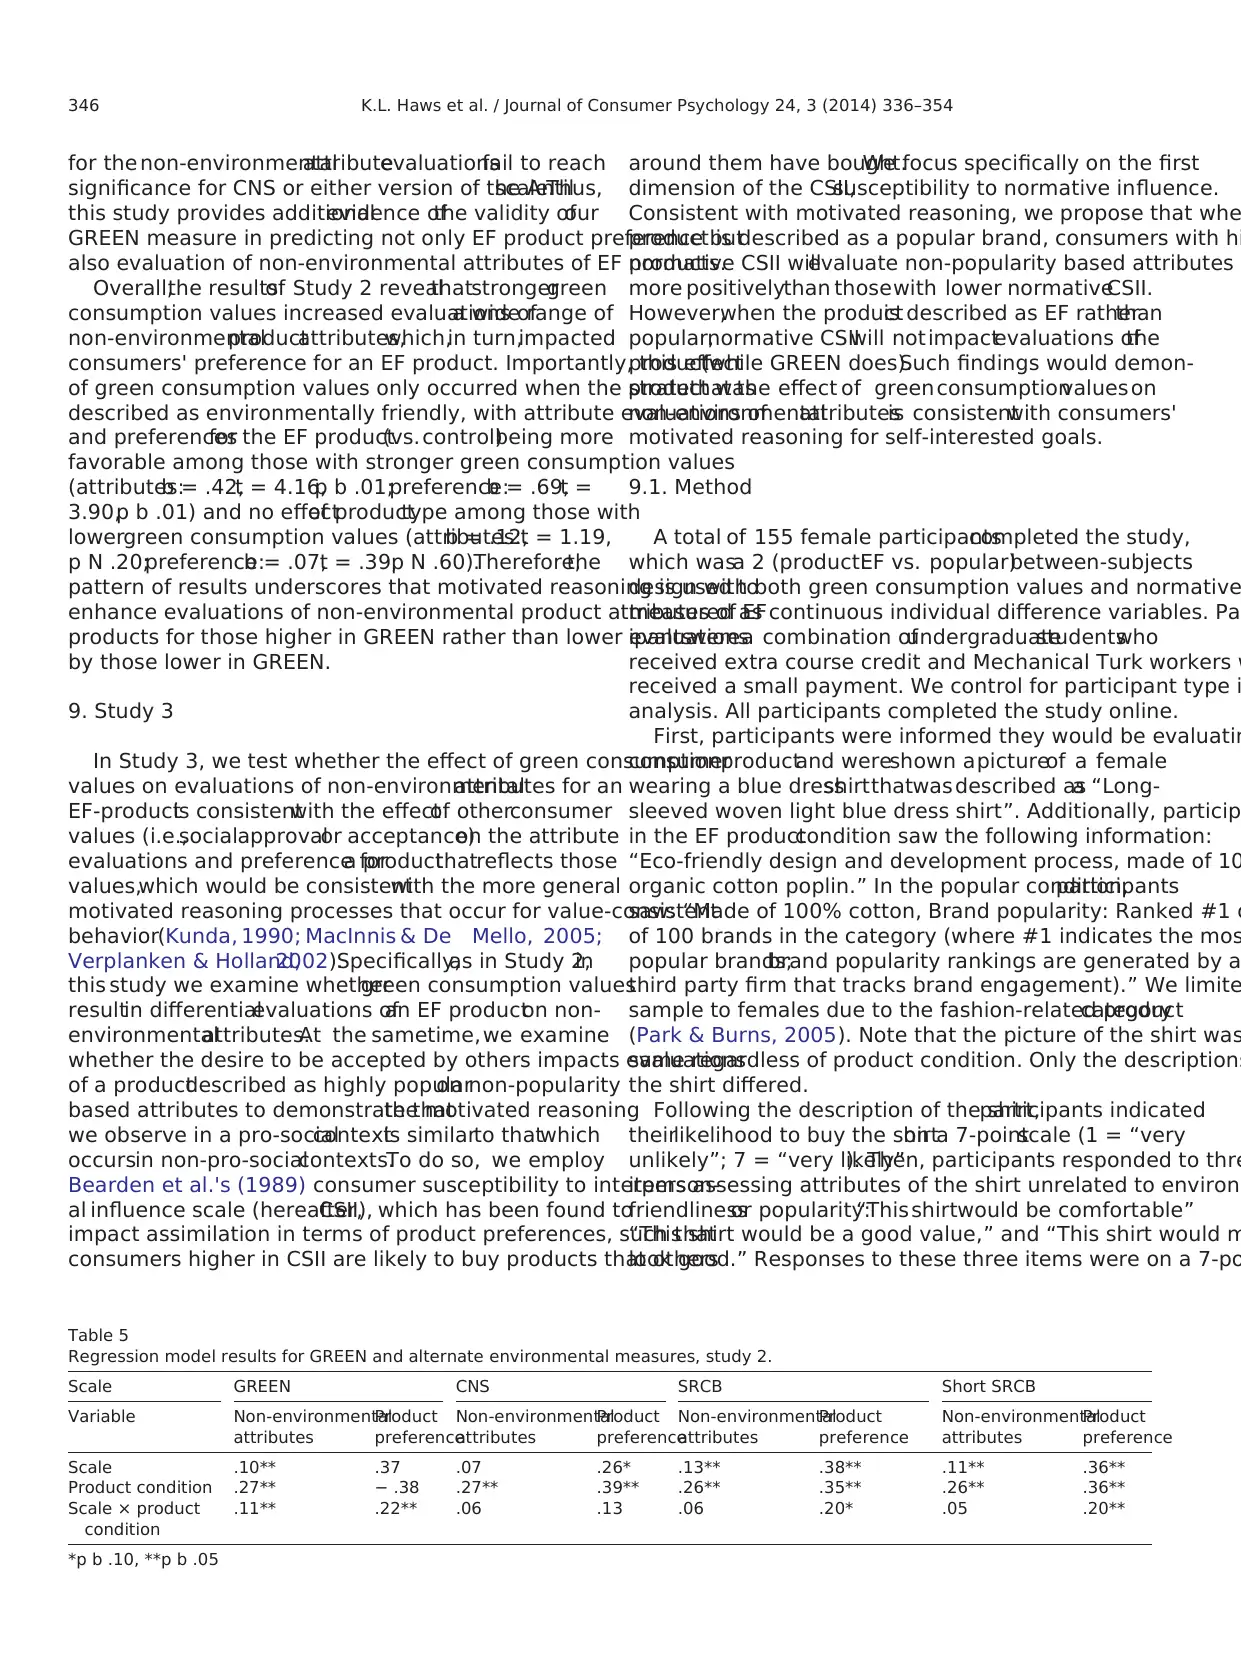
for the non-environmentalattributeevaluationsfail to reach
significance for CNS or either version of the Antilscale.Thus,
this study provides additionalevidence ofthe validity ofour
GREEN measure in predicting not only EF product preference but
also evaluation of non-environmental attributes of EF products.
Overall,the resultsof Study 2 revealthatstrongergreen
consumption values increased evaluations ofa wide range of
non-environmentalproductattributes,which,in turn,impacted
consumers' preference for an EF product. Importantly, this effect
of green consumption values only occurred when the product was
described as environmentally friendly, with attribute evaluations of
and preferencesfor the EF product(vs. control)being more
favorable among those with stronger green consumption values
(attributes:b = .42,t = 4.16,p b .01;preference:b = .69,t =
3.90,p b .01) and no effectof producttype among those with
lowergreen consumption values (attributes:b = .12,t = 1.19,
p N .20;preference:b = .07,t = .39,p N .60).Therefore,the
pattern of results underscores that motivated reasoning is used to
enhance evaluations of non-environmental product attributes of EF
products for those higher in GREEN rather than lower evaluations
by those lower in GREEN.
9. Study 3
In Study 3, we test whether the effect of green consumption
values on evaluations of non-environmentalattributes for an
EF-productis consistentwith the effectof otherconsumer
values (i.e.,socialapprovalor acceptance)on the attribute
evaluations and preference fora productthatreflects those
values,which would be consistentwith the more general
motivated reasoning processes that occur for value-consistent
behavior(Kunda, 1990; MacInnis & De Mello, 2005;
Verplanken & Holland,2002).Specifically,as in Study 2,in
this study we examine whethergreen consumption values
resultin differentialevaluations ofan EF producton non-
environmentalattributes.At the sametime, we examine
whether the desire to be accepted by others impacts evaluations
of a productdescribed as highly popularon non-popularity
based attributes to demonstrate thatthe motivated reasoning
we observe in a pro-socialcontextis similarto thatwhich
occursin non-pro-socialcontexts.To do so, we employ
Bearden et al.'s (1989) consumer susceptibility to interperson-
al influence scale (hereafter,CSII), which has been found to
impact assimilation in terms of product preferences, such that
consumers higher in CSII are likely to buy products that others
around them have bought.We focus specifically on the first
dimension of the CSII,susceptibility to normative influence.
Consistent with motivated reasoning, we propose that whe
product is described as a popular brand, consumers with hi
normative CSII willevaluate non-popularity based attributes
more positivelythan thosewith lower normativeCSII.
However,when the productis described as EF ratherthan
popular,normative CSIIwill not impactevaluations ofthe
product(while GREEN does).Such findings would demon-
stratethat the effect of green consumptionvalues on
non-environmentalattributesis consistentwith consumers'
motivated reasoning for self-interested goals.
9.1. Method
A total of 155 female participantscompleted the study,
which wasa 2 (product:EF vs. popular)between-subjects
design with both green consumption values and normative
measured as continuous individual difference variables. Pa
ipantswerea combination ofundergraduatestudentswho
received extra course credit and Mechanical Turk workers w
received a small payment. We control for participant type i
analysis. All participants completed the study online.
First, participants were informed they would be evaluatin
consumerproductand wereshown apictureof a female
wearing a blue dressshirtthatwas described asa “Long-
sleeved woven light blue dress shirt”. Additionally, particip
in the EF productcondition saw the following information:
“Eco-friendly design and development process, made of 10
organic cotton poplin.” In the popular condition,participants
saw: “Made of 100% cotton, Brand popularity: Ranked #1 o
of 100 brands in the category (where #1 indicates the mos
popular brands;brand popularity rankings are generated by a
third party firm that tracks brand engagement).” We limite
sample to females due to the fashion-related productcategory
(Park & Burns, 2005). Note that the picture of the shirt was
same regardless of product condition. Only the descriptions
the shirt differed.
Following the description of the shirt,participants indicated
theirlikelihood to buy the shirton a 7-pointscale (1 = “very
unlikely”; 7 = “very likely”). Then, participants responded to thre
items assessing attributes of the shirt unrelated to environm
friendlinessor popularity:“This shirtwould be comfortable”
“This shirt would be a good value,” and “This shirt would m
look good.” Responses to these three items were on a 7-po
Table 5
Regression model results for GREEN and alternate environmental measures, study 2.
Scale GREEN CNS SRCB Short SRCB
Variable Non-environmental
attributes
Product
preference
Non-environmental
attributes
Product
preference
Non-environmental
attributes
Product
preference
Non-environmental
attributes
Product
preference
Scale .10** .37 .07 .26* .13** .38** .11** .36**
Product condition .27** − .38 .27** .39** .26** .35** .26** .36**
Scale × product
condition
.11** .22** .06 .13 .06 .20* .05 .20**
*p b .10, **p b .05
346 K.L. Haws et al. / Journal of Consumer Psychology 24, 3 (2014) 336–354
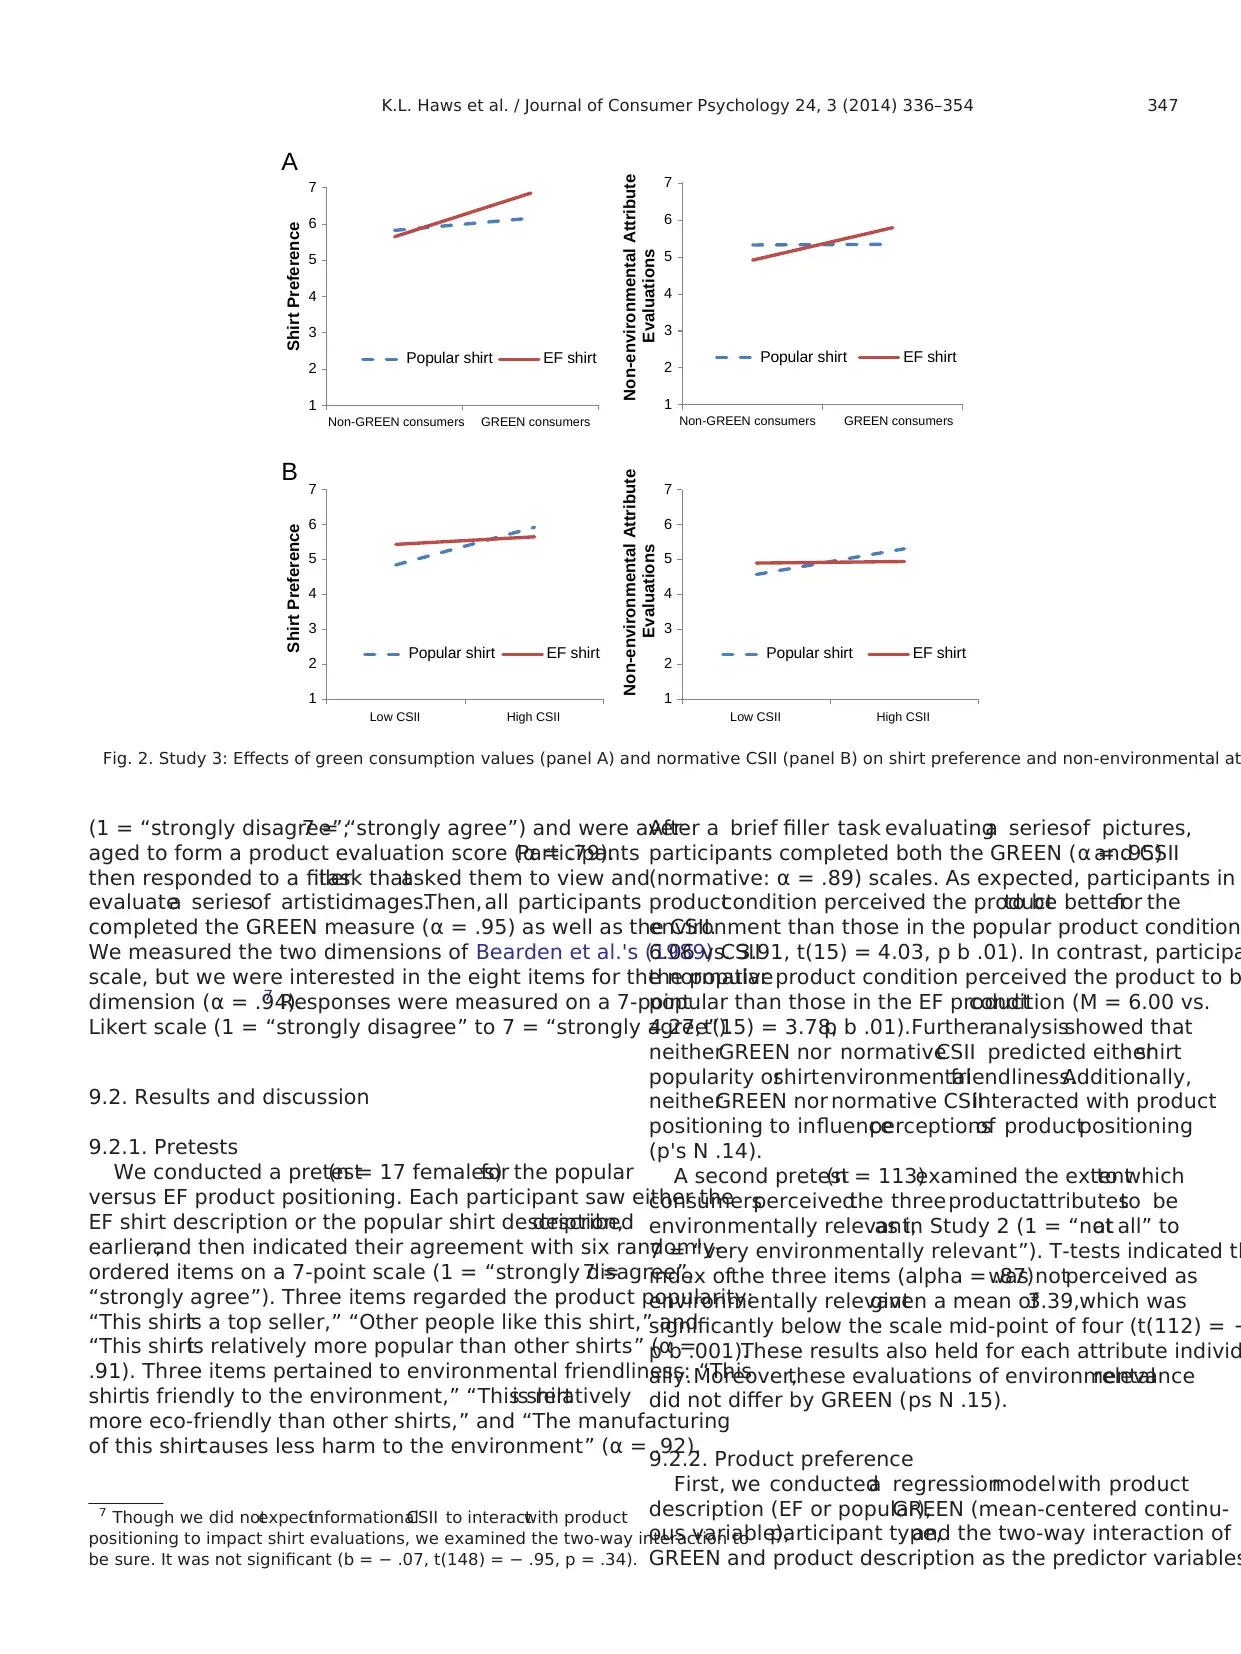
(1 = “strongly disagree”;7 = “strongly agree”) and were aver-
aged to form a product evaluation score (α = .79).Participants
then responded to a fillertask thatasked them to view and
evaluatea seriesof artisticimages.Then, all participants
completed the GREEN measure (α = .95) as well as the CSII.
We measured the two dimensions of Bearden et al.'s (1989) CSII
scale, but we were interested in the eight items for the normative
dimension (α = .94).7 Responses were measured on a 7-point
Likert scale (1 = “strongly disagree” to 7 = “strongly agree”).
9.2. Results and discussion
9.2.1. Pretests
We conducted a pretest(n = 17 females)for the popular
versus EF product positioning. Each participant saw either the
EF shirt description or the popular shirt description,described
earlier,and then indicated their agreement with six randomly-
ordered items on a 7-point scale (1 = “strongly disagree”,7 =
“strongly agree”). Three items regarded the product popularity:
“This shirtis a top seller,” “Other people like this shirt,” and
“This shirtis relatively more popular than other shirts” (α =
.91). Three items pertained to environmental friendliness: “This
shirtis friendly to the environment,” “This shirtis relatively
more eco-friendly than other shirts,” and “The manufacturing
of this shirtcauses less harm to the environment” (α = .92).
After a brief filler task evaluatinga seriesof pictures,
participants completed both the GREEN (α = .95)and CSII
(normative: α = .89) scales. As expected, participants in
productcondition perceived the productto be betterfor the
environment than those in the popular product condition
6.06 vs. 3.91, t(15) = 4.03, p b .01). In contrast, participa
the popular product condition perceived the product to b
popular than those in the EF productcondition (M = 6.00 vs.
4.27, t(15) = 3.78,p b .01).Furtheranalysisshowed that
neitherGREEN nor normativeCSII predicted eithershirt
popularity orshirtenvironmentalfriendliness.Additionally,
neitherGREEN nor normative CSIIinteracted with product
positioning to influenceperceptionsof productpositioning
(p's N .14).
A second pretest(n = 113)examined the extentto which
consumersperceivedthe threeproductattributesto be
environmentally relevant,as in Study 2 (1 = “notat all” to
7 = “very environmentally relevant”). T-tests indicated th
index ofthe three items (alpha = .87)was notperceived as
environmentally relevantgiven a mean of3.39,which was
significantly below the scale mid-point of four (t(112) = −
p b .001).These results also held for each attribute individ
ally.Moreover,these evaluations of environmentalrelevance
did not differ by GREEN (ps N .15).
9.2.2. Product preference
First, we conducteda regressionmodelwith product
description (EF or popular),GREEN (mean-centered continu-
ous variable),participant type,and the two-way interaction of
GREEN and product description as the predictor variables
7 Though we did notexpectinformationalCSII to interactwith product
positioning to impact shirt evaluations, we examined the two-way interaction to
be sure. It was not significant (b = − .07, t(148) = − .95, p = .34).
B
A
1
2
3
4
5
6
7
Non-GREEN consumers GREEN consumers
Shirt Preference
Popular shirt EF shirt
1
2
3
4
5
6
7
Non-GREEN consumers GREEN consumers
Non-environmental Attribute
Evaluations
Popular shirt EF shirt
1
2
3
4
5
6
7
Low CSII High CSII
Shirt Preference
Popular shirt EF shirt
1
2
3
4
5
6
7
Low CSII High CSII
Non-environmental Attribute
Evaluations
Popular shirt EF shirt
Fig. 2. Study 3: Effects of green consumption values (panel A) and normative CSII (panel B) on shirt preference and non-environmental at
347K.L. Haws et al. / Journal of Consumer Psychology 24, 3 (2014) 336–354
⊘ This is a preview!⊘
Do you want full access?
Subscribe today to unlock all pages.
Trusted by 1+ million students worldwide
1 out of 19

Your All-in-One AI-Powered Toolkit for Academic Success.
+13062052269
info@desklib.com
Available 24*7 on WhatsApp / Email
![[object Object]](/_next/static/media/star-bottom.7253800d.svg)
Unlock your academic potential
Copyright © 2020–2025 A2Z Services. All Rights Reserved. Developed and managed by ZUCOL.