VCE Mathematics Unit 1 Teaching: Functions, Graphs, and Pedagogy
VerifiedAdded on 2023/06/10
|3
|928
|283
Report
AI Summary
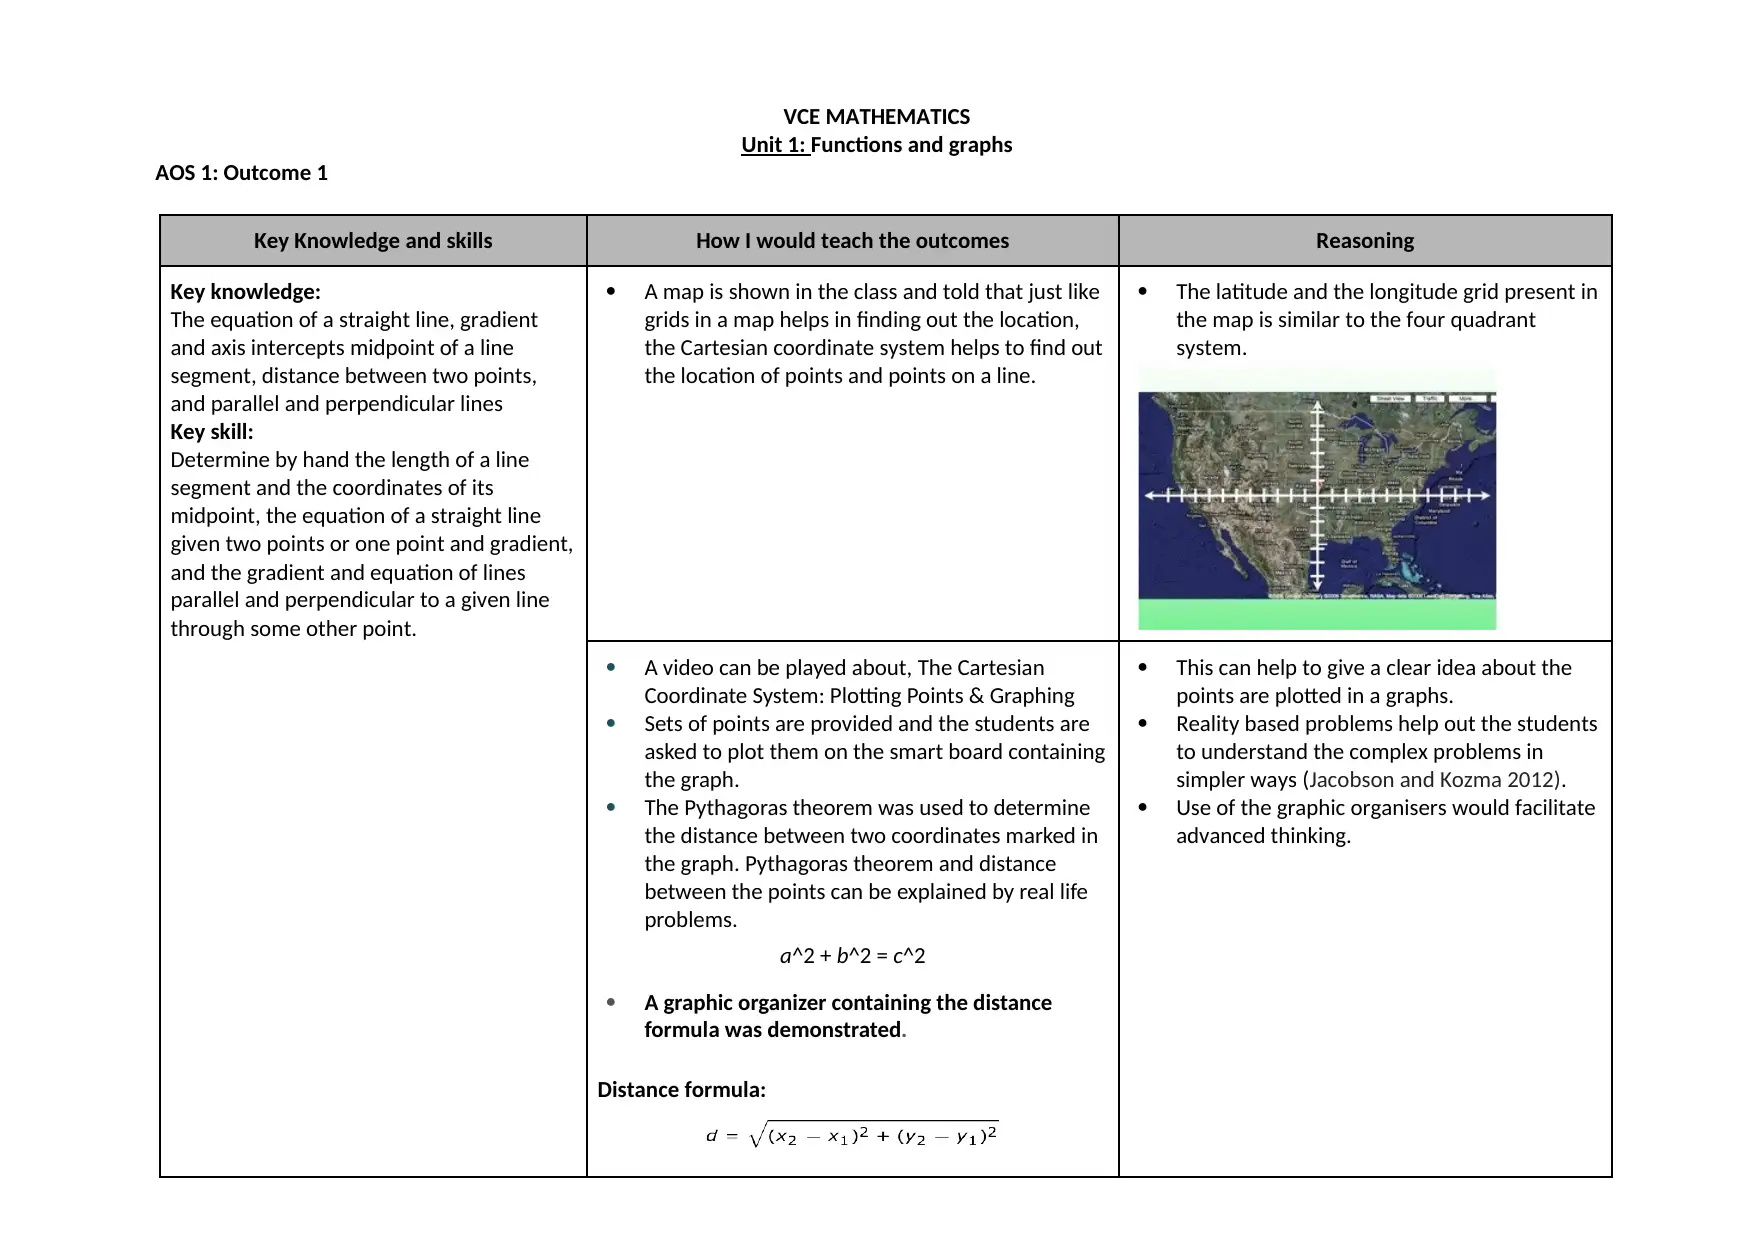
This report details teaching methodologies for VCE Mathematics Unit 1, focusing on functions and graphs, in accordance with VCAA curriculum documents. It covers key knowledge areas such as straight lines, circles, power functions, and polynomial functions. The teaching approaches involve reasoning through real-world examples, visual aids like the Cartesian coordinate system, and the use of graphic organizers and dynamic mathematics software. The report emphasizes hands-on techniques, Socratic methods, and collaborative learning, including educational trips and gaming activities to enhance student understanding and engagement. References to academic literature support the pedagogical choices, highlighting the importance of visual and kinaesthetic learning.

VCE MATHEMATICS
Unit 1: Functions and graphs
AOS 1: Outcome 1
Key Knowledge and skills How I would teach the outcomes Reasoning
Key knowledge:
The equation of a straight line, gradient
and axis intercepts midpoint of a line
segment, distance between two points,
and parallel and perpendicular lines
Key skill:
Determine by hand the length of a line
segment and the coordinates of its
midpoint, the equation of a straight line
given two points or one point and gradient,
and the gradient and equation of lines
parallel and perpendicular to a given line
through some other point.
A map is shown in the class and told that just like
grids in a map helps in finding out the location,
the Cartesian coordinate system helps to find out
the location of points and points on a line.
The latitude and the longitude grid present in
the map is similar to the four quadrant
system.
A video can be played about, The Cartesian
Coordinate System: Plotting Points & Graphing
Sets of points are provided and the students are
asked to plot them on the smart board containing
the graph.
The Pythagoras theorem was used to determine
the distance between two coordinates marked in
the graph. Pythagoras theorem and distance
between the points can be explained by real life
problems.
a^2 + b^2 = c^2
A graphic organizer containing the distance
formula was demonstrated.
Distance formula:
This can help to give a clear idea about the
points are plotted in a graphs.
Reality based problems help out the students
to understand the complex problems in
simpler ways (Jacobson and Kozma 2012).
Use of the graphic organisers would facilitate
advanced thinking.
Paraphrase This Document
Need a fresh take? Get an instant paraphrase of this document with our AI Paraphraser

The midpoint is found out by writing the
coordinates and the formula on the board.
Key knowledge:
The equation of a circle with specified
radius and centre
Key knowledge:
the key features and properties of power
and polynomial functions and their graphs
After the completion of teaching of graphs
students are asked to plot three given sets of
points.
Using the distance between the two points as
a radius a circle is drawn.
The students will be asked to draw the circle
in a Cartesian coordinate system.
Problems on circles can be taught by using
some dynamic mathematics software.
Using Socratic Method to understand the
equations of the circle, this is mainly done by
a continuous session of question answer,
which ultimately generates a fruitful result.
Hand on techniques in geometry helps to
student to build a solid foundation in
maths for learning. This would help then
to understand the derivations of the
equation of the circles (Pegg and Davey
2012).
Use of Socratic methods motivates the
student and encourages them to respond
in class.
The class interaction supports
collaborative learning (HITS).
Audio visual aids will be used to teach the
power and the polynomial function.
Students will be given the opportunity to
form an equation.
Students will be encourages ton use the
graphics calculator in order to understand
the change of the graph if the powers of an
equation are increased.(logbook entry for the
graphic calculators)
The graphical calculator will be used to show
the new graphs when the highest power
increases by one.
Use of the software and the graphs can
improve the understanding of the
students about function and the ability to
create and interpret the graphical
representation of the functions
(Jacobson and Kozma 2012).
The class can be grouped in two parts- one
group working with the graph paper and the
other with the software, then they can be
compared.
This would create a competitive feeling
among the students and they will be
motivated to do the graph.

An educational tour to the Albert museum in
Victoria for witnessing “Science works”.
Games related to operations with the
polynomials can be conducted.
Class trips have educational values and
they help to add measurable depth in
their education (Fägerstam and Blom
2013).
Such Gaming activities at the end of the
class can add competitive fun and twist
work with the polynomials and supports
kinaesthetic and visual learning.
References
Fägerstam, E. and Blom, J., 2013. Learning biology and mathematics outdoors: effects and attitudes in a Swedish high school context. Journal of Adventure
Education & Outdoor Learning, 13(1), pp.56-75.
Jacobson, M.J. and Kozma, R.B. eds., 2012. Innovations in science and mathematics education: Advanced designs for technologies of learning. Routledge.
Pegg, J. and Davey, G., 2012. Interpreting student understanding in geometry: A synthesis of two models. In Designing learning environments for developing
understanding of geometry and space (pp. 123-150). Routledge.
Sommerauer, P. and Müller, O., 2014. Augmented reality in informal learning environments: A field experiment in a mathematics exhibition. Computers &
Education, 79, pp.59-68.
VCE Mathematics Study Design, Acreditation period 2016-2020. Retrieved from:
https://www.vcaa.vic.edu.au/Documents/vce/mathematics/MathematicsSD-2016.pdf
⊘ This is a preview!⊘
Do you want full access?
Subscribe today to unlock all pages.

Trusted by 1+ million students worldwide
1 out of 3
Your All-in-One AI-Powered Toolkit for Academic Success.
+13062052269
info@desklib.com
Available 24*7 on WhatsApp / Email
Unlock your academic potential
Copyright © 2020–2025 A2Z Services. All Rights Reserved. Developed and managed by ZUCOL.