Financial Ratio Analysis Report for Veep Marketing in 2017
VerifiedAdded on 2020/03/28
|7
|992
|125
Report
AI Summary
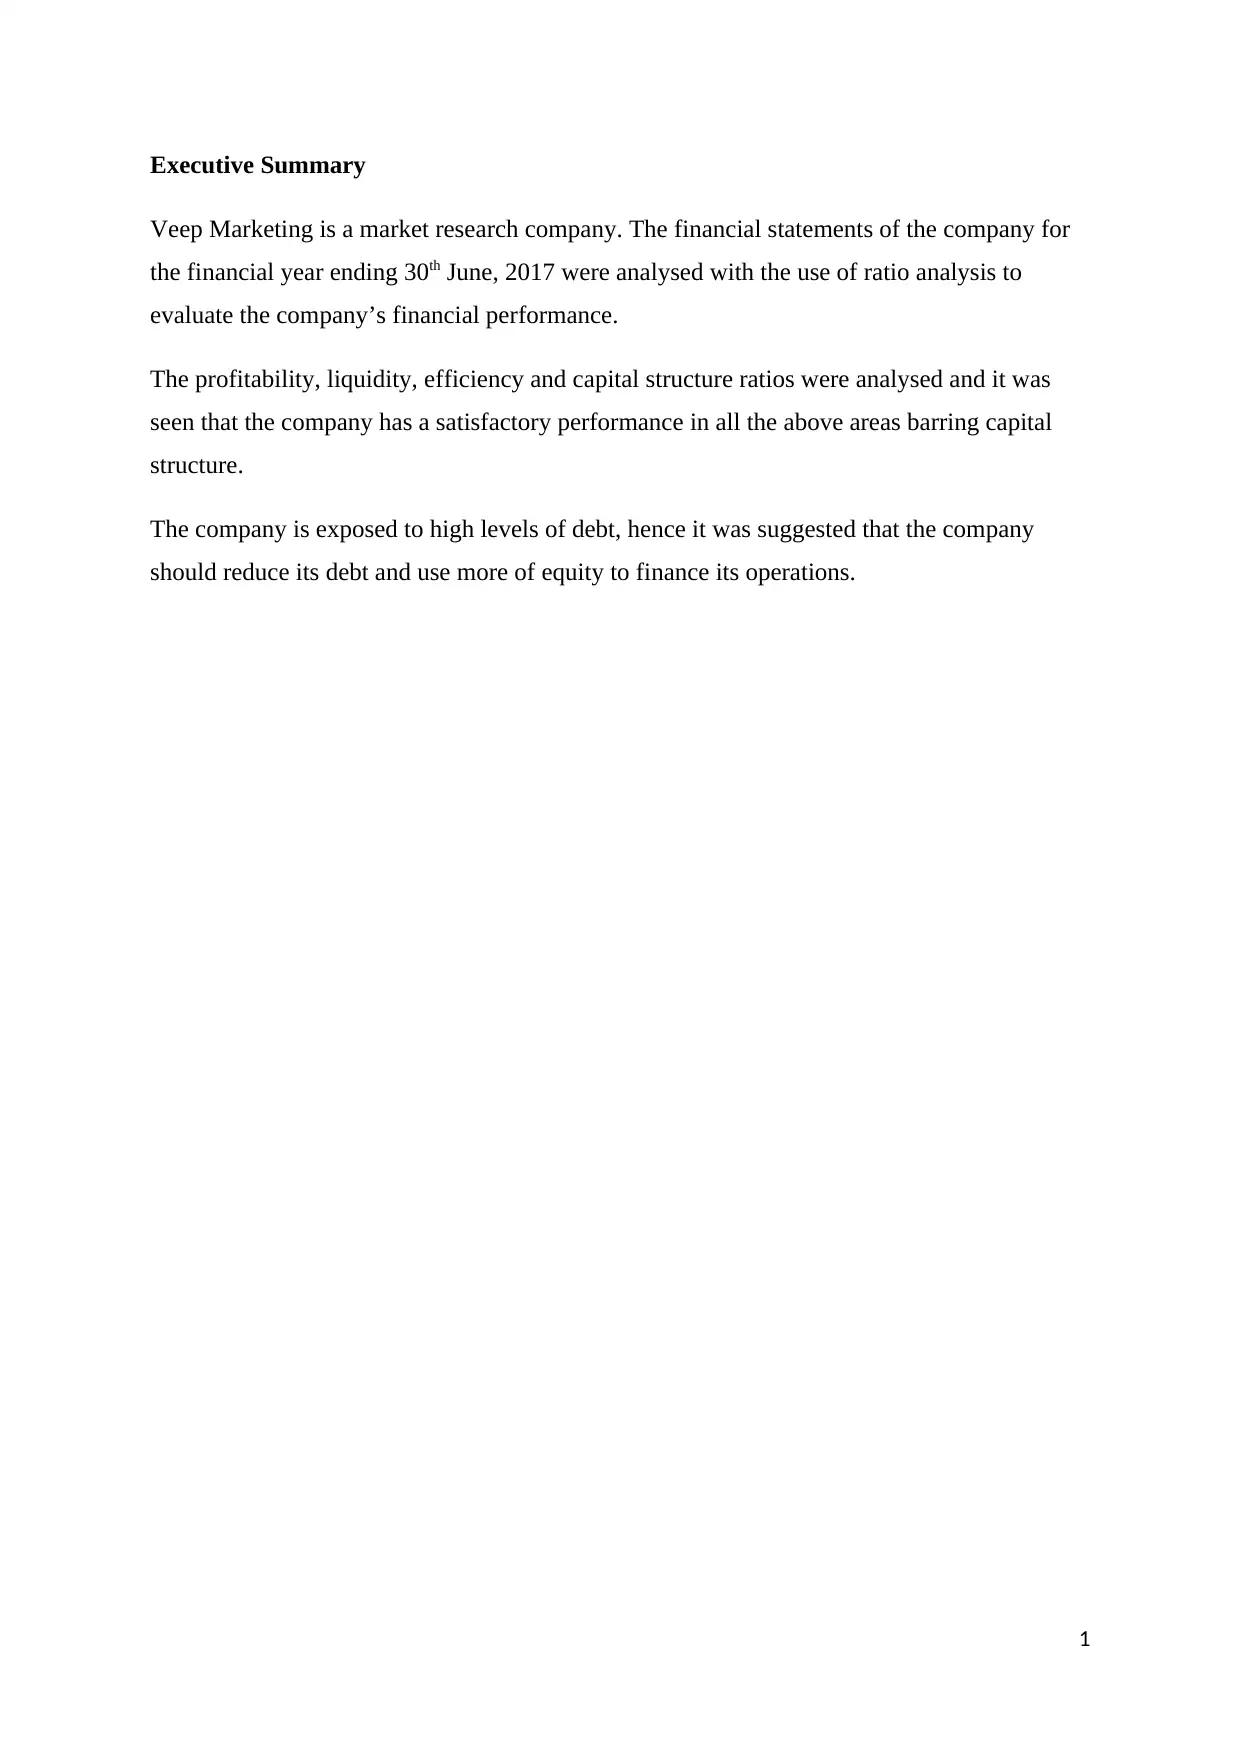
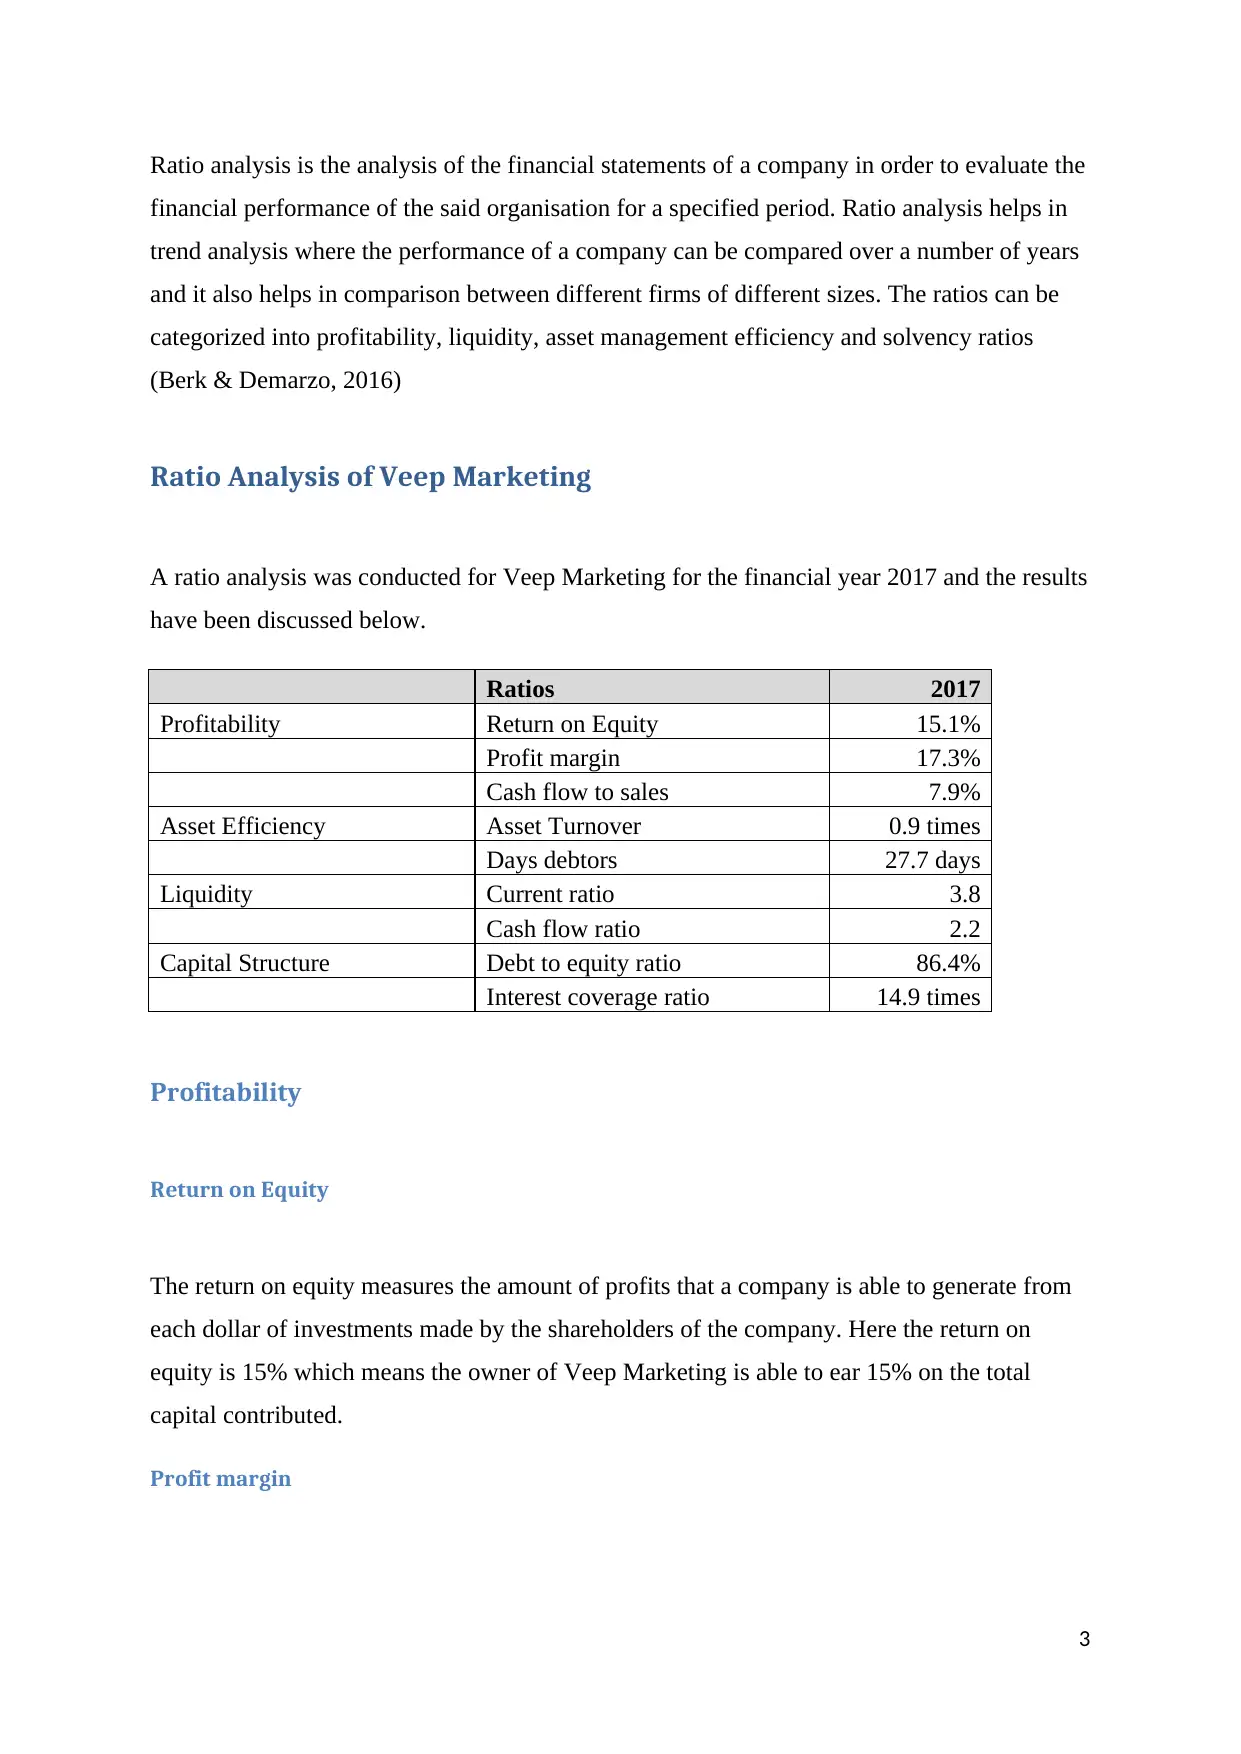
This report presents a comprehensive ratio analysis of Veep Marketing's financial performance for the year ending June 30, 2017. The analysis encompasses profitability ratios (Return on Equity, Profit Margin, Cash flow to Sales), asset efficiency ratios (Asset Turnover, Days Debtors), liquidity ratios (Cur...
Read More
Contribute Materials
Your contribution can guide someone’s learning journey. Share your
documents today.

Ratio Analysis
Veep Marketing
Veep Marketing
Secure Best Marks with AI Grader
Need help grading? Try our AI Grader for instant feedback on your assignments.

Executive Summary
Veep Marketing is a market research company. The financial statements of the company for
the financial year ending 30th June, 2017 were analysed with the use of ratio analysis to
evaluate the company’s financial performance.
The profitability, liquidity, efficiency and capital structure ratios were analysed and it was
seen that the company has a satisfactory performance in all the above areas barring capital
structure.
The company is exposed to high levels of debt, hence it was suggested that the company
should reduce its debt and use more of equity to finance its operations.
1

Contents
Introduction...........................................................................................................................................1
Ratio Analysis of Veep Marketing..........................................................................................................1
Profitability........................................................................................................................................2
Return on Equity............................................................................................................................2
Profit margin..................................................................................................................................2
Asset Efficiency..................................................................................................................................2
Asset turnover...............................................................................................................................2
Day’s debtor..................................................................................................................................2
Liquidity.............................................................................................................................................3
Current ratio..................................................................................................................................3
Cash flow ratio...............................................................................................................................3
Capital Structure................................................................................................................................3
Debt to Equity ratio.......................................................................................................................3
Interest coverage ratio..................................................................................................................3
Limitations.............................................................................................................................................4
Conclusion.............................................................................................................................................4
Bibliography...........................................................................................................................................4
Introduction
2

Ratio analysis is the analysis of the financial statements of a company in order to evaluate the
financial performance of the said organisation for a specified period. Ratio analysis helps in
trend analysis where the performance of a company can be compared over a number of years
and it also helps in comparison between different firms of different sizes. The ratios can be
categorized into profitability, liquidity, asset management efficiency and solvency ratios
(Berk & Demarzo, 2016)
Ratio Analysis of Veep Marketing
A ratio analysis was conducted for Veep Marketing for the financial year 2017 and the results
have been discussed below.
Ratios 2017
Profitability Return on Equity 15.1%
Profit margin 17.3%
Cash flow to sales 7.9%
Asset Efficiency Asset Turnover 0.9 times
Days debtors 27.7 days
Liquidity Current ratio 3.8
Cash flow ratio 2.2
Capital Structure Debt to equity ratio 86.4%
Interest coverage ratio 14.9 times
Profitability
Return on Equity
The return on equity measures the amount of profits that a company is able to generate from
each dollar of investments made by the shareholders of the company. Here the return on
equity is 15% which means the owner of Veep Marketing is able to ear 15% on the total
capital contributed.
Profit margin
3
Secure Best Marks with AI Grader
Need help grading? Try our AI Grader for instant feedback on your assignments.

The profit margin is expressed as net income as a percentage of sales. It is the margin left
after all expenses have been paid for. The company’s net profit margin is an impressive
17.3% which means the company is able to earn 17.3% of profits from sale revenue of
$40,010
Asset Efficiency
Asset turnover
This ratio is an indicator of how efficiently the company is using its assets to generate sales.
The ratio means amount of sales generated for every dollar invested in assets in the year. A
higher ratio is preferred as it means efficient asset management. Veep Marketing has an asset
turnover ratio of 0.9 which means the company generates only 0.9 dollars for every 1 dollar
invested.
Day’s debtor
This ratio measures the number of days it takes to convert accounts receivables into cash in
the year. The days debtors for Veep Marketing is almost 28 days which means it takes the
company 28 days to collect cash from its debtors.
Liquidity
Current ratio
This ratio measures the ability of the company to pay for its current obligations from the
current assets. Veep Marketing has a current ratio of 3.8 which means the company has 3.8
times more current assets than current liabilities and hence can easily pay for the current
liabilities from its current assets.
Cash flow ratio
This ratio indicates how well the current liabilities can be paid from the company’s available
cash balance. The company has a ratio of 2.2 which means the cash balance is 2.2 times of
4

the current liabilities of the company and the company can pay all of its current liabilities
from the available cash.
Capital Structure
Debt to Equity ratio
It is the ratio of debt to equity in the company’s capital structure. The ratio of the company is
86% which means of the total funds invested, 84% is comprised by debt and the rest by
equity. This shows the company is highly leveraged.
Interest coverage ratio
It is the ratio of profits available to pay for the interest expenses if the company. The ratio for
Veep Marketing is 15 times which means from the operating profit, the company can pay for
its expenses 15 times.
Limitations
The limitations relate to the limitations of the ratio analysis. The ratios have been calculated
on the basis of the data in the financial statements for the year 2017. Balance sheet has
historical data, hence any effect of inflation is not taken into consideration and hence ratios
may give distorted results. The qualitative factors like employees are not considered. Any
changes in the external environment which may impact the analysis is not considered
(Peavler, 2017)
Conclusion
From the above analysis, we see that the company has a satisfactory profitability, liquidity
and asset efficiency. The only area where the company seems to be at risk is the capital
structure. The company has more debt than equity. This makes it risky. The company should
look at reducing its debt and using more owners’ funds to finance its operations.
5

Bibliography
Berk, J., & Demarzo, P. (2016). Financial Management. Australia: Perason.
Peavler, R. (2017, February 28). Advantages and Disadvantages of Ratio Analysis for Business.
Retrieved September 14, 2017, from The Balance: https://www.thebalance.com/limitations-
of-financial-ratio-analysis-393236
6
Berk, J., & Demarzo, P. (2016). Financial Management. Australia: Perason.
Peavler, R. (2017, February 28). Advantages and Disadvantages of Ratio Analysis for Business.
Retrieved September 14, 2017, from The Balance: https://www.thebalance.com/limitations-
of-financial-ratio-analysis-393236
6
1 out of 7
Related Documents

Your All-in-One AI-Powered Toolkit for Academic Success.
+13062052269
info@desklib.com
Available 24*7 on WhatsApp / Email
Unlock your academic potential
© 2024 | Zucol Services PVT LTD | All rights reserved.