Analysis of Dynamic Effects on Vehicle Suspension Systems
VerifiedAdded on 2020/05/04
|15
|2210
|35
Report
AI Summary
This report presents an analysis of vehicle suspension systems, focusing on the dynamic effects experienced by passengers. The study utilizes data collected from the Yankee flat road, employing piezoelectric sensors to measure acceleration and other performance parameters. The methodology includes data analysis through tables, graphs, and Matlab calculations to determine values such as the period, root mean square amplitude, and weighted RMS. The report further explores the determination of maximum transient vibration, maximum allowable driving time, and potential modifications to the car suspension components. The findings reveal insights into lateral acceleration, passenger comfort, and the impact of road conditions on vehicle performance. The report also includes calculations and formulas used in the analysis, along with conclusions and references to support the findings.

1
Running head: SUSPENSION SYSTEM
Dynamic effect on vehicle passengers
Running head: SUSPENSION SYSTEM
Dynamic effect on vehicle passengers
Paraphrase This Document
Need a fresh take? Get an instant paraphrase of this document with our AI Paraphraser
2
Running head: SUSPENSION SYSTEM
Contents
Introduction.................................................................................................................................................3
Procedure and Measurement method...........................................................................................................4
Information of survey data.......................................................................................................................5
The measuring devices for the acceleration and survey of data will be located along the highway far
from residential houses, in order to reduce noise...................................................................................5
RESULTS ANALYSIS AND DISCUSSION..........................................................................................................6
Numerical manipulation of data from the graphical representation.............................................................8
Calculation of period...............................................................................................................................8
Root Mean Square Amplitude (RMS).....................................................................................................9
Lower pass filter......................................................................................................................................9
Determination of weighted R.M.S.........................................................................................................10
Maximum transient vibration.................................................................................................................10
Maximum allowable driving time..........................................................................................................11
Improvement of modification of car suspension component................................................................12
CONCLUSIONS...........................................................................................................................................13
References.................................................................................................................................................14

3
Running head: SUSPENSION SYSTEM
Introduction
The survey carried out by highway engineering on the lateral acceleration of vehicles and the
determination on change rules aligned with their distribution and their influence factors will need
intensive work, the importance of studying the lateral acceleration of a moving vehicle is it is
very possible to convert the acceleration into lateral force coefficient of a highway, that is the
pivotal factor for lateral stability and safe driving, another importance also through a comparison
with permissible value of acceleration that will ensure human being comfort and caretake on the
health hazards through evaluating the rationality of highways super elevation, this will
possibility help to determine ranges of super elevation ratios , the third importance is that lateral
acceleration is directly proportion to stability of a vehicle, that involves the driving character in a
curve, for example the identification of trajectory and velocity are greatly affected by the
magnitude of the lateral force acting on the driver , Fourthly, being a pivotal measurement of
lateral comfort, the lateral acceleration will have a vast relation with horizontal alignment of a
highway, and the model that bounds the two, that is lateral acceleration and the alignment of a
highway has possibility of being used to predict the lateral comfort of a route scheme in the
design stage, this is of great aid to improve the geometric design for better performance.
Recently, lateral acceleration has been studied from several viewpoints entirely on the world., for
example is on the lateral accelerations of a passenger car on an interchange ramp, a ring road of a
city expressway, and a rugged mountain.
⊘ This is a preview!⊘
Do you want full access?
Subscribe today to unlock all pages.
Trusted by 1+ million students worldwide
4
Running head: SUSPENSION SYSTEM
Procedure and Measurement method
The performance data of the passenger cars were measured using an MTi micro- inertial attitude
heading reference system1. Nine types of data were collected; which included, pitch angular, 3 -
axis acceleration, pitch angular velocity, yaw, roll angle, and roll angle velocity.
In whole study, the lateral acceleration is analyzed. The piezoelectric (PE) sensors was installed
on the floor of the vehicle, and about 24 hours was spent in calibrating and commissioning the
instruments in order to reduce the error.
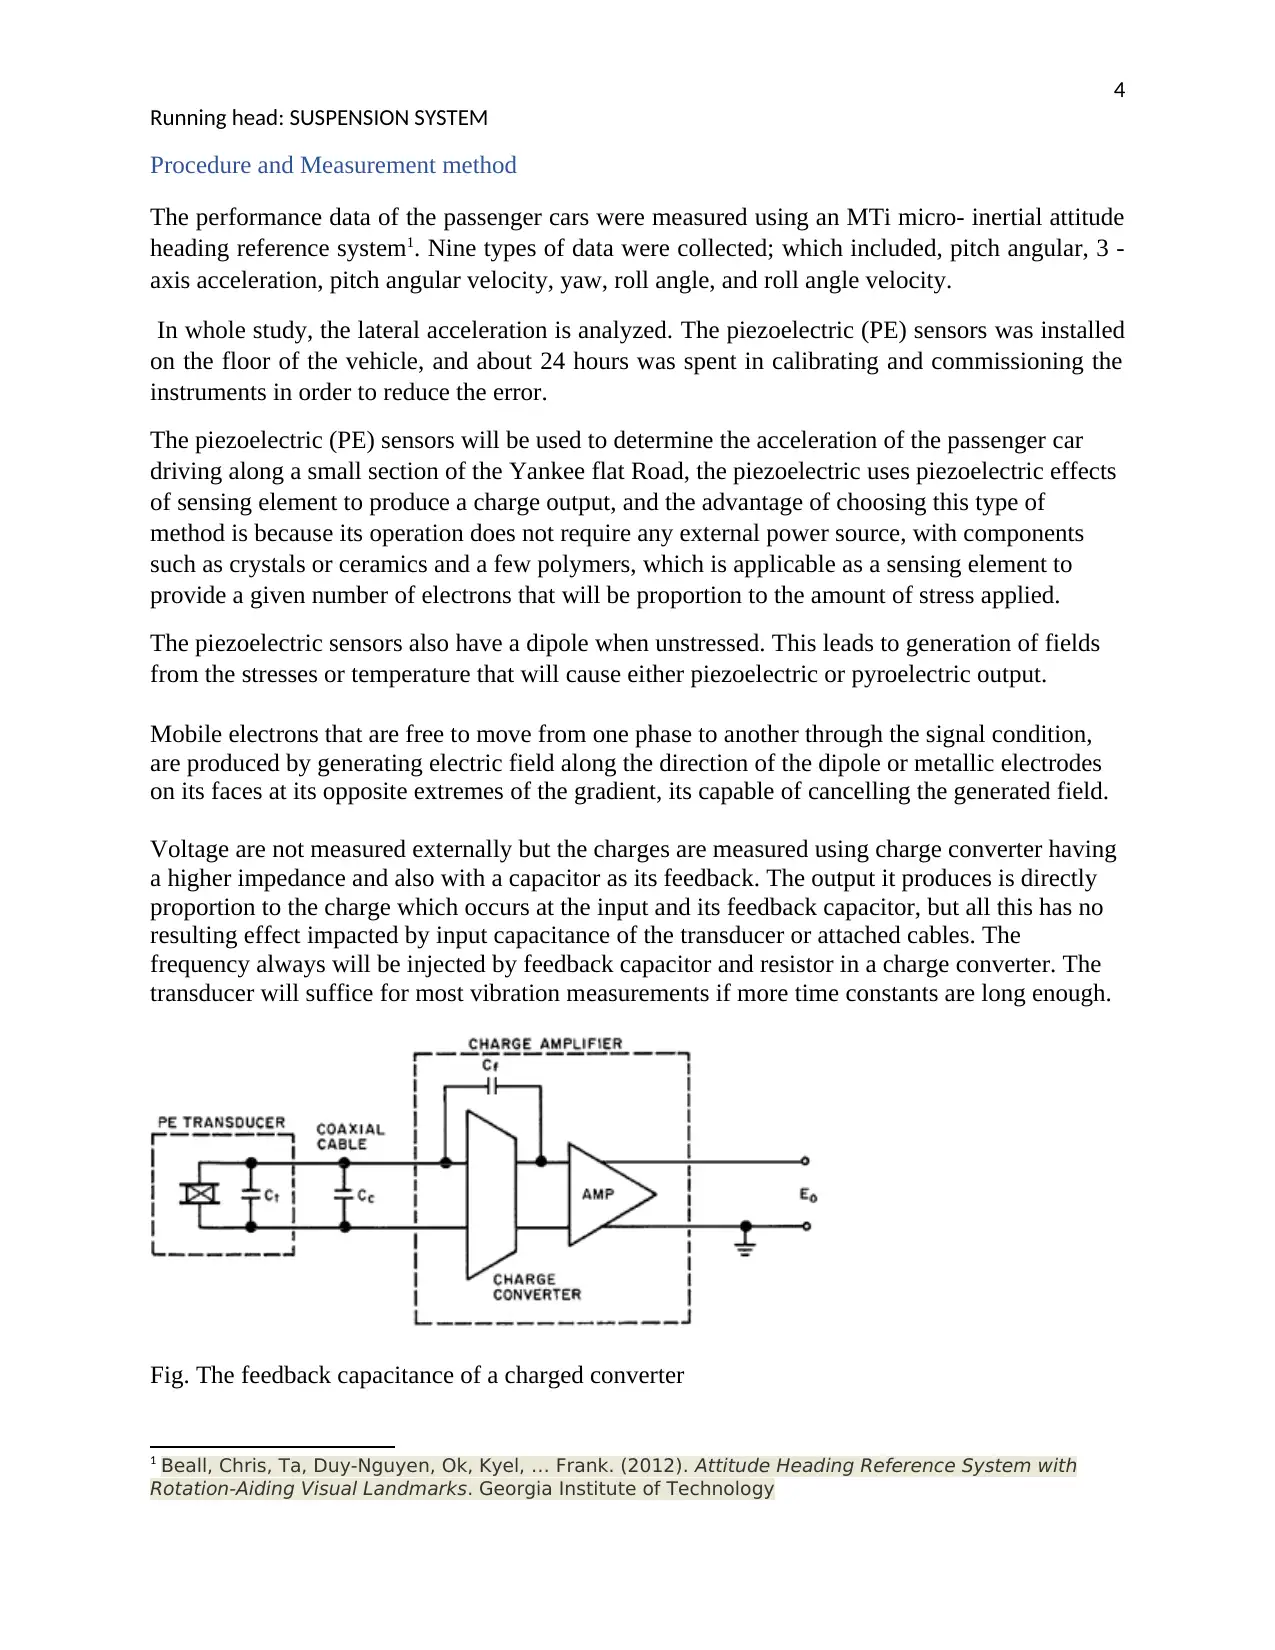
The piezoelectric (PE) sensors will be used to determine the acceleration of the passenger car
driving along a small section of the Yankee flat Road, the piezoelectric uses piezoelectric effects
of sensing element to produce a charge output, and the advantage of choosing this type of
method is because its operation does not require any external power source, with components
such as crystals or ceramics and a few polymers, which is applicable as a sensing element to
provide a given number of electrons that will be proportion to the amount of stress applied.
The piezoelectric sensors also have a dipole when unstressed. This leads to generation of fields
from the stresses or temperature that will cause either piezoelectric or pyroelectric output.
Mobile electrons that are free to move from one phase to another through the signal condition,
are produced by generating electric field along the direction of the dipole or metallic electrodes
on its faces at its opposite extremes of the gradient, its capable of cancelling the generated field.
Voltage are not measured externally but the charges are measured using charge converter having
a higher impedance and also with a capacitor as its feedback. The output it produces is directly
proportion to the charge which occurs at the input and its feedback capacitor, but all this has no
resulting effect impacted by input capacitance of the transducer or attached cables. The
frequency always will be injected by feedback capacitor and resistor in a charge converter. The
transducer will suffice for most vibration measurements if more time constants are long enough.
Fig. The feedback capacitance of a charged converter
1 Beall, Chris, Ta, Duy-Nguyen, Ok, Kyel, … Frank. (2012). Attitude Heading Reference System with
Rotation-Aiding Visual Landmarks. Georgia Institute of Technology
Running head: SUSPENSION SYSTEM
Procedure and Measurement method
The performance data of the passenger cars were measured using an MTi micro- inertial attitude
heading reference system1. Nine types of data were collected; which included, pitch angular, 3 -
axis acceleration, pitch angular velocity, yaw, roll angle, and roll angle velocity.
In whole study, the lateral acceleration is analyzed. The piezoelectric (PE) sensors was installed
on the floor of the vehicle, and about 24 hours was spent in calibrating and commissioning the
instruments in order to reduce the error.
The piezoelectric (PE) sensors will be used to determine the acceleration of the passenger car
driving along a small section of the Yankee flat Road, the piezoelectric uses piezoelectric effects
of sensing element to produce a charge output, and the advantage of choosing this type of
method is because its operation does not require any external power source, with components
such as crystals or ceramics and a few polymers, which is applicable as a sensing element to
provide a given number of electrons that will be proportion to the amount of stress applied.
The piezoelectric sensors also have a dipole when unstressed. This leads to generation of fields
from the stresses or temperature that will cause either piezoelectric or pyroelectric output.
Mobile electrons that are free to move from one phase to another through the signal condition,
are produced by generating electric field along the direction of the dipole or metallic electrodes
on its faces at its opposite extremes of the gradient, its capable of cancelling the generated field.
Voltage are not measured externally but the charges are measured using charge converter having
a higher impedance and also with a capacitor as its feedback. The output it produces is directly
proportion to the charge which occurs at the input and its feedback capacitor, but all this has no
resulting effect impacted by input capacitance of the transducer or attached cables. The
frequency always will be injected by feedback capacitor and resistor in a charge converter. The
transducer will suffice for most vibration measurements if more time constants are long enough.
Fig. The feedback capacitance of a charged converter
1 Beall, Chris, Ta, Duy-Nguyen, Ok, Kyel, … Frank. (2012). Attitude Heading Reference System with
Rotation-Aiding Visual Landmarks. Georgia Institute of Technology
Paraphrase This Document
Need a fresh take? Get an instant paraphrase of this document with our AI Paraphraser

5
Running head: SUSPENSION SYSTEM
Information of survey data
The measuring devices for the acceleration and survey of data will be located along the highway far
from residential houses, in order to reduce noise.
Running head: SUSPENSION SYSTEM
Information of survey data
The measuring devices for the acceleration and survey of data will be located along the highway far
from residential houses, in order to reduce noise.
6
Running head: SUSPENSION SYSTEM
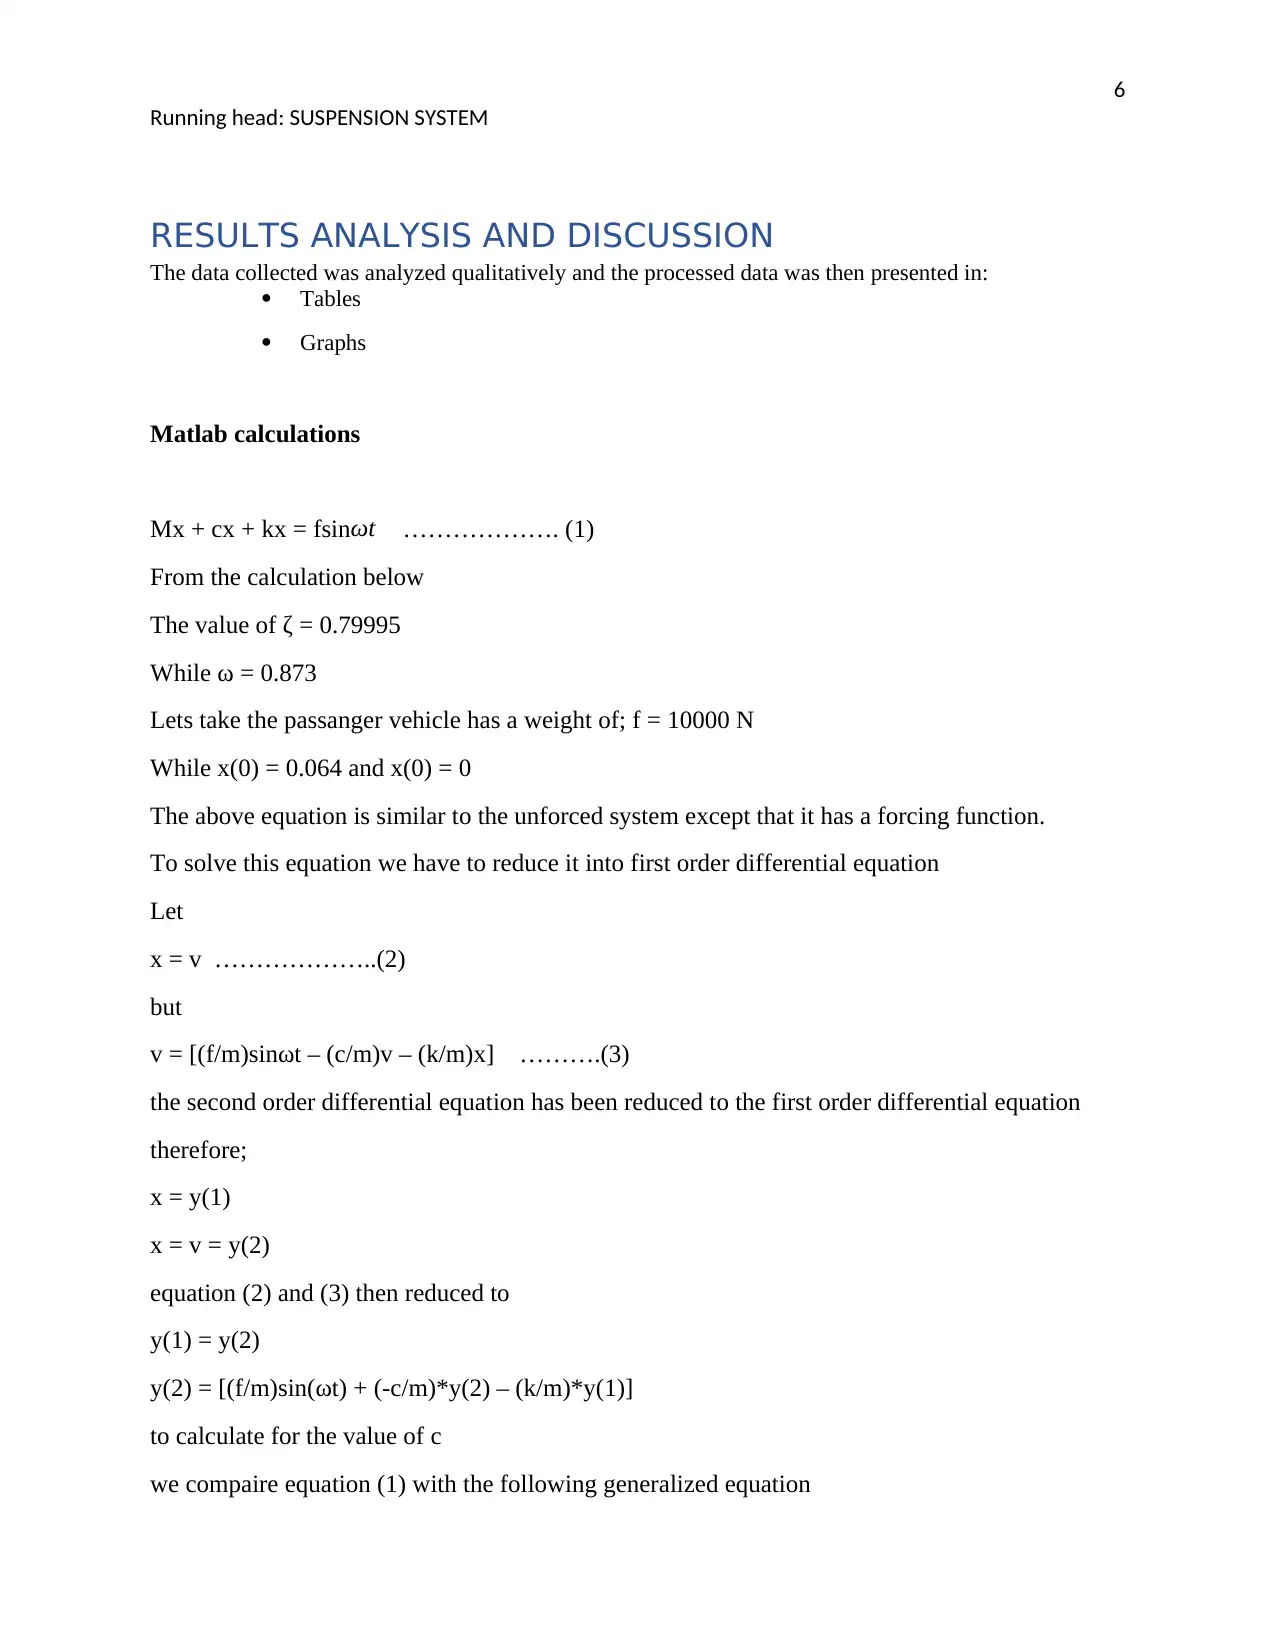
RESULTS ANALYSIS AND DISCUSSION
The data collected was analyzed qualitatively and the processed data was then presented in:
Tables
Graphs
Matlab calculations
Mx + cx + kx = fsinωt ………………. (1)
From the calculation below
The value of ζ = 0.79995
While ω = 0.873
Lets take the passanger vehicle has a weight of; f = 10000 N
While x(0) = 0.064 and x(0) = 0
The above equation is similar to the unforced system except that it has a forcing function.
To solve this equation we have to reduce it into first order differential equation
Let
x = v ………………..(2)
but
v = [(f/m)sinωt – (c/m)v – (k/m)x] ……….(3)
the second order differential equation has been reduced to the first order differential equation
therefore;
x = y(1)
x = v = y(2)
equation (2) and (3) then reduced to
y(1) = y(2)
y(2) = [(f/m)sin(ωt) + (-c/m)*y(2) – (k/m)*y(1)]
to calculate for the value of c
we compaire equation (1) with the following generalized equation
Running head: SUSPENSION SYSTEM
RESULTS ANALYSIS AND DISCUSSION
The data collected was analyzed qualitatively and the processed data was then presented in:
Tables
Graphs
Matlab calculations
Mx + cx + kx = fsinωt ………………. (1)
From the calculation below
The value of ζ = 0.79995
While ω = 0.873
Lets take the passanger vehicle has a weight of; f = 10000 N
While x(0) = 0.064 and x(0) = 0
The above equation is similar to the unforced system except that it has a forcing function.
To solve this equation we have to reduce it into first order differential equation
Let
x = v ………………..(2)
but
v = [(f/m)sinωt – (c/m)v – (k/m)x] ……….(3)
the second order differential equation has been reduced to the first order differential equation
therefore;
x = y(1)
x = v = y(2)
equation (2) and (3) then reduced to
y(1) = y(2)
y(2) = [(f/m)sin(ωt) + (-c/m)*y(2) – (k/m)*y(1)]
to calculate for the value of c
we compaire equation (1) with the following generalized equation
⊘ This is a preview!⊘
Do you want full access?
Subscribe today to unlock all pages.
Trusted by 1+ million students worldwide

7
Running head: SUSPENSION SYSTEM
x + 2ζωn + ωn2 = fsinωt
equating the coefficient
c/m = 2ζωn
ωn2 = k/m
from the calculation below
ωd = 0.873 rad/sec
ωn = 0.874 rad/sec
ζ = 0.03328
damped time period Td = 2π/ωd = 7.2 sec
for 6 time cycle the interval should be 43.2 sec, since the plot should indicate both the transient
and steady state responses, the time interval will be increased
function yp = forced(t,y)
yp = (y(2);(((f/m)*sin(ωn*t))-((c/m*y(2))-(k/m)*y(1))));
The following code represent the main code
span = (0 5);
y0=(0.064;0);
(t,y)=ode45(forced,tspan,y0);
Plot(t,y(:,1));
grid on
xlabel(time)
ylabel(Displacement)
title(Displacement vs time)
hold on
tspan represent the time interval and y0 represent the initial condition for y(1) and y(2), which in
turn represent the displacement x and the first derivative f x
Paraphrase This Document
Need a fresh take? Get an instant paraphrase of this document with our AI Paraphraser
8
Running head: SUSPENSION SYSTEM
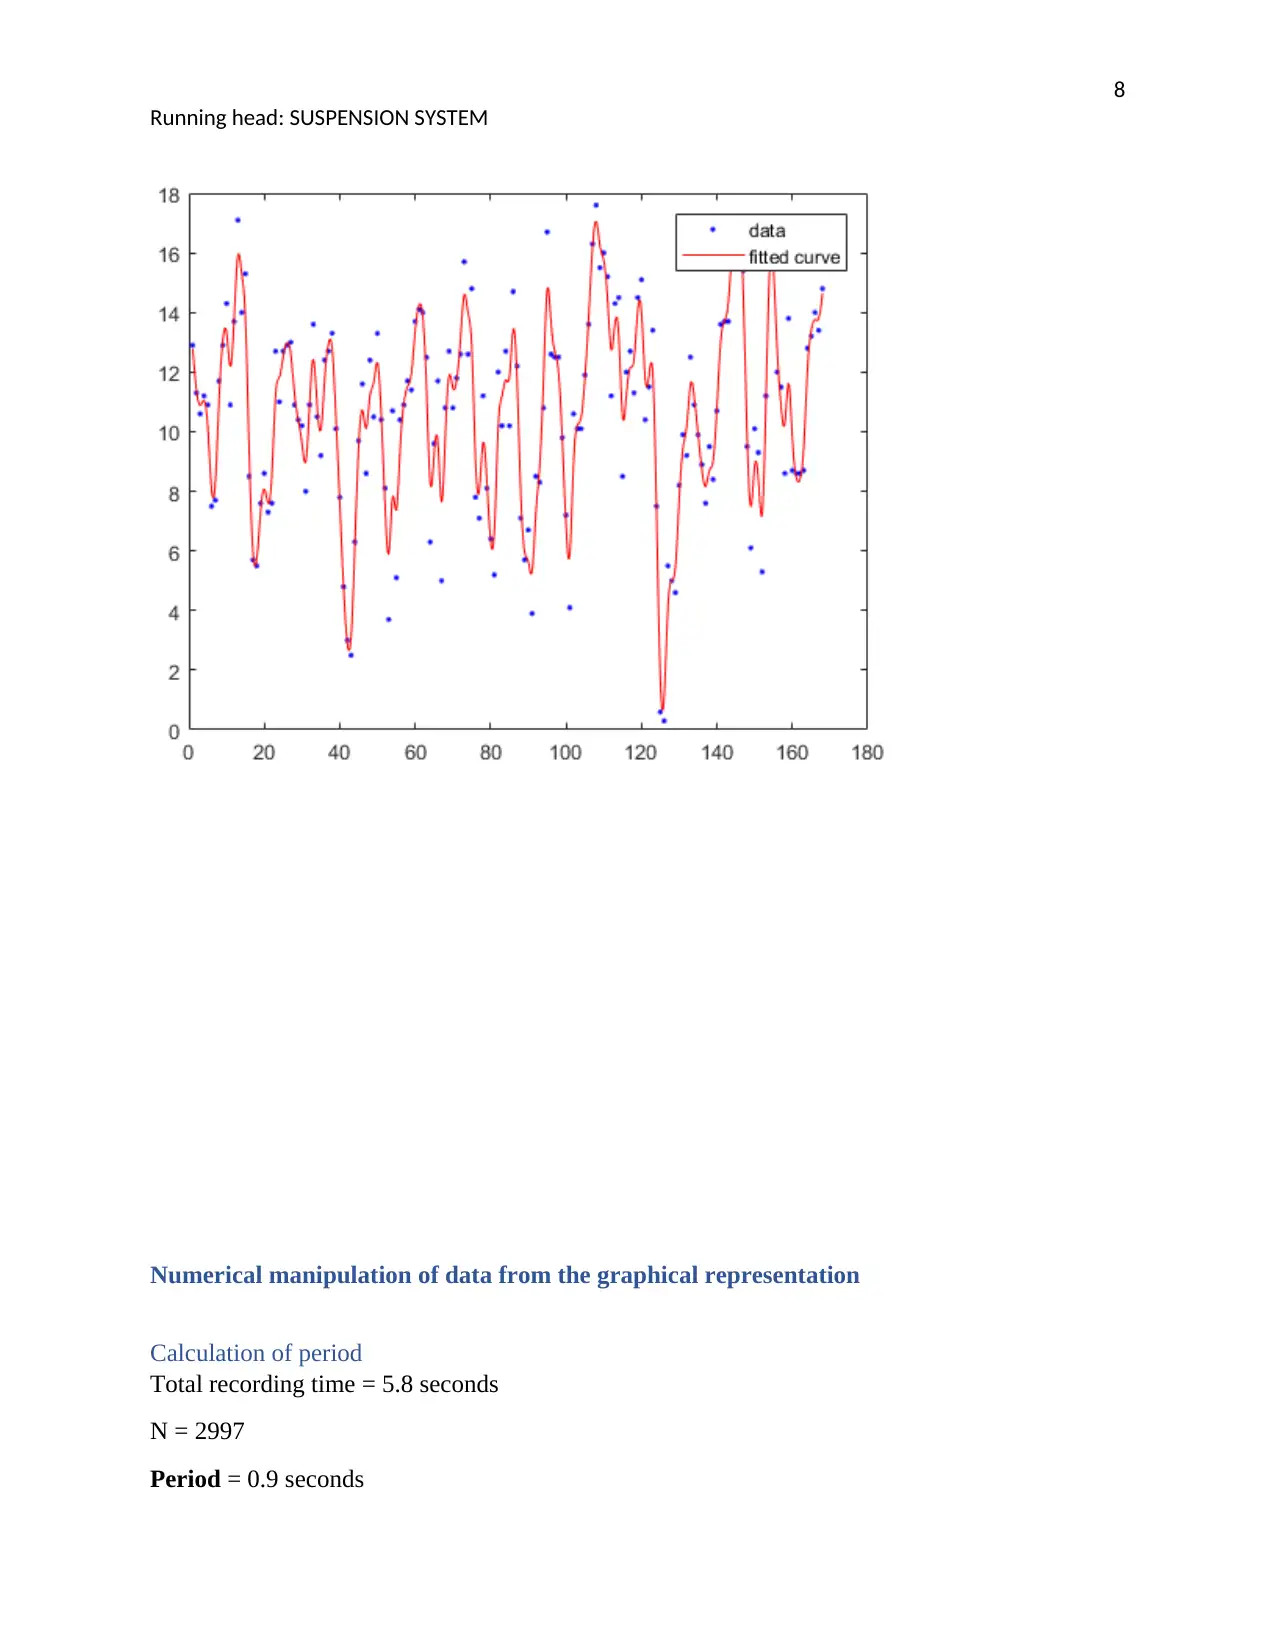
Numerical manipulation of data from the graphical representation
Calculation of period
Total recording time = 5.8 seconds
N = 2997
Period = 0.9 seconds
Running head: SUSPENSION SYSTEM
Numerical manipulation of data from the graphical representation
Calculation of period
Total recording time = 5.8 seconds
N = 2997
Period = 0.9 seconds
9
Running head: SUSPENSION SYSTEM
Frequency = 1
T = 1
0.9
= 1.111 Hz
Calculation of maximum peak = 0.64 m
Root Mean Square Amplitude (RMS) = 0.707 times the peak value
= 0.707*0.64
= 0.045248 m
A0 = 2
N ∑
n=1
N
X ncos ¿ 2 π
N
=
2
6 [0.064∗cos 2 π
6 + 0.052∗cos 2 π∗2
6 + 0.042∗cos 2 π∗3
6 +0.034∗cos 2 π∗4
6 +0.028∗cos 2 π∗5
6 +0.022∗cos 2 π∗6
6
= -0.0023333
B0 = 2
N ∑
n=1
N
X ncos ¿ 2 π
N
=
2
6 [0.064∗sin 2 π
6 +0.052∗sin 2 π∗2
6 +0.042∗sin 2 π∗3
6 +0.034∗sin 2 π∗4
6 +0.028∗sin 2 π∗5
6 +0.022∗sin 2 π∗6
6 +
= 0.06409
Amplitude = √ −0.0023332 +0.064092
= 0.064128
Phase of harmonic = tan-1 0.06409
−0.0023333 = -87.920
Lower pass filter
close all;
clear all;
clc;
2st frequency(f2) = = 1
T = 1
0.9
= 1.111 Hz
Total frequency (f) = 6*f2
⊘ This is a preview!⊘
Do you want full access?
Subscribe today to unlock all pages.
Trusted by 1+ million students worldwide
10
Running head: SUSPENSION SYSTEM
= 6*1.111
= 6.667 Hz
|H1p| = √ f 24
f 4 + f 24
= √ 1.1114
6.6674 +1.1114
= 0.02776
Determination of weighted R.M.S2
close all;
clear all;
clc;
aw= [ 1
T ∫
0
T
a2w(t)dt]1/2
where; T = 5.8 seconds
total distance = 0.012 + 0.01 + 0.008 + 0.006 + 0.006 + 0.002 =
0.044 m
total velocity = distance
time = 0.044
5.8 =0.0075862 m
s
aw2 (t) = ¿2tdt
= 0.0000575505 t2
2 m2/s4
aw= [1/T ∫
0
T
0.00005755505 t2
2 dt]1/2
= [1/5.8 ∫
0
5.8
0.0000575505 t2
2 dt]1/2
=1/5.6 ∫
0
5.8
0.0000575505 t3
6
= sqrt(0.000322667)
2 Global Workshop on Digital Soil Mapping, Minasny, B., Malone, B. P., & McBratney, A. B.
(2012). Digital soil assessments and beyond: Proceedings of the 5th Global Workshop on Digital Soil
Mapping, Sydney, Australia, 10-13 April 2012. Leiden: CRC Press.
Paraphrase This Document
Need a fresh take? Get an instant paraphrase of this document with our AI Paraphraser
11
Running head: SUSPENSION SYSTEM
= 0.017963 rad/sec
Maximum transient vibration3
close all;
clear all;
clc;
aw(t0) = [ 1
τ ∫
t 0−τ
T
¿ ¿w(t)]2 dt]1/2
where; τ =1
t0 = 5.8 seconds
[aw(t)]2 = ¿dt]2
= 0.0000575505 t4
4 m2/s4
aw(t0) = [ 1
τ ∫
t 0−τ
T
0.00005755505 t4
4 dt]1/2
= [1/1 ∫
4.8
5.8
0.0000575505 t4
4 dt]1/2
= 1/1∫
4.8
5.8
0.0000575505 t5
30
= sqrt(0.0126-0.004888)
= 0.08782 rad/sec
end.
The use of the additional evaluation method has been comprehended as an importance of the
judgment of the effect of vibration on human being when the ratio of MTVV
aw =1.5is exceed, an
in this case;
MTVV
aw = 0.08782
0.017963 =4.89
4.89 > 1.5, hence additional evaluation method will be used
3 Lalanne, & Christian. (2010). Mechanical Vibration and Shock, Mechanical Shock. John Wiley & Sons
12
Running head: SUSPENSION SYSTEM
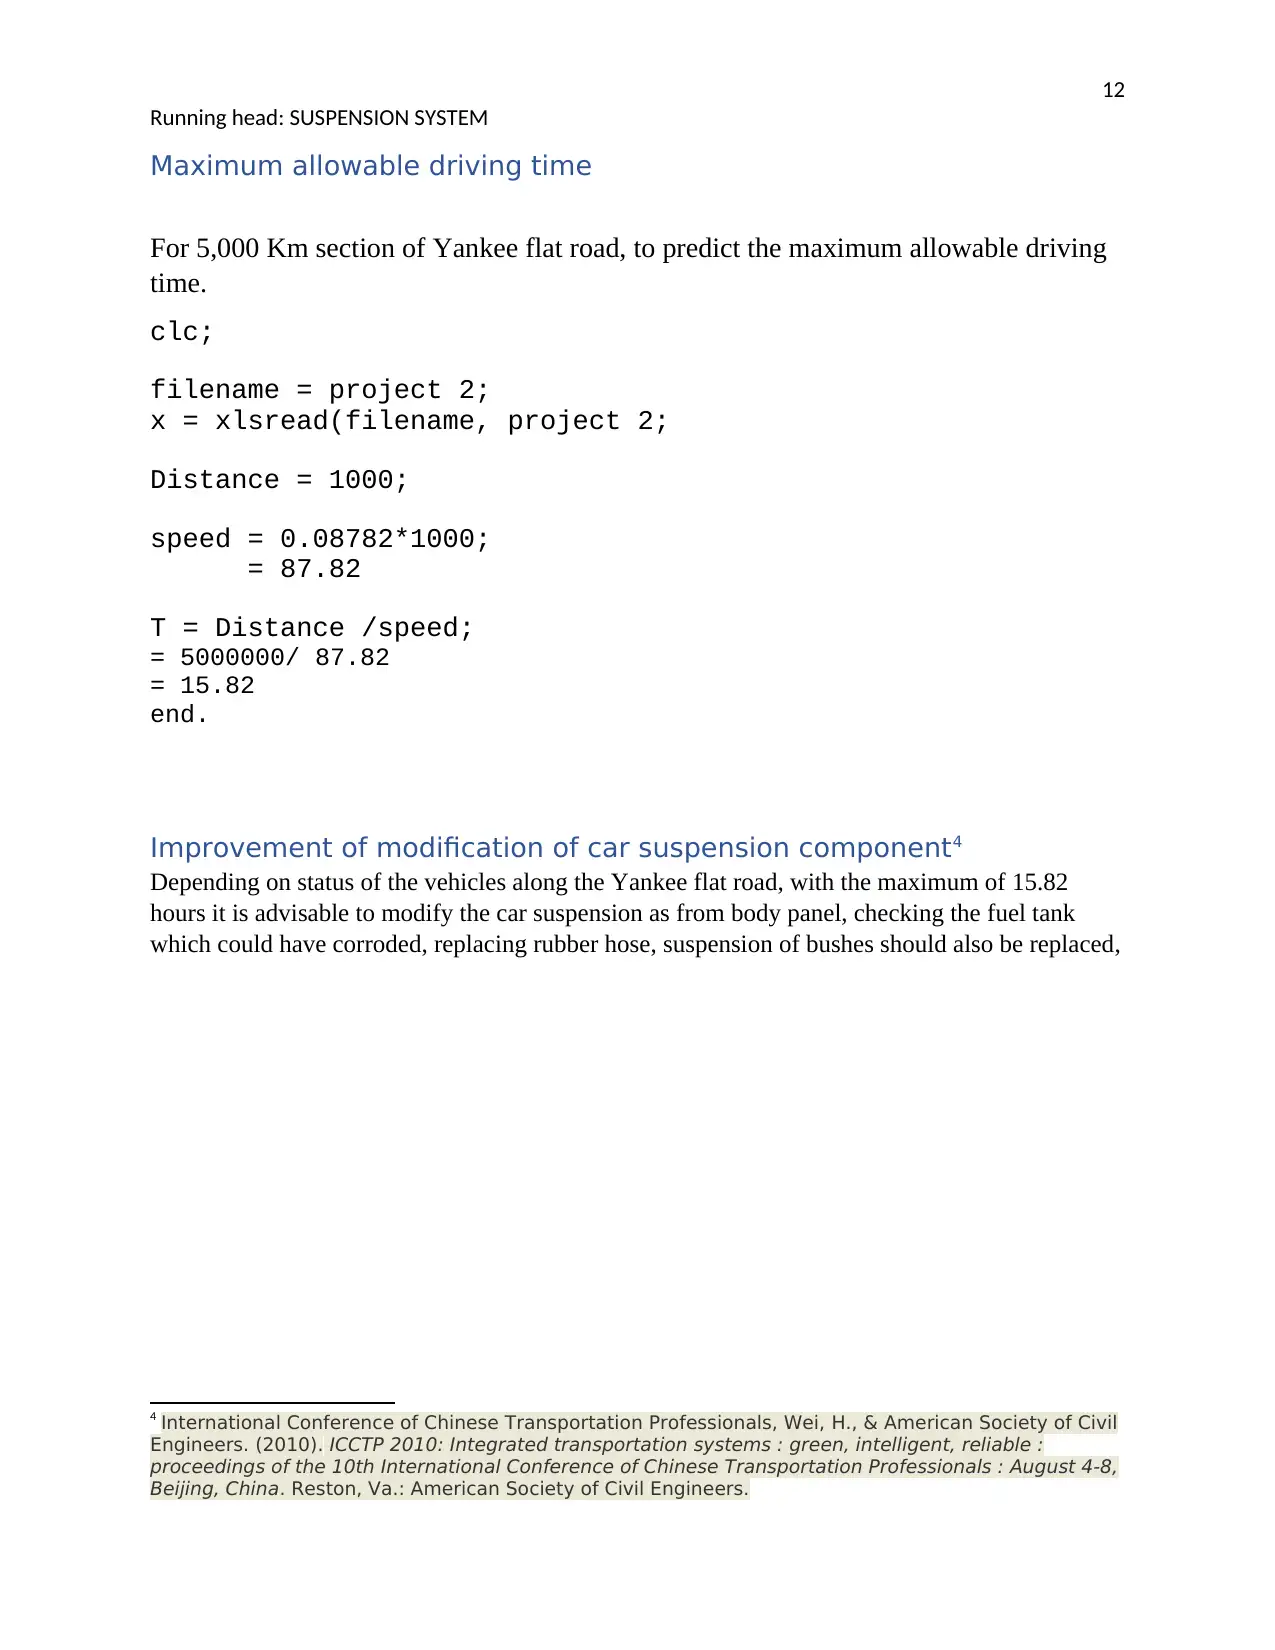
Maximum allowable driving time
For 5,000 Km section of Yankee flat road, to predict the maximum allowable driving
time.
clc;
filename = project 2;
x = xlsread(filename, project 2;
Distance = 1000;
speed = 0.08782*1000;
= 87.82
T = Distance /speed;
= 5000000/ 87.82
= 15.82
end.
Improvement of modification of car suspension component4
Depending on status of the vehicles along the Yankee flat road, with the maximum of 15.82
hours it is advisable to modify the car suspension as from body panel, checking the fuel tank
which could have corroded, replacing rubber hose, suspension of bushes should also be replaced,
4 International Conference of Chinese Transportation Professionals, Wei, H., & American Society of Civil
Engineers. (2010). ICCTP 2010: Integrated transportation systems : green, intelligent, reliable :
proceedings of the 10th International Conference of Chinese Transportation Professionals : August 4-8,
Beijing, China. Reston, Va.: American Society of Civil Engineers.
Running head: SUSPENSION SYSTEM
Maximum allowable driving time
For 5,000 Km section of Yankee flat road, to predict the maximum allowable driving
time.
clc;
filename = project 2;
x = xlsread(filename, project 2;
Distance = 1000;
speed = 0.08782*1000;
= 87.82
T = Distance /speed;
= 5000000/ 87.82
= 15.82
end.
Improvement of modification of car suspension component4
Depending on status of the vehicles along the Yankee flat road, with the maximum of 15.82
hours it is advisable to modify the car suspension as from body panel, checking the fuel tank
which could have corroded, replacing rubber hose, suspension of bushes should also be replaced,
4 International Conference of Chinese Transportation Professionals, Wei, H., & American Society of Civil
Engineers. (2010). ICCTP 2010: Integrated transportation systems : green, intelligent, reliable :
proceedings of the 10th International Conference of Chinese Transportation Professionals : August 4-8,
Beijing, China. Reston, Va.: American Society of Civil Engineers.
⊘ This is a preview!⊘
Do you want full access?
Subscribe today to unlock all pages.
Trusted by 1+ million students worldwide
1 out of 15

Your All-in-One AI-Powered Toolkit for Academic Success.
+13062052269
info@desklib.com
Available 24*7 on WhatsApp / Email
![[object Object]](/_next/static/media/star-bottom.7253800d.svg)
Unlock your academic potential
Copyright © 2020–2026 A2Z Services. All Rights Reserved. Developed and managed by ZUCOL.