Insurance Data Analysis: Logistic Regression for Vehicle Interest
VerifiedAdded on 2024/06/21
|19
|3724
|454
Report
AI Summary
This report details a data analysis task conducted by an insurance company aiming to predict customer interest in vehicle insurance using logistic regression on a dataset of over 380,000 customers. It discusses the logistic regression algorithm, its methodology, and types, while also comparing it to decision tree algorithms. Logistic regression is favored for its simplicity and ease of implementation, but it requires a linear relationship between data attributes, which is often unrealistic. The decision tree algorithm is presented as an alternative due to its independence from data linearity and its ability to visualize output logic, making it a valuable counterpart. The report covers essential aspects such as the sigmoid function, maximum likelihood estimation (MLE), and the advantages and disadvantages of both logistic regression and decision tree algorithms, concluding with insights into their applicability in predicting customer behavior in the insurance sector. Desklib provides access to this and many other solved assignments.

Paraphrase This Document
Need a fresh take? Get an instant paraphrase of this document with our AI Paraphraser
Abstract
A insurance company who want to know which customer will but their vehicle insurance in
future and who will not conduct a data analysis task on a huge dataset of more than 380 thousand
customers. Logistic regression is used by them to analyze the data set. This report discuss about
the logistic regression algorithm, its working methodology, type of logistic regression and its
counterpart decision tree. Logistic regression is good algorithm in terms of its easy to
implementation and simplicity but require a linear relationship between the attributes of data set
which is almost not possible in present world. Decision tree algorithm can be counterpart of this
algorithm because of it’s not tendency on data linearity. Decision tree is also best because tis
output can be visualize with the logic of splitting.
Table of Contents
Abstract............................................................................................................................................2
Introduction......................................................................................................................................5
Data set............................................................................................................................................5
Data set variables.........................................................................................................................6
Data Mining.....................................................................................................................................8
Logistic regression.......................................................................................................................8
Logistic regression property....................................................................................................9
Sigmoid Function.....................................................................................................................9
Types of Logistic Regression................................................................................................10
Linear regression vs logistic regression.................................................................................11
MLE vs OLS..........................................................................................................................11
Advantages of logistic regression..........................................................................................12
Dis-advantages of logistic regression....................................................................................12
Decision Tree Algorithm...........................................................................................................12
Decision Tree algorithm working..........................................................................................13
Recursive Binary Splitting.....................................................................................................14
Conclusion.....................................................................................................................................17
Reference.......................................................................................................................................18
⊘ This is a preview!⊘
Do you want full access?
Subscribe today to unlock all pages.
Trusted by 1+ million students worldwide

List of Figures
Figure 1 - Sigmoid Curve..............................................................................................................10
Figure 2 - Linear and Logistic Regression Curves........................................................................11
Figure 3 - Flowchart type of Decision Tree...................................................................................13
Figure 4 - Decision Tree working Methodology...........................................................................14
List of Table
Table 1 - Description of data set variables......................................................................................6
Paraphrase This Document
Need a fresh take? Get an instant paraphrase of this document with our AI Paraphraser
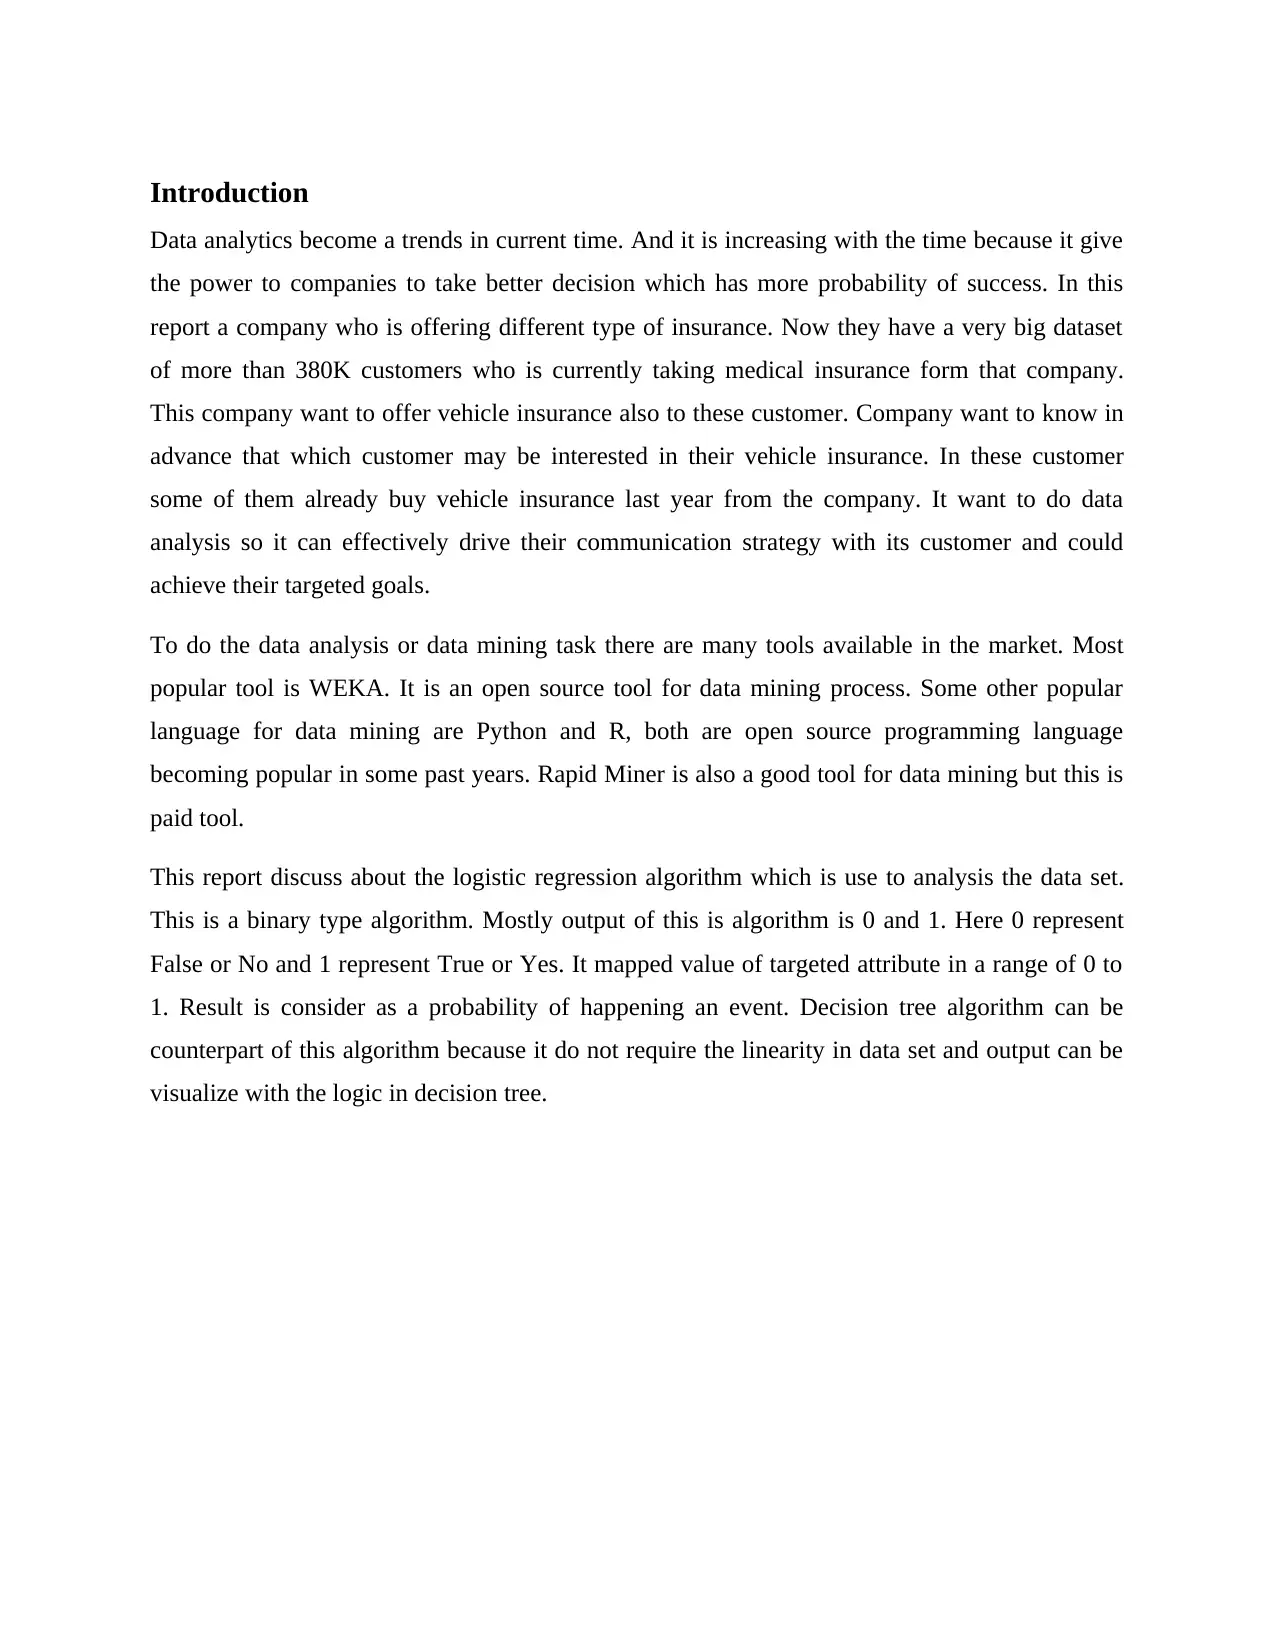
Introduction
Data analytics become a trends in current time. And it is increasing with the time because it give
the power to companies to take better decision which has more probability of success. In this
report a company who is offering different type of insurance. Now they have a very big dataset
of more than 380K customers who is currently taking medical insurance form that company.
This company want to offer vehicle insurance also to these customer. Company want to know in
advance that which customer may be interested in their vehicle insurance. In these customer
some of them already buy vehicle insurance last year from the company. It want to do data
analysis so it can effectively drive their communication strategy with its customer and could
achieve their targeted goals.
To do the data analysis or data mining task there are many tools available in the market. Most
popular tool is WEKA. It is an open source tool for data mining process. Some other popular
language for data mining are Python and R, both are open source programming language
becoming popular in some past years. Rapid Miner is also a good tool for data mining but this is
paid tool.
This report discuss about the logistic regression algorithm which is use to analysis the data set.
This is a binary type algorithm. Mostly output of this is algorithm is 0 and 1. Here 0 represent
False or No and 1 represent True or Yes. It mapped value of targeted attribute in a range of 0 to
1. Result is consider as a probability of happening an event. Decision tree algorithm can be
counterpart of this algorithm because it do not require the linearity in data set and output can be
visualize with the logic in decision tree.
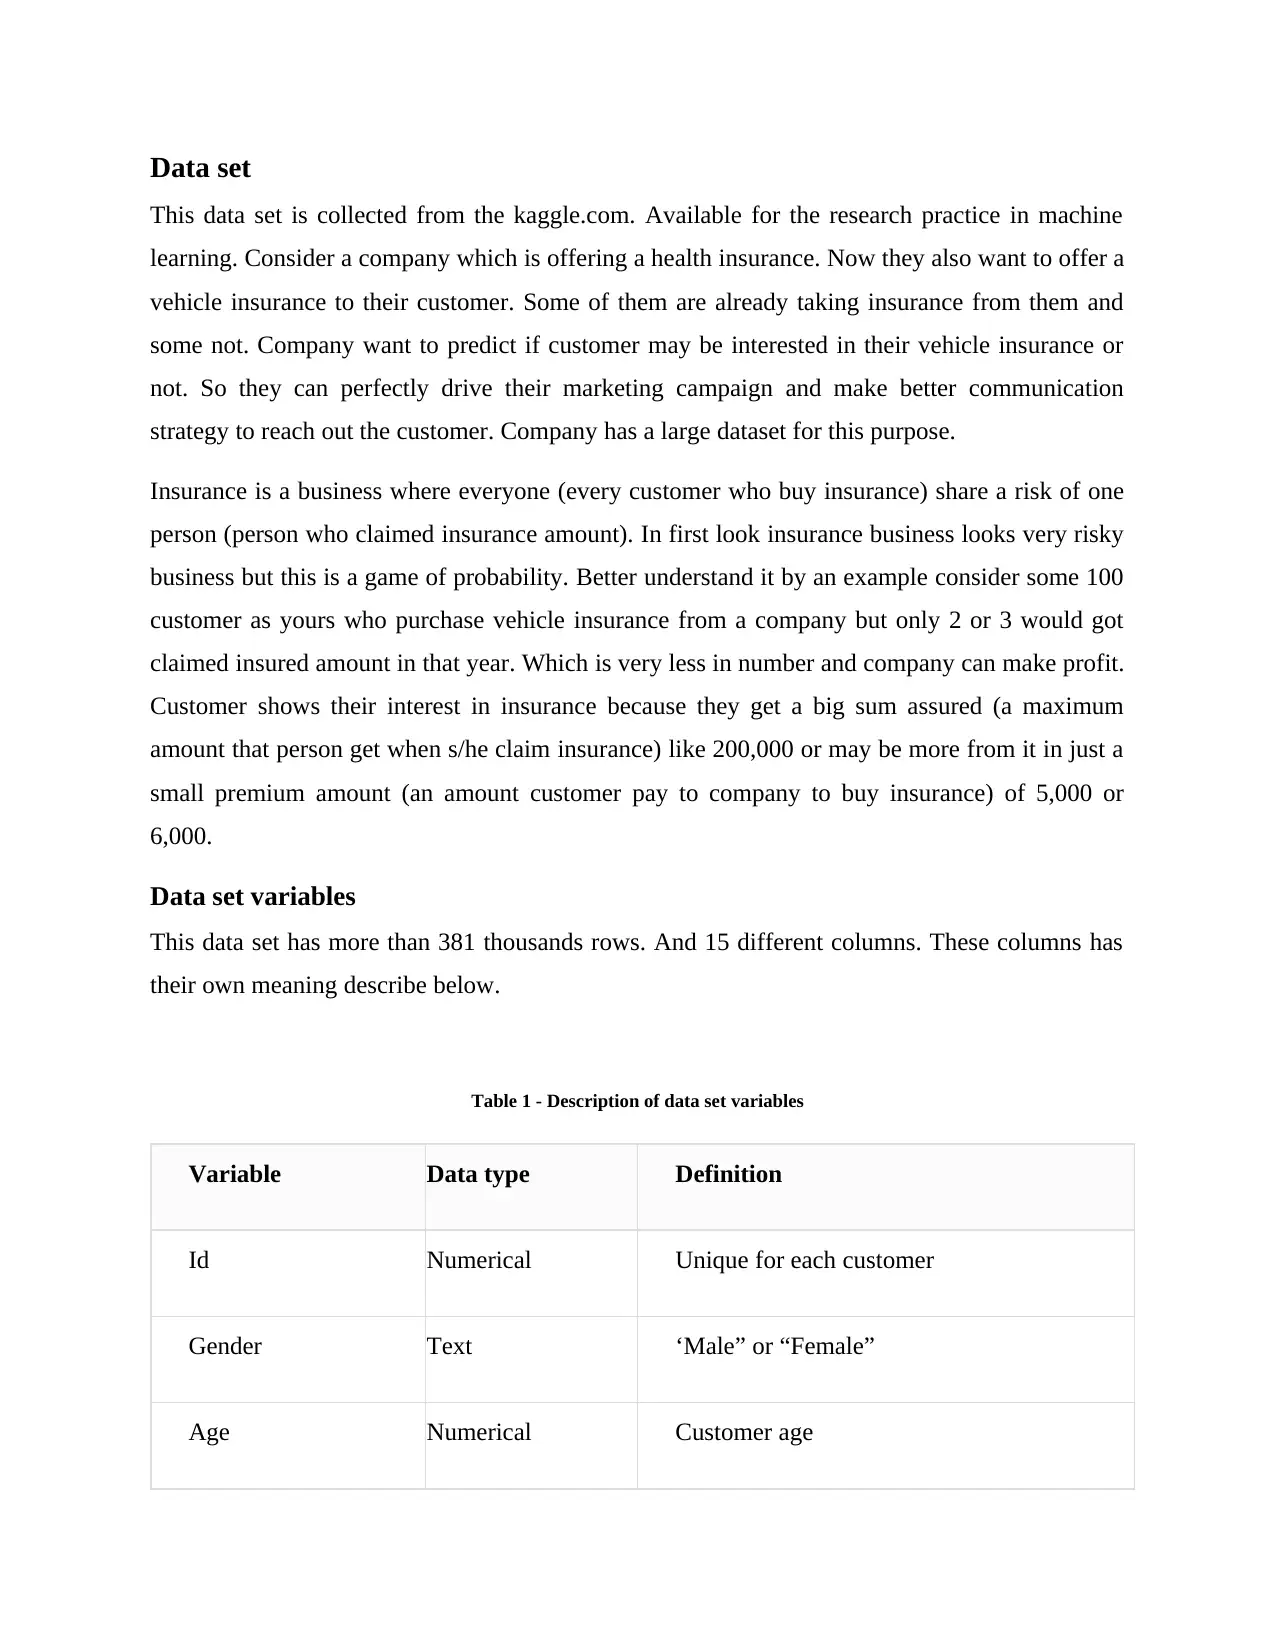
Data set
This data set is collected from the kaggle.com. Available for the research practice in machine
learning. Consider a company which is offering a health insurance. Now they also want to offer a
vehicle insurance to their customer. Some of them are already taking insurance from them and
some not. Company want to predict if customer may be interested in their vehicle insurance or
not. So they can perfectly drive their marketing campaign and make better communication
strategy to reach out the customer. Company has a large dataset for this purpose.
Insurance is a business where everyone (every customer who buy insurance) share a risk of one
person (person who claimed insurance amount). In first look insurance business looks very risky
business but this is a game of probability. Better understand it by an example consider some 100
customer as yours who purchase vehicle insurance from a company but only 2 or 3 would got
claimed insured amount in that year. Which is very less in number and company can make profit.
Customer shows their interest in insurance because they get a big sum assured (a maximum
amount that person get when s/he claim insurance) like 200,000 or may be more from it in just a
small premium amount (an amount customer pay to company to buy insurance) of 5,000 or
6,000.
Data set variables
This data set has more than 381 thousands rows. And 15 different columns. These columns has
their own meaning describe below.
Table 1 - Description of data set variables
Variable Data type Definition
Id Numerical Unique for each customer
Gender Text ‘Male” or “Female”
Age Numerical Customer age
⊘ This is a preview!⊘
Do you want full access?
Subscribe today to unlock all pages.
Trusted by 1+ million students worldwide
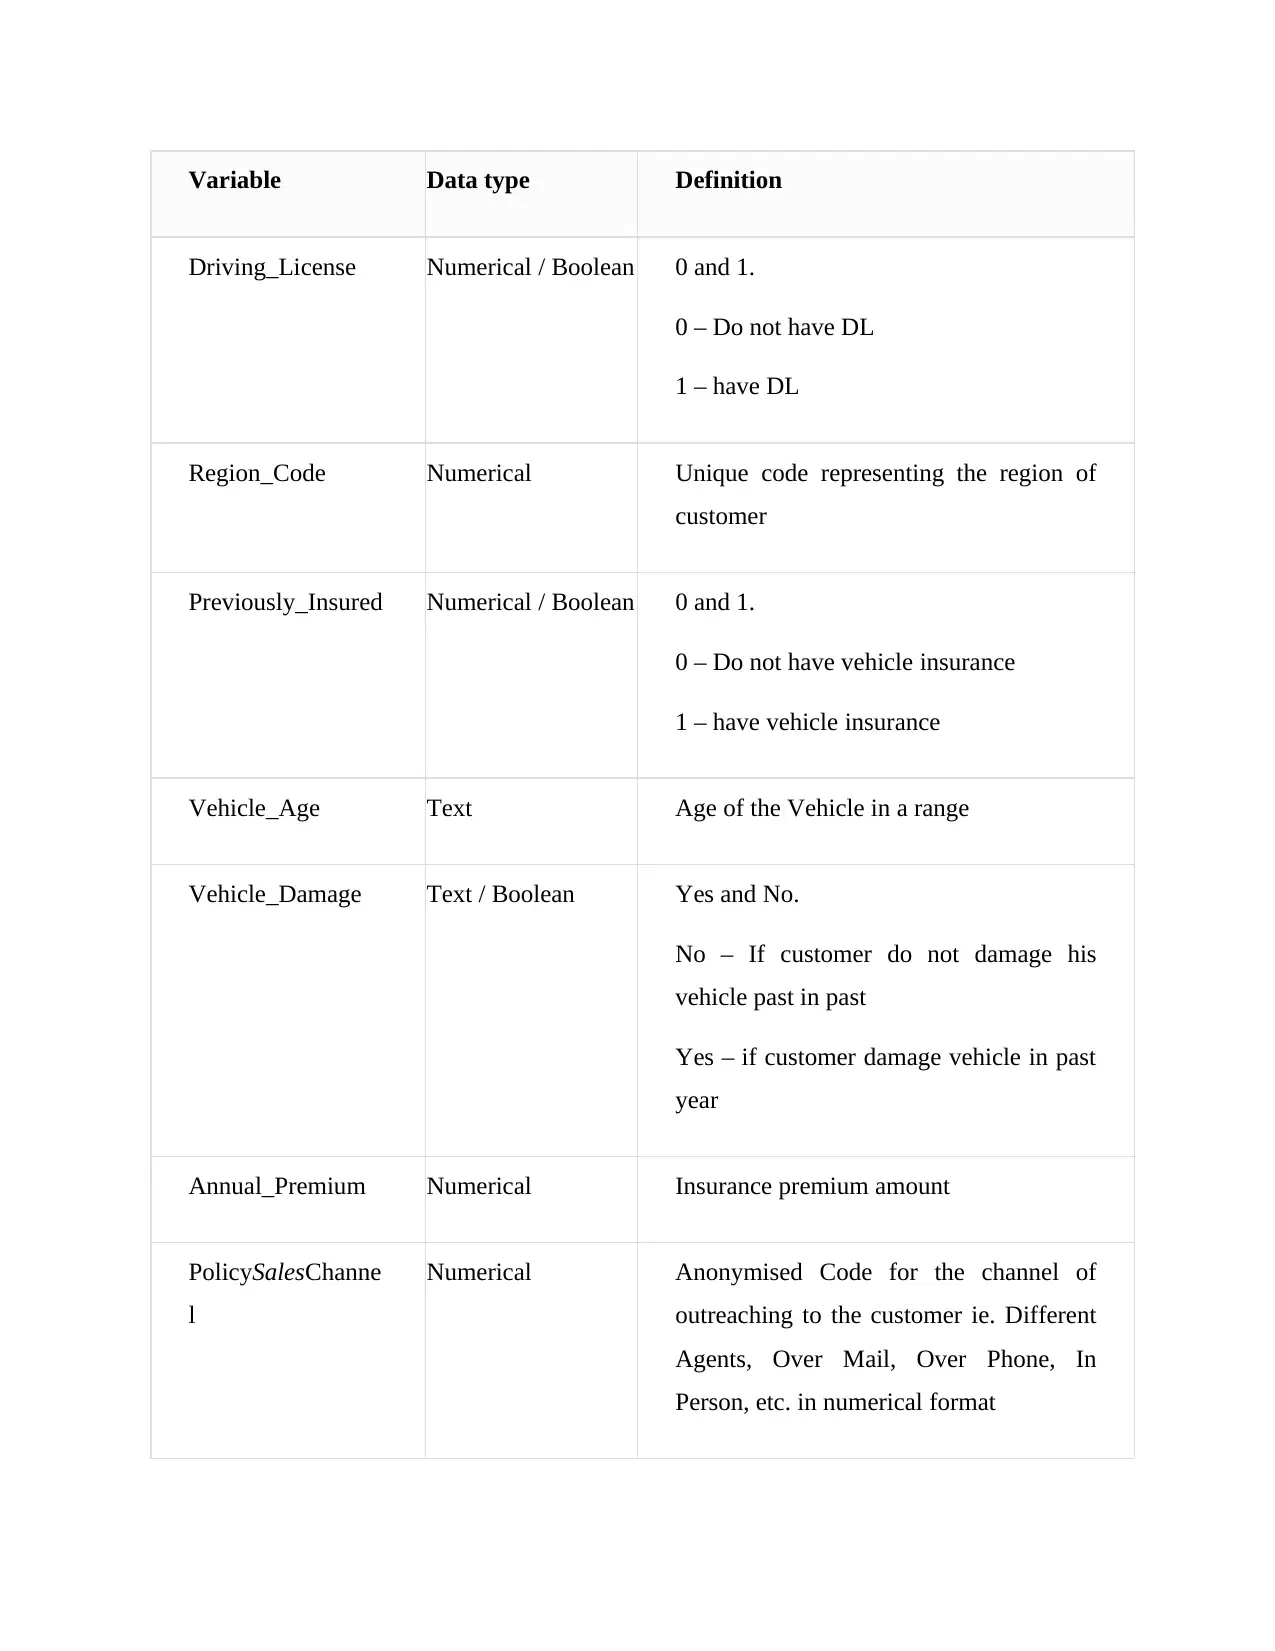
Variable Data type Definition
Driving_License Numerical / Boolean 0 and 1.
0 – Do not have DL
1 – have DL
Region_Code Numerical Unique code representing the region of
customer
Previously_Insured Numerical / Boolean 0 and 1.
0 – Do not have vehicle insurance
1 – have vehicle insurance
Vehicle_Age Text Age of the Vehicle in a range
Vehicle_Damage Text / Boolean Yes and No.
No – If customer do not damage his
vehicle past in past
Yes – if customer damage vehicle in past
year
Annual_Premium Numerical Insurance premium amount
PolicySalesChanne
l
Numerical Anonymised Code for the channel of
outreaching to the customer ie. Different
Agents, Over Mail, Over Phone, In
Person, etc. in numerical format
Paraphrase This Document
Need a fresh take? Get an instant paraphrase of this document with our AI Paraphraser
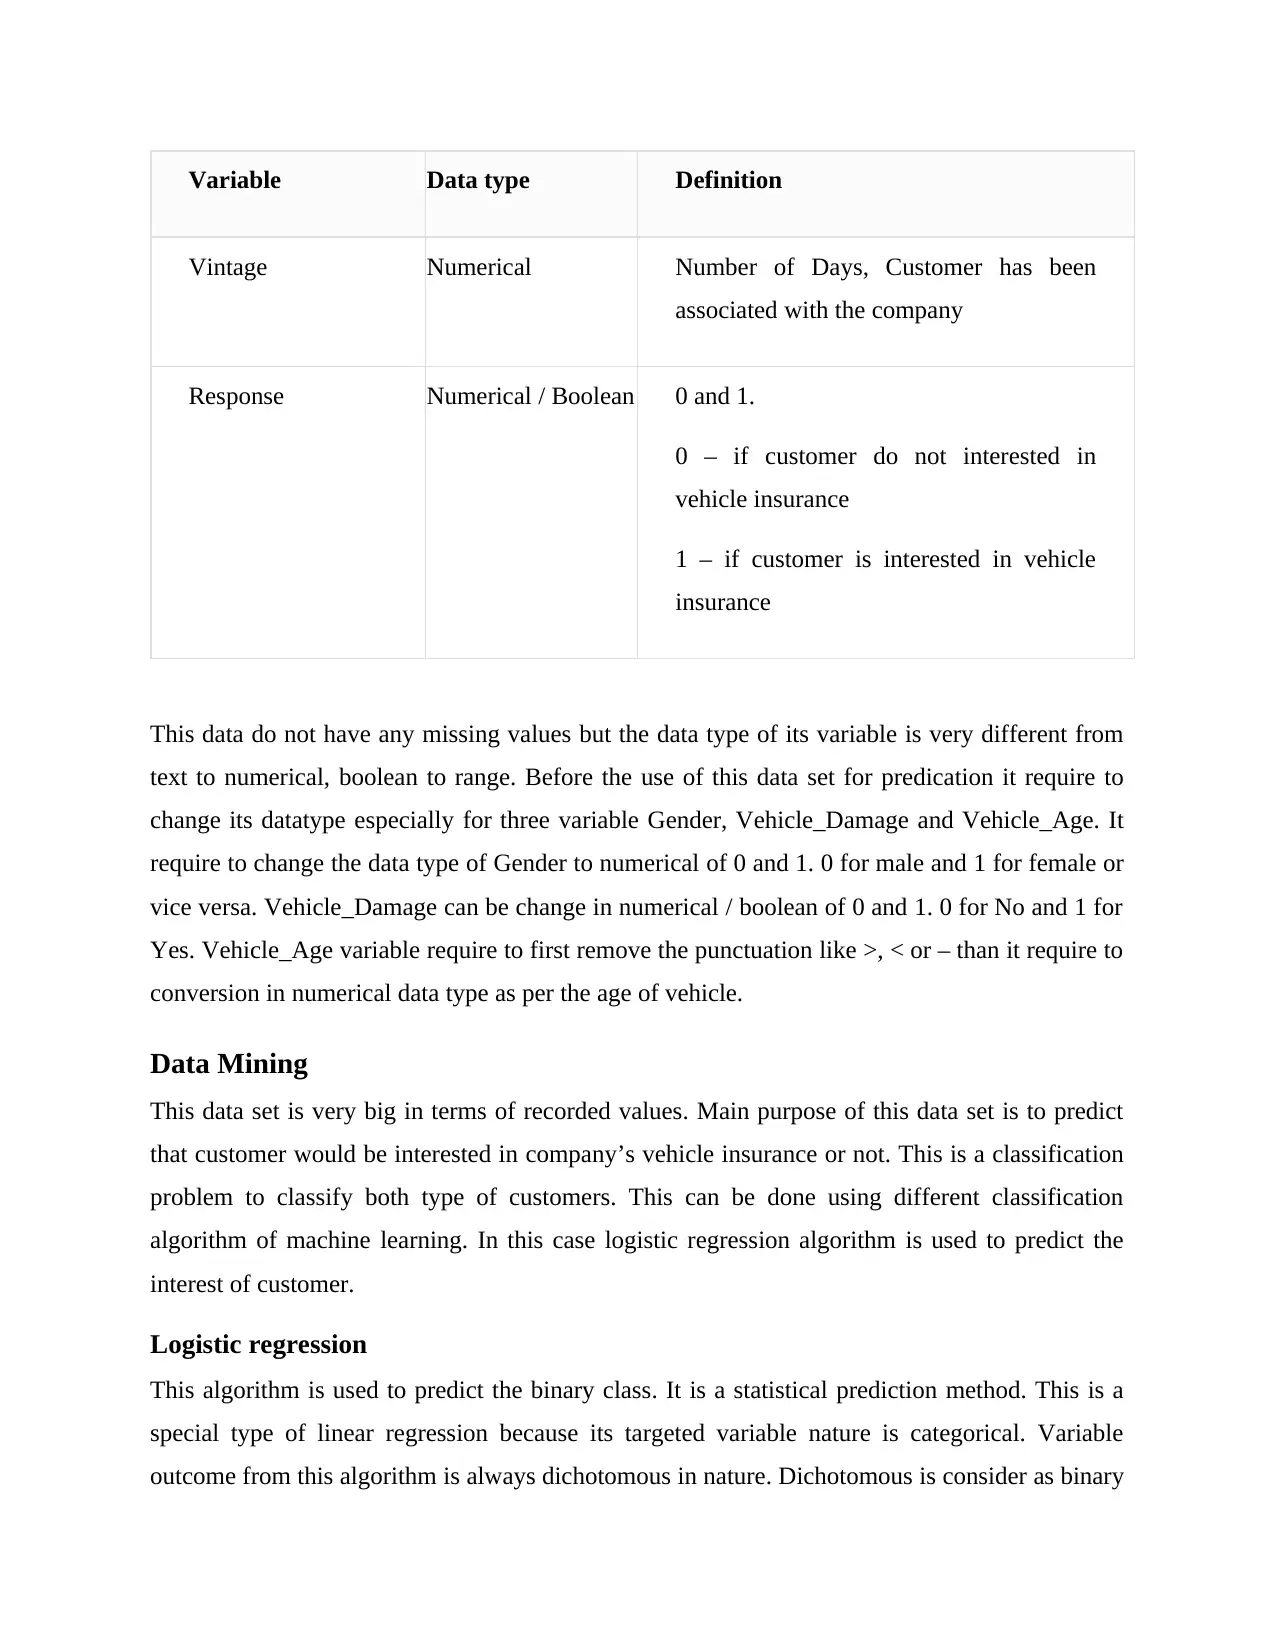
Variable Data type Definition
Vintage Numerical Number of Days, Customer has been
associated with the company
Response Numerical / Boolean 0 and 1.
0 – if customer do not interested in
vehicle insurance
1 – if customer is interested in vehicle
insurance
This data do not have any missing values but the data type of its variable is very different from
text to numerical, boolean to range. Before the use of this data set for predication it require to
change its datatype especially for three variable Gender, Vehicle_Damage and Vehicle_Age. It
require to change the data type of Gender to numerical of 0 and 1. 0 for male and 1 for female or
vice versa. Vehicle_Damage can be change in numerical / boolean of 0 and 1. 0 for No and 1 for
Yes. Vehicle_Age variable require to first remove the punctuation like >, < or – than it require to
conversion in numerical data type as per the age of vehicle.
Data Mining
This data set is very big in terms of recorded values. Main purpose of this data set is to predict
that customer would be interested in company’s vehicle insurance or not. This is a classification
problem to classify both type of customers. This can be done using different classification
algorithm of machine learning. In this case logistic regression algorithm is used to predict the
interest of customer.
Logistic regression
This algorithm is used to predict the binary class. It is a statistical prediction method. This is a
special type of linear regression because its targeted variable nature is categorical. Variable
outcome from this algorithm is always dichotomous in nature. Dichotomous is consider as binary
means it has two possible outcome. It uses a log of odds as the dependent variable. It use logit
function to predict the probability of occurrence a binary event. This algorithm compute
probability of happening any event. In this report this algorithm is used to predict that customer
is interested in vehicle insurance or not. It has many other use case such as detecting the
probability of happening cancer.
Equation of linear regression is given by-
y = β0 + β1X1 + β2X2 + B3X3 ……………………… βnXn
Here
y – Dependent variable or targeted variable
X – Explanatory variable or in dependent variable
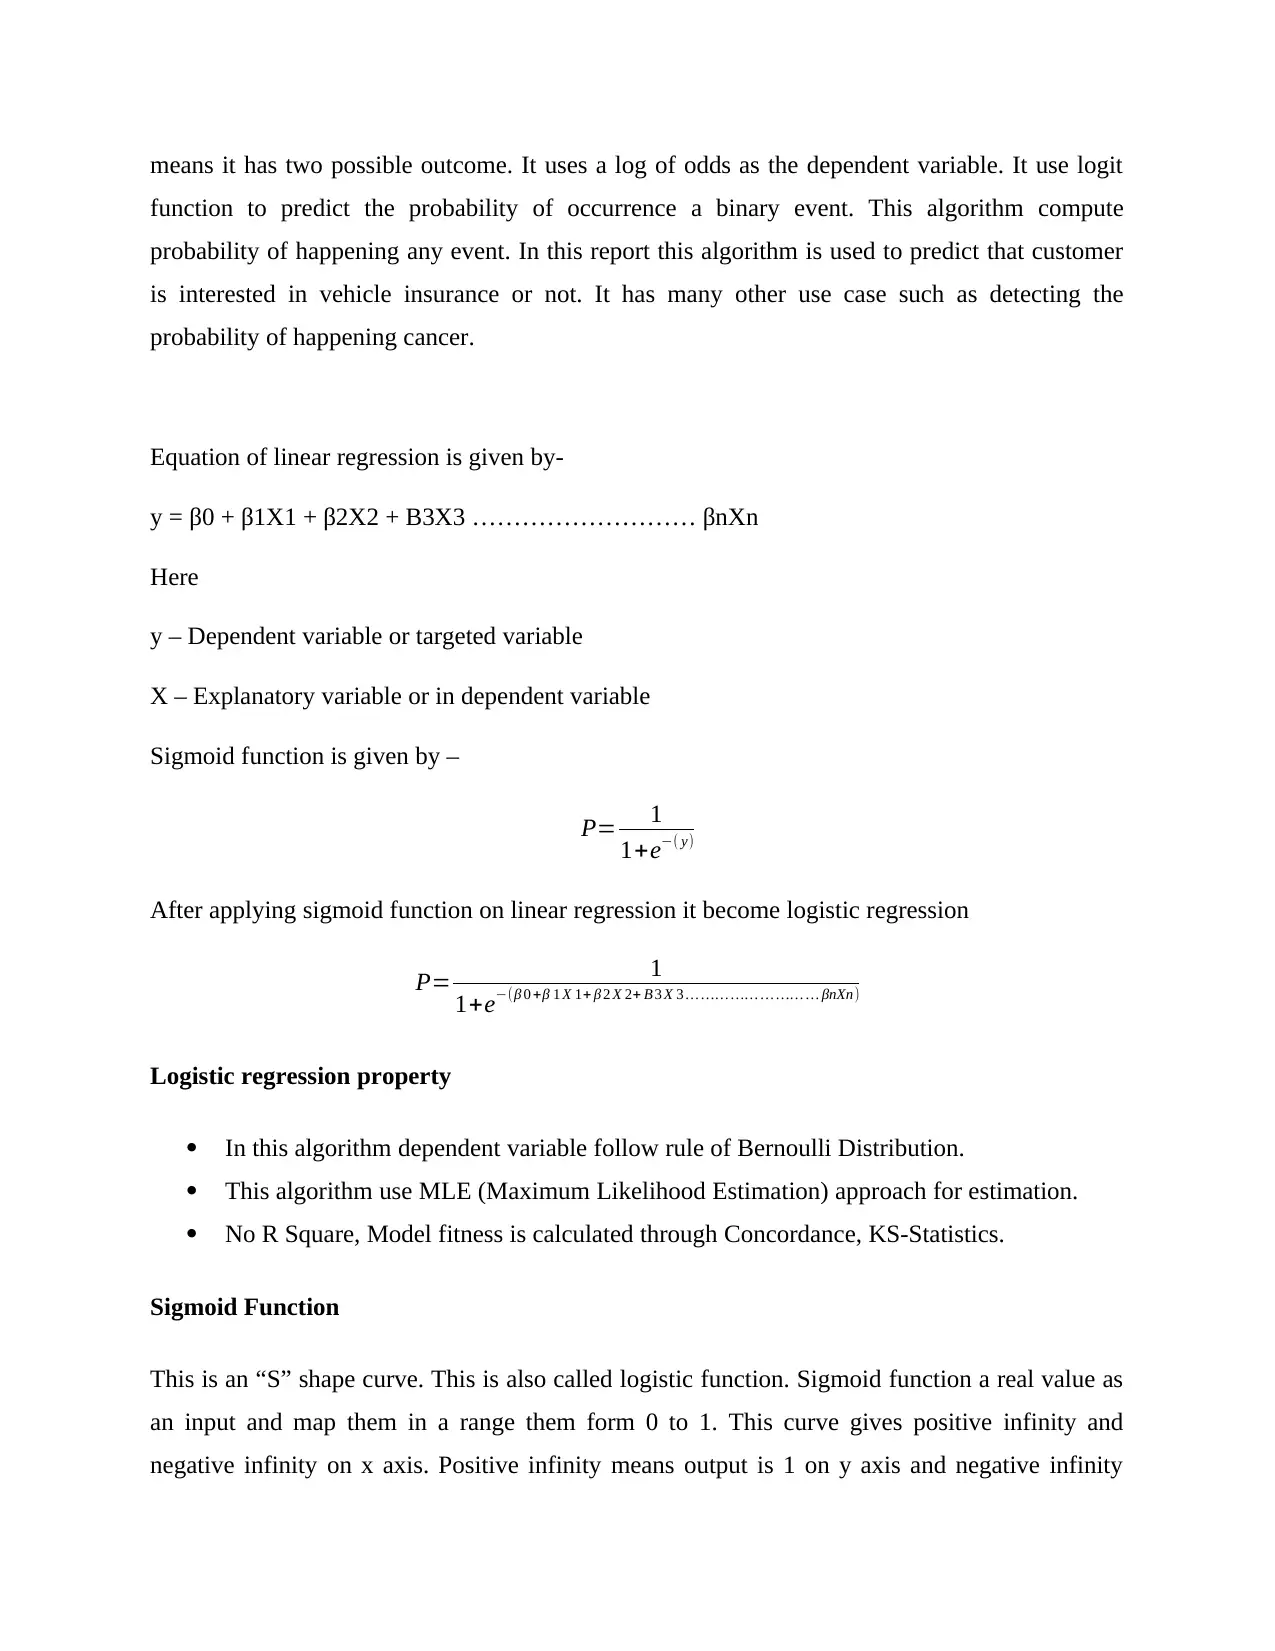
Sigmoid function is given by –
P= 1
1+e−( y)
After applying sigmoid function on linear regression it become logistic regression
P= 1
1+e−(β 0 +β 1 X 1+ β 2 X 2+ B 3 X 3 … …… …… … …… … βnXn)
Logistic regression property
In this algorithm dependent variable follow rule of Bernoulli Distribution.
This algorithm use MLE (Maximum Likelihood Estimation) approach for estimation.
No R Square, Model fitness is calculated through Concordance, KS-Statistics.
Sigmoid Function
This is an “S” shape curve. This is also called logistic function. Sigmoid function a real value as
an input and map them in a range them form 0 to 1. This curve gives positive infinity and
negative infinity on x axis. Positive infinity means output is 1 on y axis and negative infinity
function to predict the probability of occurrence a binary event. This algorithm compute
probability of happening any event. In this report this algorithm is used to predict that customer
is interested in vehicle insurance or not. It has many other use case such as detecting the
probability of happening cancer.
Equation of linear regression is given by-
y = β0 + β1X1 + β2X2 + B3X3 ……………………… βnXn
Here
y – Dependent variable or targeted variable
X – Explanatory variable or in dependent variable
Sigmoid function is given by –
P= 1
1+e−( y)
After applying sigmoid function on linear regression it become logistic regression
P= 1
1+e−(β 0 +β 1 X 1+ β 2 X 2+ B 3 X 3 … …… …… … …… … βnXn)
Logistic regression property
In this algorithm dependent variable follow rule of Bernoulli Distribution.
This algorithm use MLE (Maximum Likelihood Estimation) approach for estimation.
No R Square, Model fitness is calculated through Concordance, KS-Statistics.
Sigmoid Function
This is an “S” shape curve. This is also called logistic function. Sigmoid function a real value as
an input and map them in a range them form 0 to 1. This curve gives positive infinity and
negative infinity on x axis. Positive infinity means output is 1 on y axis and negative infinity
⊘ This is a preview!⊘
Do you want full access?
Subscribe today to unlock all pages.
Trusted by 1+ million students worldwide
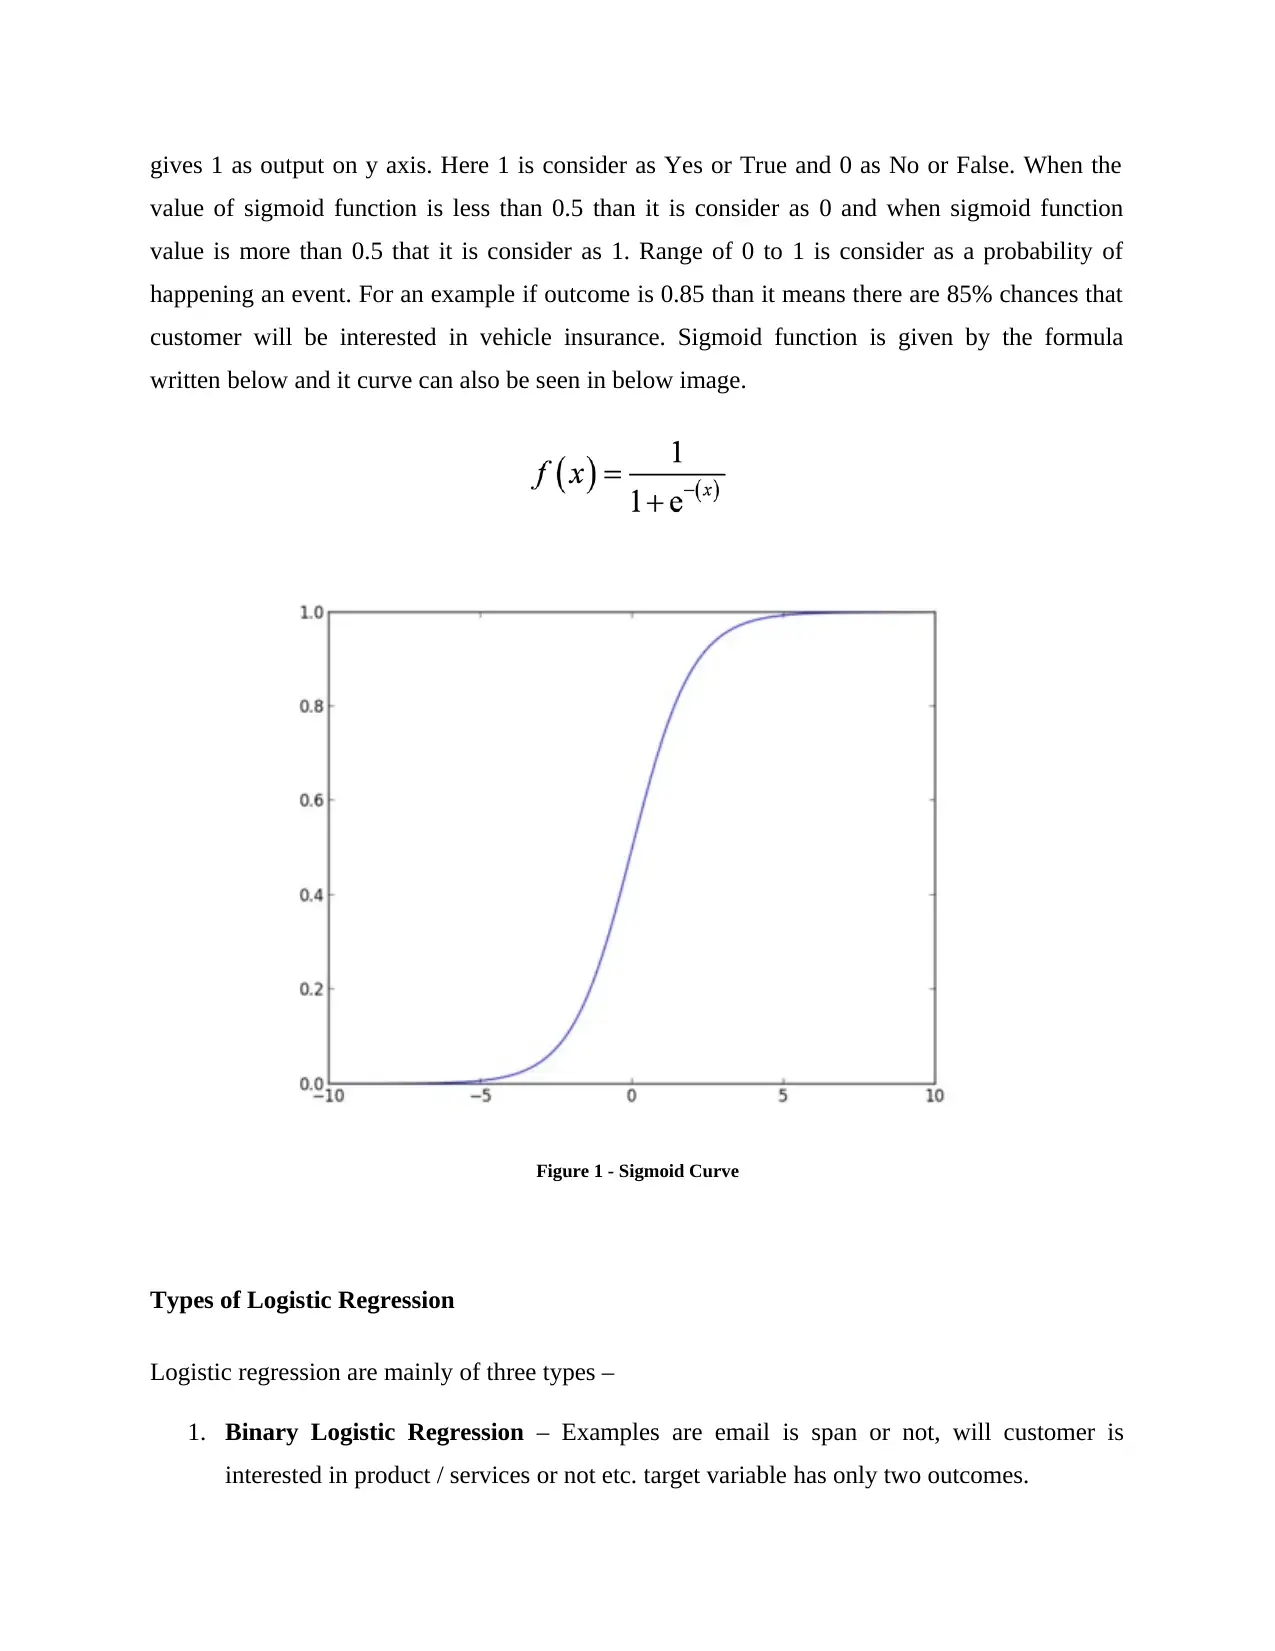
gives 1 as output on y axis. Here 1 is consider as Yes or True and 0 as No or False. When the
value of sigmoid function is less than 0.5 than it is consider as 0 and when sigmoid function
value is more than 0.5 that it is consider as 1. Range of 0 to 1 is consider as a probability of
happening an event. For an example if outcome is 0.85 than it means there are 85% chances that
customer will be interested in vehicle insurance. Sigmoid function is given by the formula
written below and it curve can also be seen in below image.
Figure 1 - Sigmoid Curve
Types of Logistic Regression
Logistic regression are mainly of three types –
1. Binary Logistic Regression – Examples are email is span or not, will customer is
interested in product / services or not etc. target variable has only two outcomes.
Paraphrase This Document
Need a fresh take? Get an instant paraphrase of this document with our AI Paraphraser
2. Multinomial Logistic Regression – Example is predicting type of wine etc. In this
regression target variable has three or more than three nominal categorical outcome.
3. Ordinal Logistic Regression – Example is predicting rating of product / restaurant from
1 to 5. This regression also require more than two ordinal category in targeted variable.
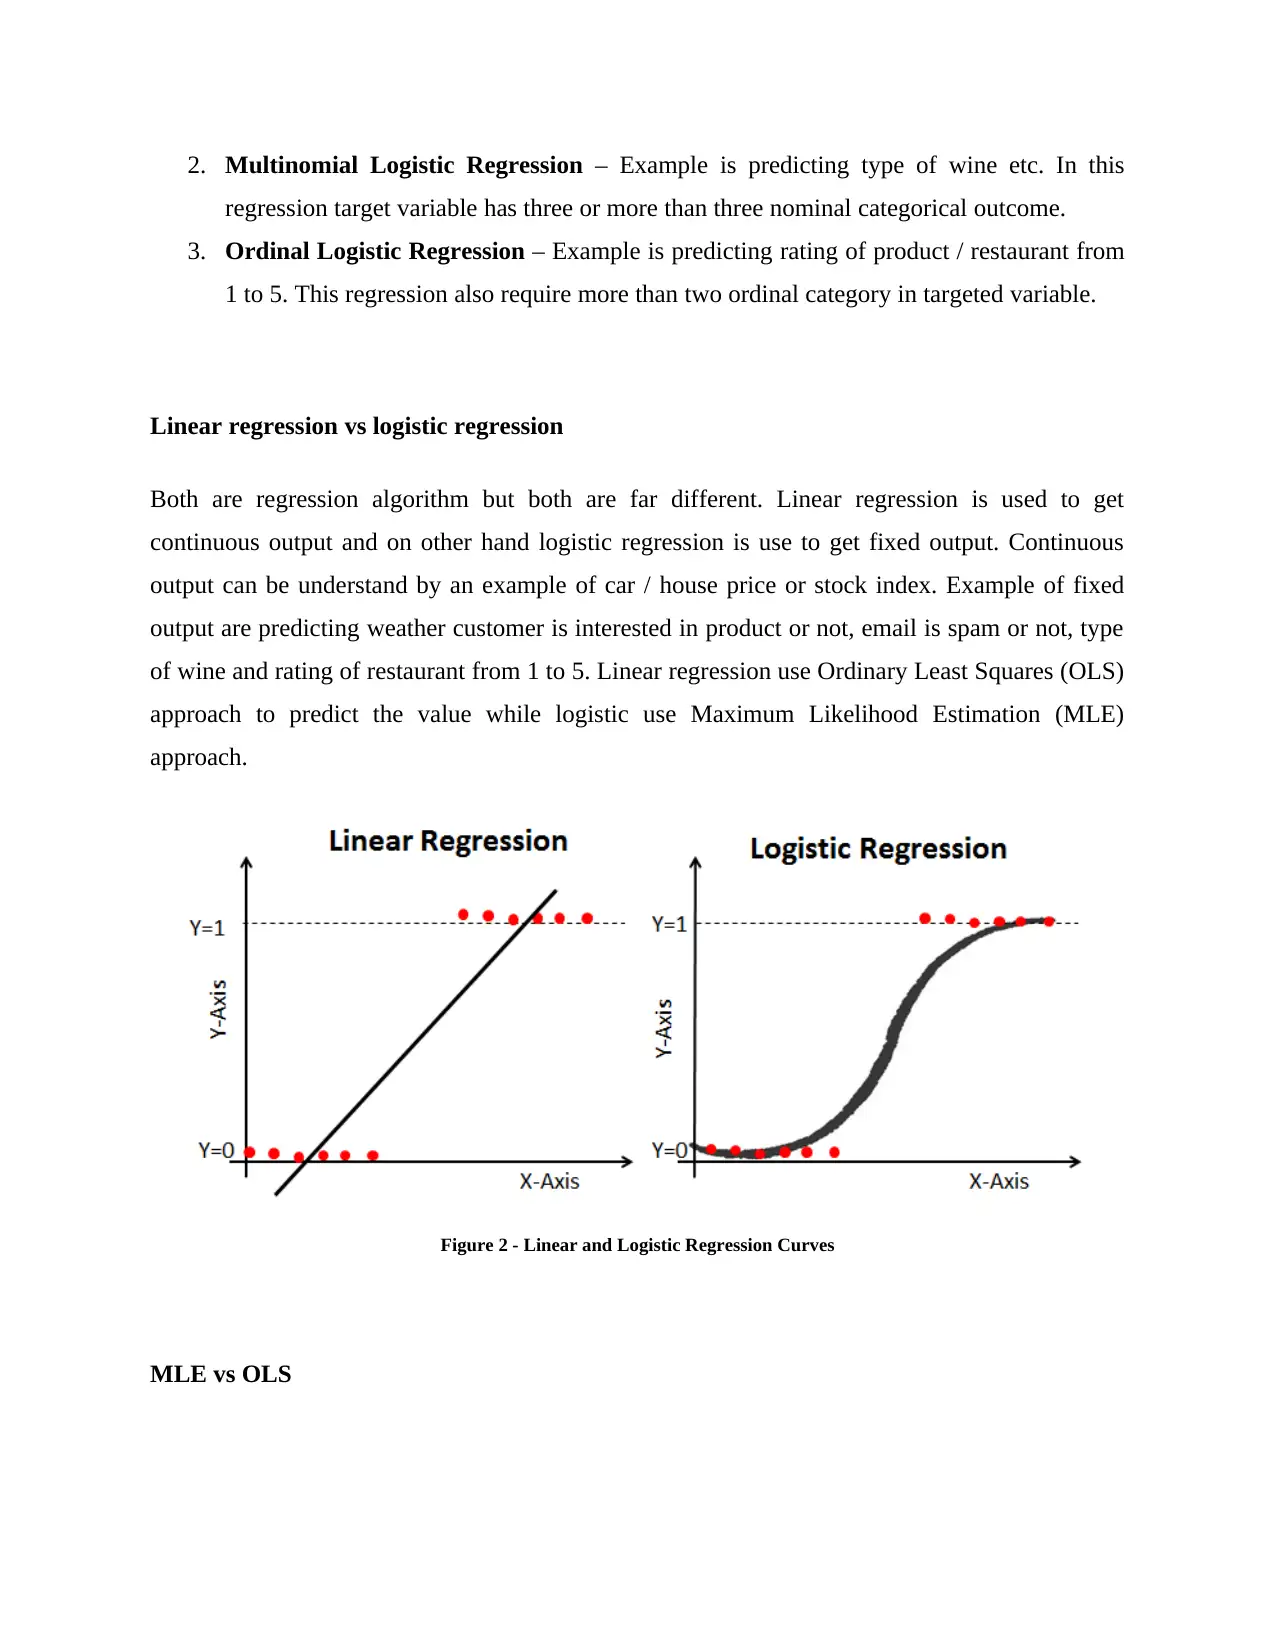
Linear regression vs logistic regression
Both are regression algorithm but both are far different. Linear regression is used to get
continuous output and on other hand logistic regression is use to get fixed output. Continuous
output can be understand by an example of car / house price or stock index. Example of fixed
output are predicting weather customer is interested in product or not, email is spam or not, type
of wine and rating of restaurant from 1 to 5. Linear regression use Ordinary Least Squares (OLS)
approach to predict the value while logistic use Maximum Likelihood Estimation (MLE)
approach.
Figure 2 - Linear and Logistic Regression Curves
MLE vs OLS
regression target variable has three or more than three nominal categorical outcome.
3. Ordinal Logistic Regression – Example is predicting rating of product / restaurant from
1 to 5. This regression also require more than two ordinal category in targeted variable.
Linear regression vs logistic regression
Both are regression algorithm but both are far different. Linear regression is used to get
continuous output and on other hand logistic regression is use to get fixed output. Continuous
output can be understand by an example of car / house price or stock index. Example of fixed
output are predicting weather customer is interested in product or not, email is spam or not, type
of wine and rating of restaurant from 1 to 5. Linear regression use Ordinary Least Squares (OLS)
approach to predict the value while logistic use Maximum Likelihood Estimation (MLE)
approach.
Figure 2 - Linear and Logistic Regression Curves
MLE vs OLS
MLE is based on likelihood maximization method but OLS is distance minimizing
approximation approach. MLE works by finding the parameters that are responsible to produce
the observed data. If looks the statistical method of MLE that it use variance and means as a
parameter to find the specific value of given variable. While OLS put a regression line in points
of data set in a way that the sum of the distance of these points from this line must be minimum.
Or in other words the sum of squared deviation (least square error) should be minimum. MLE
uses joint probability mass function for prediction while OLS does not require any assumption of
this type.
Advantages of logistic regression
One of the simplest classification algorithm.
Easy to implement and do not require high training efficiency and high computation
power.
Can be used to find out the relationship between the attribute of a data set.
Can work well with both scaled and non-scaled features.
Very effective when features are linearly scale able.
Model training time is far less comparatively with other algorithm
Dis-advantages of logistic regression
Assumption of linearity between dependent and in dependent variables
Not as effective if data is non-linear which is almost not possible in real world.
High rely on proper presentation of data.
Do not perform well when data set contain outliers because of its sensitivity to outliers.
Do not predict correct result for small data set with high dimensions.
Can be easily outperformed by other algorithm.
Performance is poor with high co-related features and irrelevant features.
⊘ This is a preview!⊘
Do you want full access?
Subscribe today to unlock all pages.
Trusted by 1+ million students worldwide
1 out of 19
Related Documents


Your All-in-One AI-Powered Toolkit for Academic Success.
+13062052269
info@desklib.com
Available 24*7 on WhatsApp / Email
![[object Object]](/_next/static/media/star-bottom.7253800d.svg)
Unlock your academic potential
Copyright © 2020–2026 A2Z Services. All Rights Reserved. Developed and managed by ZUCOL.