Data Analysis and Forecasting Report: Turkey Vehicle Valuation

Verified

Added on  2023/01/12

|14
|2086
|54
Report
AI Summary
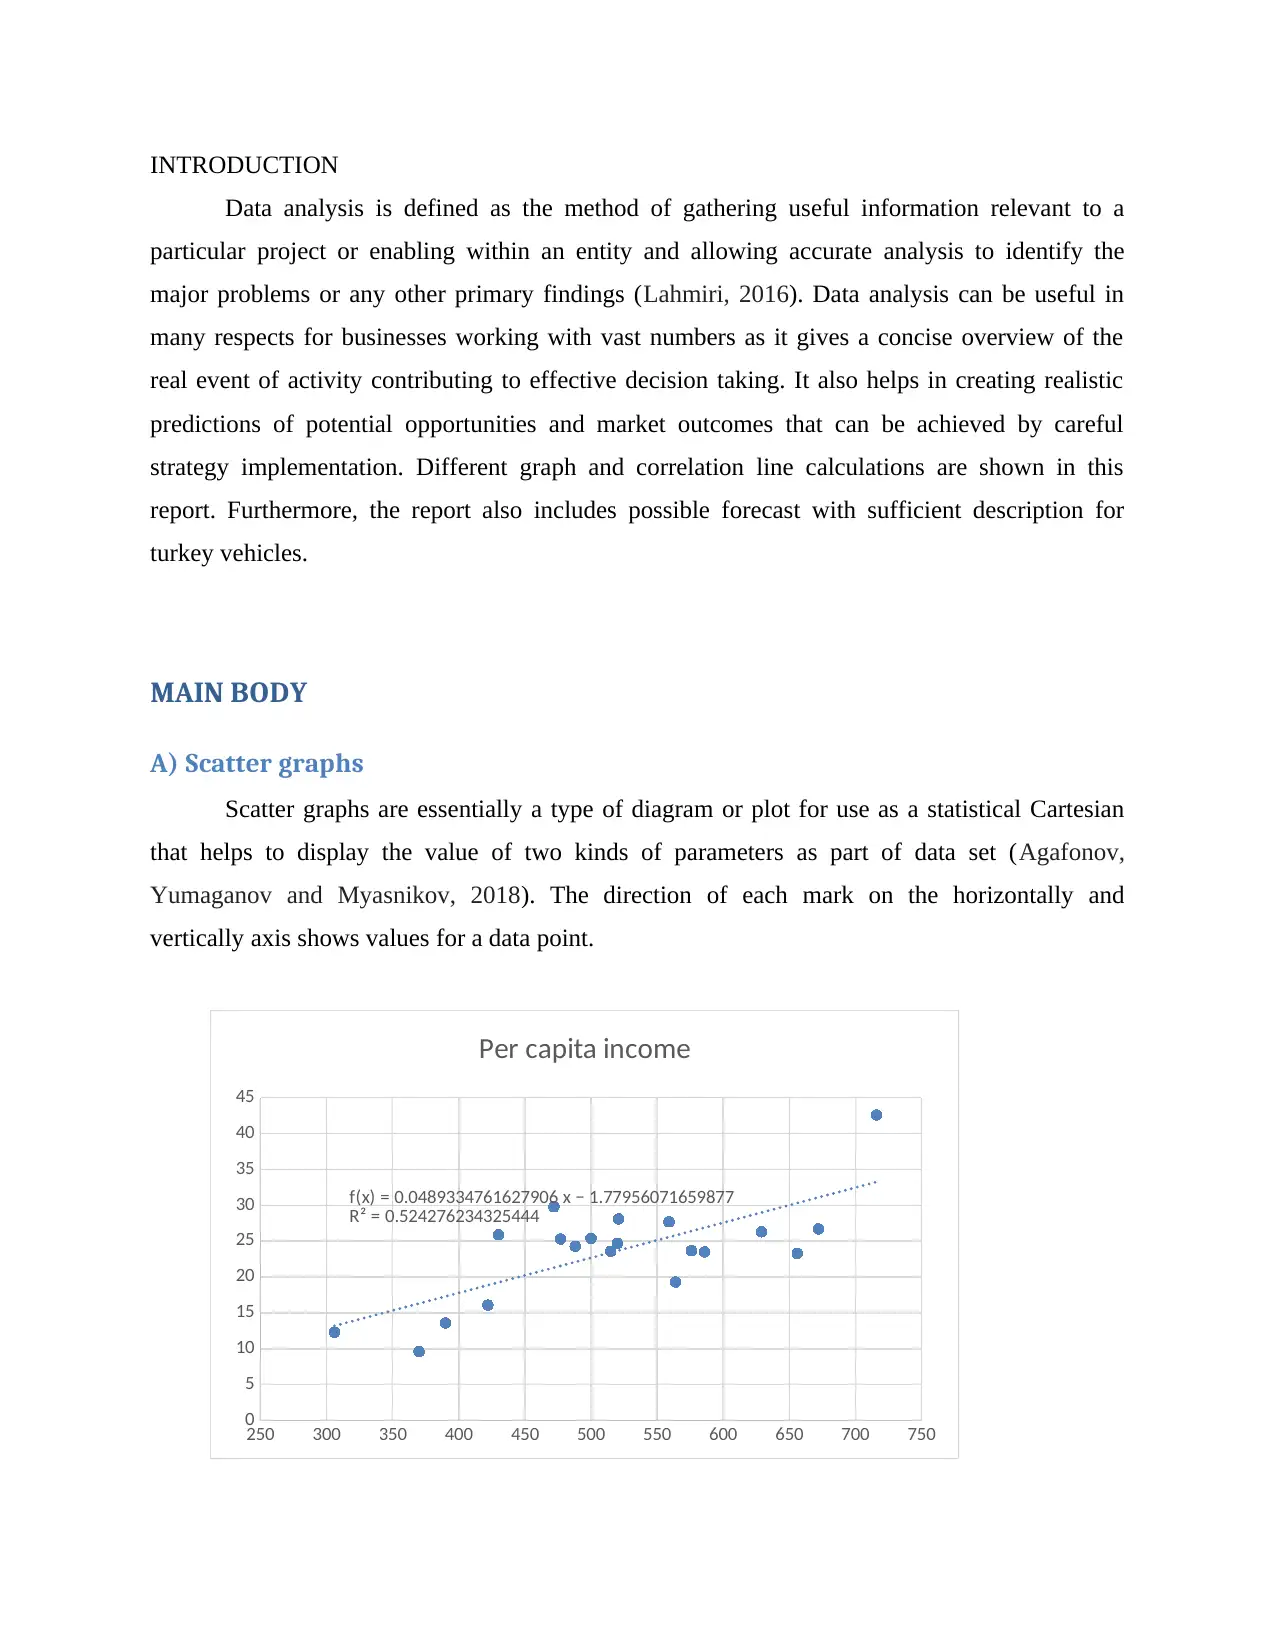
This report presents an analysis of data related to Turkey's population and vehicle ownership, employing various statistical techniques to derive meaningful insights and make predictions. The report begins with an abstract summarizing the key findings, followed by an introduction that highlights the importance of data analysis in understanding trends and making informed decisions. The main body of the report includes scatter graphs illustrating the relationships between different variables, such as per capita income, population, and population density, and vehicles per 1000 population. The report calculates the equation of the regression line for key factors like income and urban population percentages, determining correlation coefficients to assess the strength of these relationships. Further, the report explores the correlation between total vehicle ownership and population density, alongside regression equations. Finally, the report utilizes the derived linear regression equations to forecast future values, providing valuable insights into the potential growth of vehicle ownership and its relationship with population and economic factors. The conclusion summarizes the findings, emphasizing the utility of data analysis and statistical methods in forecasting and decision-making.
Document Page
Individual assessment
(Data Analysis and
Forecasting)
tabler-icon-diamond-filled.svg

Secure Best Marks with AI Grader

Need help grading? Try our AI Grader for instant feedback on your assignments.
Document Page
Contents
Abstract............................................................................................................................................3
MAIN BODY..................................................................................................................................4
A) Scatter graphs.........................................................................................................................4
B) Equation of the regression line...............................................................................................7
C) Scatter graphs..........................................................................................................................7
D) Equation of the regression line...............................................................................................9
E) Two regression equations.......................................................................................................9
F) Future values by using liner regression equations................................................................10
CONCLUSION..............................................................................................................................11
REFERENCES..............................................................................................................................12
Document Page
Abstract
Useful data analysis and prediction principles are shown in this report that aid in
estimating the valuation of Turkey's overall population and vehicles used in urban areas. The
regression method principle is useful in identifying the actual association between factors which
facilitates successful decision taking.
Document Page
INTRODUCTION
Data analysis is defined as the method of gathering useful information relevant to a
particular project or enabling within an entity and allowing accurate analysis to identify the
major problems or any other primary findings (Lahmiri, 2016). Data analysis can be useful in
many respects for businesses working with vast numbers as it gives a concise overview of the
real event of activity contributing to effective decision taking. It also helps in creating realistic
predictions of potential opportunities and market outcomes that can be achieved by careful
strategy implementation. Different graph and correlation line calculations are shown in this
report. Furthermore, the report also includes possible forecast with sufficient description for
turkey vehicles.
MAIN BODY
A) Scatter graphs
Scatter graphs are essentially a type of diagram or plot for use as a statistical Cartesian
that helps to display the value of two kinds of parameters as part of data set (Agafonov,
Yumaganov and Myasnikov, 2018). The direction of each mark on the horizontally and
vertically axis shows values for a data point.
250 300 350 400 450 500 550 600 650 700 750
0
5
10
15
20
25
30
35
40
45
f(x) = 0.0489334761627906 x − 1.77956071659877
R² = 0.524276234325444
Per capita income
tabler-icon-diamond-filled.svg

Secure Best Marks with AI Grader

Need help grading? Try our AI Grader for instant feedback on your assignments.
Document Page
Correlation between per capita income and vehicles per 1000 population is 0.724.
250 300 350 400 450 500 550 600 650 700 750
0
10
20
30
40
50
60
70
80
90
f(x) = 0.0382113047764338 x + 2.22434903865789
R² = 0.0261604503904177
Population (millions)
Correlation between Population and vehicles per 1000 population is 0.162.
250 300 350 400 450 500 550 600 650 700 750
0
100
200
300
400
500
600
f(x) = 0.0168472976576774 x + 131.615518529377
R² = 0.000237964518570277
Population density per km^2
Correlation between Population density per km^2 and vehicles per 1000 population is
0.015
Document Page
250 300 350 400 450 500 550 600 650 700 750
0
20
40
60
80
100
120
f(x) = 0.046211813056212 x + 52.6414855210069
R² = 0.153650187199907
% of population in urban areas
Correlation between Percentage of population in urban areas and vehicles per 1000
population is 0.392.
On the basis of above-mentioned scatter graph, it has been noted there are a total of 20
nations to which statistics on car use and other variables such as cars per thousand populations is
seen against employment, economy, density and percentages of urban population (Wang, Wang
and Zhang, 2018). The numerous graphs are successful in deciding the correlation value which
helps to establish the equation of the line of regression. In particular, if the correlation of -1
indicates that there is a significant increase in a given proportions in the other for every
substantial change in one variable, it is defined. Similarly, null means there is no positively or
negatively change in the component variables for each rise. This graph 1 indicates a coefficient
level of 0.724 for vehicles per thousand communities against wages, graph 2 reveals a
coefficients value of 0.162, a value of 0.015 in graph 3. Figure 4 likewise displays the
association coefficient as 0.392. From this graph it is known that the association between
vehicles per thousand people with incomes rates and half of the population living in urban is
similar to one another.
Correlation (per capital income and 1000
vehicle) 0.724
Correlation (Population (million) and 1000
vehicle) 0.162
Correlation (Population density per km^2
and vehicles per 1000 population) 0.015
Document Page
Correlation (Percentage of population in
urban areas and vehicles per 1000
population) 0.392
B) Equation of the regression line
From the above table, two dependent factors such as level of income and real proportion
of Population Residing Areas are found to be more associated with the individual variable
Vehicles per 1000 people. For these factors the liner equation is as pursues:
Formula of equation: Y= a + bX, where Y is the depending variable, and X represents the
independent differential value. To get the value of A and b.
The liner formula is for People living in urban areas and for Cars per 1000 people:
Y= 0.0462x + 52.641
R2 = 0.01537
Furthermore, the calculation of the regression line for Vehicles per 1000 people and people level
of income is as pursues:
Y= 0.0489x-1.7796
R2 = 0.5243
C) Scatter graphs
0 10 20 30 40 50 60
0
10
20
30
40
50
60
70
80
90
f(x) = 1.67891527402687 x + 2.1398540027816
R² = 0.974396989311985
Population (millions)
For entire nations the association between gross car ownership and population level is 0.987.
tabler-icon-diamond-filled.svg

Paraphrase This Document

Need a fresh take? Get an instant paraphrase of this document with our AI Paraphraser
Document Page
0 10 20 30 40 50 60
0
100
200
300
400
500
600
f(x) = 2.2111391560517 x + 114.148001000787
R² = 0.0790862076989077
Population density per km^2
Correlation between total vehicle ownership and population density per km^2 is
0.281.
0 10 20 30 40 50 60
0
20
40
60
80
100
120
f(x) = 0.0997108018808916 x + 75.4184269977114
R² = 0.0138015666591467
% of population in urban areas
The correlation between total car owning and proportion of urban population is 0.117.
From the following graphical analysis, it is found that the positive correlation between
both dependent variable and independent factor has. Like the value of the correlation between
total car ownership and population level in different regions is of similar importance to the
regular association significance. Therefore, in the meantime, 0.987 is known to be the nearest
Document Page
value of strong correlation and can be used to evaluate the regression significance of these
parameters.
D) Equation of the regression line
Linear regression tests an estimate that greatly decreases the distance between the related
rows from all the datasets. Conceptually, the study of common minus squares (OLS) decreases
the cumulative squared residuals (Sun, Wang and Zhang, 2017). Therefore, if the deviations
between the observed values and the model's predicted values are small and neutral a model
should work well with the findings. R-squared is a quantitative indicator of how close the
direction of regression built with the results is. It is often known as the variable of judgment, or
as several judgment factors for certain regressions. Although the R-squared value is limited but
also has statistically relevant determinants, it is still important to make critical conclusions as to
how changes in the indicator values are associated with changes in the consequence value.
Independent of the R-squared, the related correlations also represents the mean differences in
response per one unit of shift in the indicator while holding those predictors unaffected in the
process. Of course this sort of information can be extremely helpful.
From the following scatter map, it was calculated that the most important value differential in
entire nations is between total vehicle ownership and population density, thus the liner regression
function is as follows:
Y= 1.6789x + 2.1399
R2 = 0.09744
On the other hand, the equation of regression for total vehicle ownership variables and density
residing in different nations per ^2 km is as follows:
Y= 2.2111x + 114.15
R2 = 0.0791
E) Two regression equations.
From the various regression variables estimated above, below is mentioned the most
valuable liner equation for the auto company:
Vehicles per 1000 population and income level of population is as follows:
Y= 0.0489x-1.7796
R2 = 0.5243
Document Page
Total vehicle ownership and population density living in per ^2 km
Y= 2.2111x + 114.15
R2 = 0.0791
Such two equations of liner regression factors can be a genuinely powerful statistical tool which
can be used to generate insight into consumer desires, a business understanding which affects
profitability. Linear regressions can be used in Car Industry to evaluate trends, and to make
forecasts or predictions. A negative coefficient should then be interpreted as having a low or
opposite relationship with the coefficient of correlation such that it can be considered to be a
positive result (Wang, Liu and Hong, 2016). The primary item for any simulation is the right
understanding of the subject and its business activity. The value of linear regression is that it lets
us grab each marketing strategy's distinct factors along with tracking the factors that may impact
the sales. In real-life cases, there are often commercial campaigns that run with a car
manufacturer during the same time period that is successful in deciding company's net revenue
profit in the immediate future. Analyzing regression should give a theoretical dimension on the
management of companies. The value of linear regression is that it lets us grab each marketing
strategy's distinct factors along with tracking the factors that may impact the sales. In real-life
cases, there are often commercial campaigns that run with a car manufacturer during the same
time span that is successful in deciding company's net revenue profit in the immediate future.
Analyzing regression should give a theoretical dimension on the management of companies.
Analysis of regression leads the way for safer and more knowledgeable decisions by turning the
vast amount of raw data into actionable intelligence. This approach serves as a fantastic tool for
testing a hypothesis before involvement in client results. This improves consumer efficiency by
highlighting sectors that have the biggest effect on revenue and operating results.
F) Future values by using liner regression equations.
The values in part b and c of the above computation are projected to mean that vehicles in
1000 turkey populations are 518 and the total vehicle in turkey is 11.85 per holder on the other
hand.
tabler-icon-diamond-filled.svg

Secure Best Marks with AI Grader

Need help grading? Try our AI Grader for instant feedback on your assignments.
Document Page
CONCLUSION
It has been concluded at the end of this report that data collection is helpful in evaluating
the valuable benefit for potential usage and also facilitates successful efforts to significantly
improve overall efficiency. Additionally, the use of multiple mathematical methods and
techniques such as correlation and regression is useful in determining the potential interest.
Document Page
REFERENCES
Books and Journals
Lahmiri, S., 2016. A variational mode decompoisition approach for analysis and forecasting of
economic and financial time series. Expert Systems with Applications, 55, pp.268-273.
Wang, J., Wang, C. and Zhang, W., 2018. Data Analysis and Forecasting of Tuberculosis
Prevalence Rates for Smart Healthcare Based on a Novel Combination Model. Applied
Sciences. 8(9). p.1693.
Sun, W., Wang, C. and Zhang, C., 2017. Factor analysis and forecasting of CO2 emissions in
Hebei, using extreme learning machine based on particle swarm optimization. Journal of
Cleaner Production. 162. pp.1095-1101.
Wang, P., Liu, B. and Hong, T., 2016. Electric load forecasting with recency effect: A big data
approach. International Journal of Forecasting. 32(3). pp.585-597.
Agafonov, A. A., Yumaganov, A .S. and Myasnikov, V. V., 2018. Big data analysis in a
geoinformatic problem of short-term traffic flow forecasting based on ak nearest
neighbors method. Computer Optics. 42(6). pp.1101-1111.
Document Page
tabler-icon-diamond-filled.svg

Paraphrase This Document

Need a fresh take? Get an instant paraphrase of this document with our AI Paraphraser
Document Page
chevron_up_icon
1 out of 14
circle_padding
hide_on_mobile
zoom_out_icon
logo.png

Your All-in-One AI-Powered Toolkit for Academic Success.

Available 24*7 on WhatsApp / Email

[object Object]