BUSN20019: Impact of Seating Capacity on Restaurant Revenue, Victoria
VerifiedAdded on 2023/03/31
|15
|3441
|320
Project
AI Summary
This project investigates the relationship between restaurant seating capacity and revenue generation in Victoria, Australia. The study aims to determine how available seating capacity affects revenue, using data collected from six restaurants through questionnaires and interviews. The analysis employs descriptive statistics and correlation analysis to explore the impact of seating arrangements on revenue, considering factors like customer service and food quality. The findings suggest a direct correlation between seating capacity and revenue, with restaurants in high-density areas generally experiencing higher revenue, although customer satisfaction may be lower compared to low-density locations. The project also touches on revenue management strategies and the theory of commodity and perceived value in the context of restaurant operations. Desklib provides access to this project and other solved assignments for students.
Running Head: RELATIONSHIP BETWEEN SEATING CAPACITY OF FAST FOOD
RESTAURANTS WITH REVENUE 1
Professional Project (BUSN20019)
Submitted by:
Name: Bijaya Thapa
Student ID: 12063592
Central Queensland University, Melbourne
Submitted To:
Sardana Khan, Tutor
Abstract
In the recent past there has been various discussions and research about restaurant space capacity
in relation to revenues (Kemp, 2013). In our study we carried out an investigation at Victoria town in
Australia, to determine if the seating capacity of a restaurant can determine the amount of revenue
Paraphrase This Document
Need a fresh take? Get an instant paraphrase of this document with our AI Paraphraser
2
2
SEATING CAPACITY OF RESTAURANTS VS REVENUE
generated by restaurants. The objective of the study is to find how the available seating capacity can
affect the revenue generation of a restaurant (Ivanov, 2014). Six hotels were sampled for the study to
obtain data, I used questionnaires as a source of primary data and closed ended questions were used
by the respondents. I also used descriptive statistics and correlation analysis for data analysis. (Sheryl
E. Kimes, 2015)The study relied on two dimensions factors that have to be kept constant to find the
true effect of the capacity of a restaurant in relation to revenue. The First dimension is the quality of
customer service offered determines at a greater extent the revenue collected and second is the
quality of the food service determines the revenue a restaurant can collect at a particular time. (B.
Joseph Pine, 2011)
Table of Contents
Abstract………………………………………………………………………………………………………………………………………………..2
Introduction………………………………………………………………………………………………………….3
1.1Research aim and objectives ............................................................................................................... 4
1.2 Research questions ......................................................................................................................................... 4
2.Literature review .................................................................................................. 5
3.Methodology ........................................................................................................ 7
3.1 Data collection……………………………………………………………..……………………………………………………………….7
3.2 Data analysis and findings…………………………………………………….…………………………………………………………8
4. Discussion,recommendations and conclusion…………………………………..……..……11
4.1 Discussion…………………………………………………………………………………………………………………………....…….……11
4.2Recommendation……………………………………………………………………………………………………..……………………………12
4.3 Conclusion………………………………………………………………………………………………………………………….………………12
5. Reference list……………………………………………………………………………………..…...13
List of figures
Figure1.0 The above graph shows the sales when seats were for increased from30-50 seats in the
month of July and their profit margin the whole year of 2014………………………..…………..9
3
3
SEATING CAPACITY OF RESTAURANTS VS REVENUE
Figure1.1 The graph above represents the increased number of chairs at a rate of 40% in restaurant
2 for a period of 3 years……………………………………………………………………………………10
Figure1.2.The graph above present graph for restaurant 3 I the CBD with an increase capacity of
seating at 50%...............................................................................................................................11
Tables
The table below shows data was tabulated of one of the restaurants for 5months………….8
1 Introduction
The service industries in the recent past have faced serious challenges in regard to capacity during
peak seasons when they get influx of customers, this makes service delivery inefficient and difficult.
The aim of this study is to find out how restaurants work to ensure proper utilization of available
capacity and how it impacts revenue generation. (Michael J. O'Fallon, 2010) According to
research that was conducted it was found out that customers love places where ther’s enough space
and seats where they can have their confidential conversations with each other. The desire to go for
places with adequate seats to avoid the pressure of taking their meals in hurry so that other clients
can have seats to seat on and take their meals. (Enz, The Cornell School of Hotel Administration
Handbook of Applied Hospitality Strategy, 2010) Most of the people interviewed preferred places
with high seating capacity and their isn’t congestion of seats in the attempt to fill the space. Others
⊘ This is a preview!⊘
Do you want full access?
Subscribe today to unlock all pages.
Trusted by 1+ million students worldwide
4
4
SEATING CAPACITY OF RESTAURANTS VS REVENUE
preferred the interior design of the restaurant to be so attractive to them, So others desired to spend
their money in such restaurants for short meetings with their clients. These showed that the capacity
of any restaurant, (Management Association, Information Resources, 2014) the number of seats
directly affects the revenue any restaurant generated in Victoria. The study was given a general
aspect to investigate the various hotels to find the primary data which will support my study to make
it a successful and full evidenced.
1.1 Research aim and objectives
The aim of the study was to determine how the capacity in terms of the number of seats impacts the
revenue of restaurants at a given time and season.
The objective of the study is to determine the relationship between the seating capacity and the
revenue collected by fast food restaurants.
1.2 Research questions (Hypothesis)
1. Does any relationship exist between seating capacity of the restaurants with the revenue generated
by that restaurants?
2. Does the relationship vary according to the distance of restaurant from high density area like
Melbourne CBD?
3. Are there new technological systems that can be introduced enable us track the revenue collection
in relation to seating capacity?
2. Literature review
According to various articles written by researchers it has been found out that restaurants need to
have enough seating space and have to show the maximum capacity it can hold as it’s a regulation by
governments like Australia. (Riis, 2010) The seating capacity is determined by the arrangement and
Paraphrase This Document
Need a fresh take? Get an instant paraphrase of this document with our AI Paraphraser
5
5
SEATING CAPACITY OF RESTAURANTS VS REVENUE
layout of tables and seat to fit in the available space. According to researchers the layout of tables
and chairs in a restaurant can either attract more customers hence higher revenue or irritate
customers which will lead to a low revenue turnover (Dooley, 2011).There are theories that have
been used to answer our hypothesis as discussed below;
Restaurant revenue management
Most restaurants have a challenge of limited space and this problem has made most of the restaurants
to work hard so that to maximize revenue through proper capacity utilization. (Ng, The Pricing and
Revenue Management of Services, 2015) Most of the restaurants that have not develop much
interest with RM are those take out their orders to their clients offices and residences without clients
visiting their outlet restaurant, (Kamatn, 2016) these kind of restaurants have no much issue with
space ,However the other restaurants have a higher need for the revenue management system to
enable them track the revenue turnover as per the seating capacity, this is according to Kimes(2012)
who recommended that the principles of RM can be applied in restaurants. While Dickson et
al.(2011) suggested that a reservation system in place could help during high demand prepared
tables for customers this enhances space and capacity management . Most clients love it when they
can book a table and it’s reserved for them. The RM techniques and principles according to the
researcher proved that reservations made according to the time of using a given table made it easy to
manage the seating capacity hence high productivity for the restaurants (Enz, The Cornell School of
Hotel Administration Handbook of Applied Hospitality Strategy, 2010)and customer retention and
more referrals because of the efficiency and cost effectiveness of the RM.
The theory of commodity and perceived value
This theory unveils the response towards the scarcity whereby individuals claim that the extent of
unavailability clearly demarcates the value of the commodity (Ng, The Pricing and Revenue
Management of Services, 2014). But according to the hypothesis, a commodity must be something
6
6
SEATING CAPACITY OF RESTAURANTS VS REVENUE
one can possess and be transferable from one individual to another. An extensive study has been
carried out by researchers in explaining farther the commodity theory explain how revenue is
affected. (Willy Legrand, 2013)Perceived fairness is considered a main factor in customer
satisfaction sustenance in most of the restaurants and generation of high profits for a long time
through achievement of customer loyalty. Most customer have a belief that the value of a customer
should be equal to a firm’s value, if there is any kind of imbalance then then it will affect the revenue
turnover negatively. (Abele Kuipers, 2013)
According to researchers it proved that distance of a restaurant from a high density areas was
considered hypothetical in revenue generated by restaurants in regard to seats occupied. In places
like Melbourne research found that restaurants in high density places, received an influx of
customers, Most of the seats were occupied as compared to those restaurants that are located in the
low density places where only those with private vehicles could access them and most of the seats
were rarely occupied during the day until late evening when their seats were full occupied.
(Mogelonsky, 2012)The research proved that those that went to low density populated restaurants
enjoyed the value of their time considering the interior design, enough space for other recreational
activities as compared to those in high density places where congestion was an issue and most people
of a higher class sighed away from such restaurants. These clearly displayed that revenue generated
by high density located restaurants is higher compared to those in low density though the difference
is the customer satisfaction is low in high density places as compared to low density located
restaurants which were located from the town CBD of Victoria.
From the above discussion and theories that have been presented by various writers and researchers
prove beyond no reasonable doubt that seating capacity has directly and indirectly impacted the
revenue collected by restaurants in Victoria Australia.
⊘ This is a preview!⊘
Do you want full access?
Subscribe today to unlock all pages.
Trusted by 1+ million students worldwide
7
7
SEATING CAPACITY OF RESTAURANTS VS REVENUE
3. Methodology
3.1 Data collection
During investigation of this study different sources of data were assembled and the procedures for
data collections clearly outlined. Primary data and secondary data was collected to determine how
the seating capacity affects the revenue generated by restaurant. The questionnaires were used as the
primary source of data, (Kumar, 2018)whereby I used random sampling to identify 5 restaurants in
the high density places majorly in CBD and 5 hotels from low density restaurants, which are majorly
located outside the CBD town of Victoria. The questionnaires were distributed to the managers of the
specific hotels and I gave them two days to fill the questionnaires which I collected after the period
specified. The data was stored for analysis. Also I conducted one on one interviews with key
stakeholders of the restaurants from the management, the staff of the restaurants and even customers
to determine how the sitting capacity can affect the revenue generated in the specific restaurants. The
interviews were conducted through the use of phone recorder and the interviews were recorded in
audio form. The interview was conducted for four hotels both those in the CBD and those outside the
CBD the results were preserved for farther analysis and discussion (Paul F. J. Eagles, 2017). Then
data I also used secondary sources of data such as online articles, books, periodicals, journals to find
out how seating capacity can affect the amount of revenue in a given restaurant. A sample of the
online resources and links are; www.data.melbourne.vic.gov.au. Other readily available online data
source i.e. www.kaggle.com will provide the data of revenue generated by the relevant restaurants.
The data that was collected was keenly analyzed and the results were displayed in tables and graphs.
3.2. Data analysis and findings
In this study we evaluated the data that we collected from various restaurants and respondents.
Data was analyzed using qualitative techniques. Data was collected from one of the restaurant and
was tabulated as shown below;
Paraphrase This Document
Need a fresh take? Get an instant paraphrase of this document with our AI Paraphraser
8
8
SEATING CAPACITY OF RESTAURANTS VS REVENUE
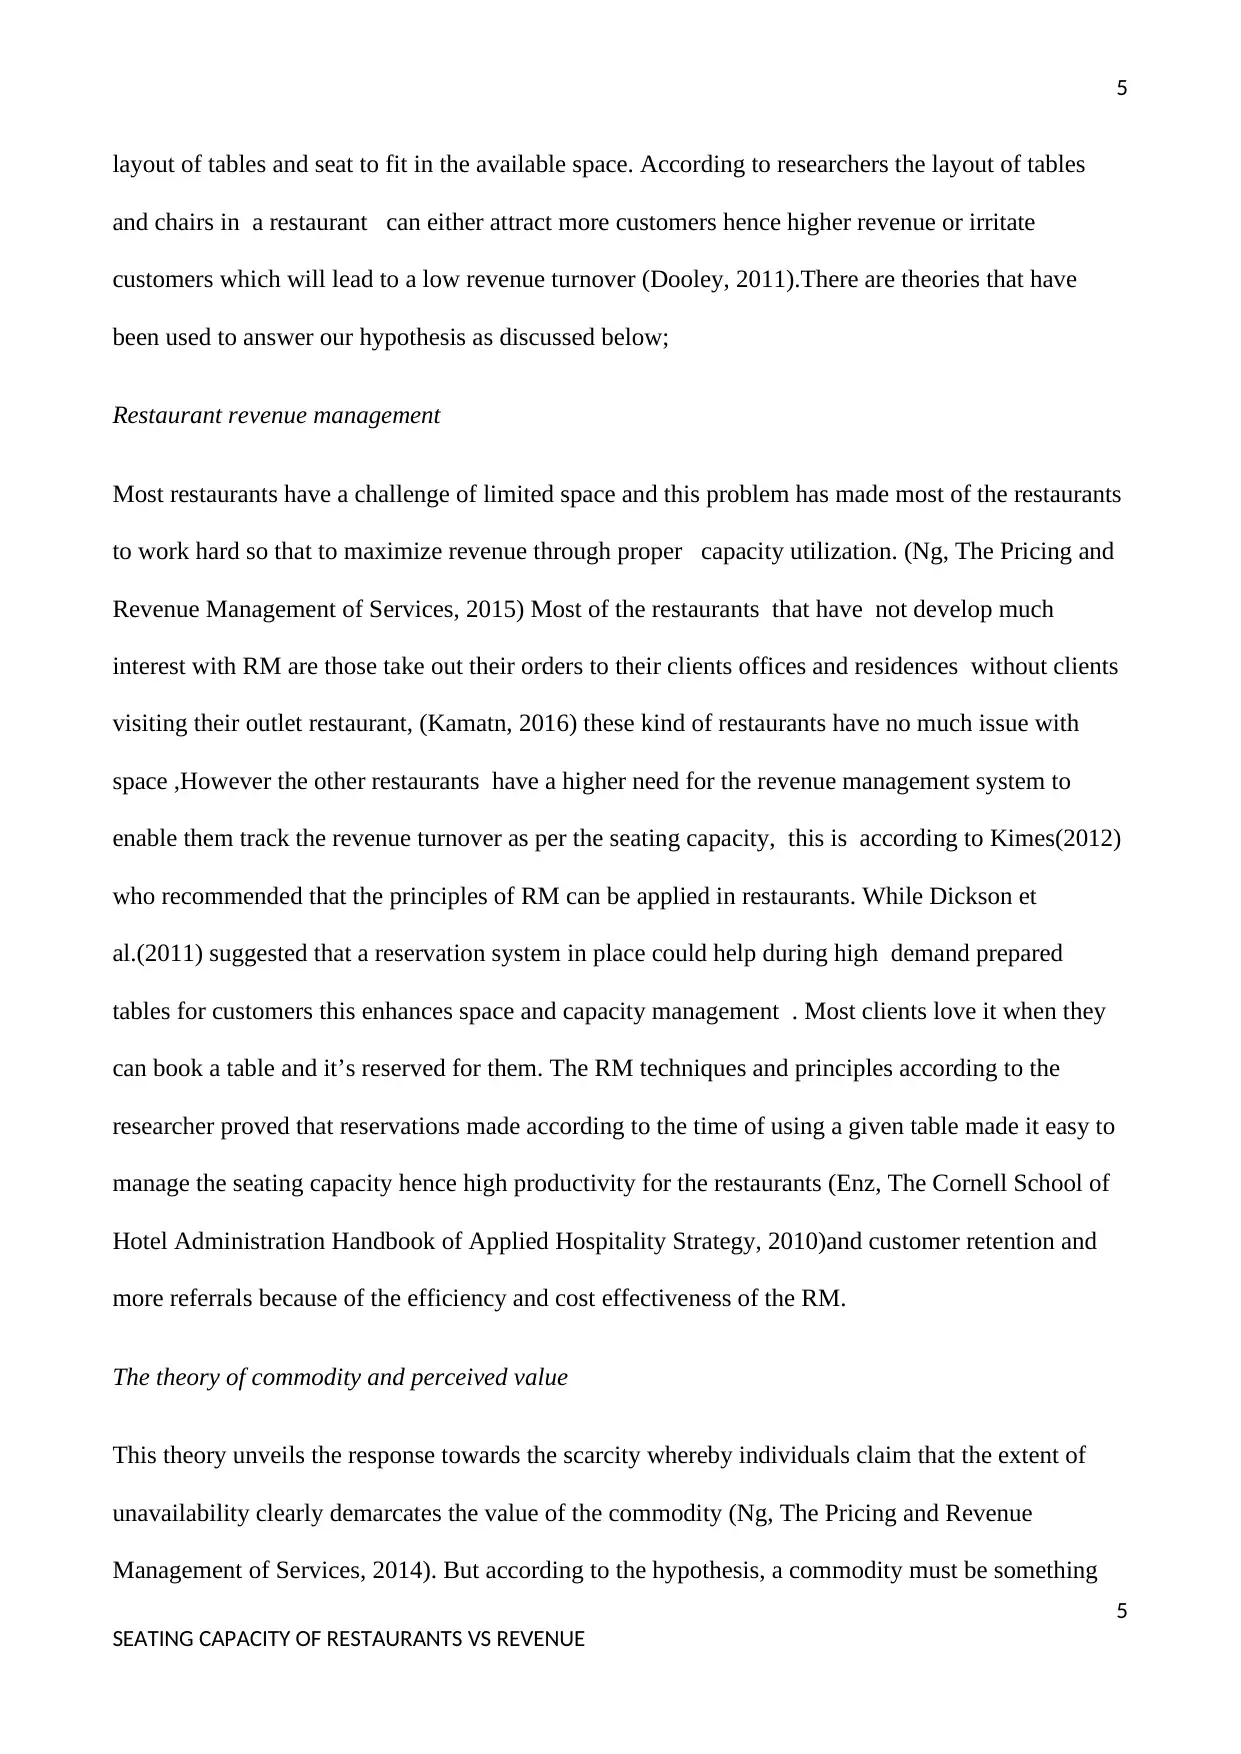
Table 1: Descriptive Statistics
The table below shows data was tabulated of one of the restaurants for 5months
Months No of chairs Revenues
collected
(in dollars)
January 50 2025
February 60 2560
March 75 3502
April 50 2075
May 100 4202
From the above information drawn from the table its shows that an increment in seating capacity in
the restaurants led to subsequent increase of revenue collected in the month of April the restaurant
reduced the number of chairs from 75 to 50 in the same restaurant the revenue that was collected
dramatically dropped from 3502 dollars to 2075 dollars. These clearly illustrates that the seating
capacity in a restaurant has a direct impact on the revenue to be collected. (Treiman, 2009)
The following data was obtained from restaurant one located outside the CBD
8
SEATING CAPACITY OF RESTAURANTS VS REVENUE
Table 1: Descriptive Statistics
The table below shows data was tabulated of one of the restaurants for 5months
Months No of chairs Revenues
collected
(in dollars)
January 50 2025
February 60 2560
March 75 3502
April 50 2075
May 100 4202
From the above information drawn from the table its shows that an increment in seating capacity in
the restaurants led to subsequent increase of revenue collected in the month of April the restaurant
reduced the number of chairs from 75 to 50 in the same restaurant the revenue that was collected
dramatically dropped from 3502 dollars to 2075 dollars. These clearly illustrates that the seating
capacity in a restaurant has a direct impact on the revenue to be collected. (Treiman, 2009)
The following data was obtained from restaurant one located outside the CBD
9
9
SEATING CAPACITY OF RESTAURANTS VS REVENUE
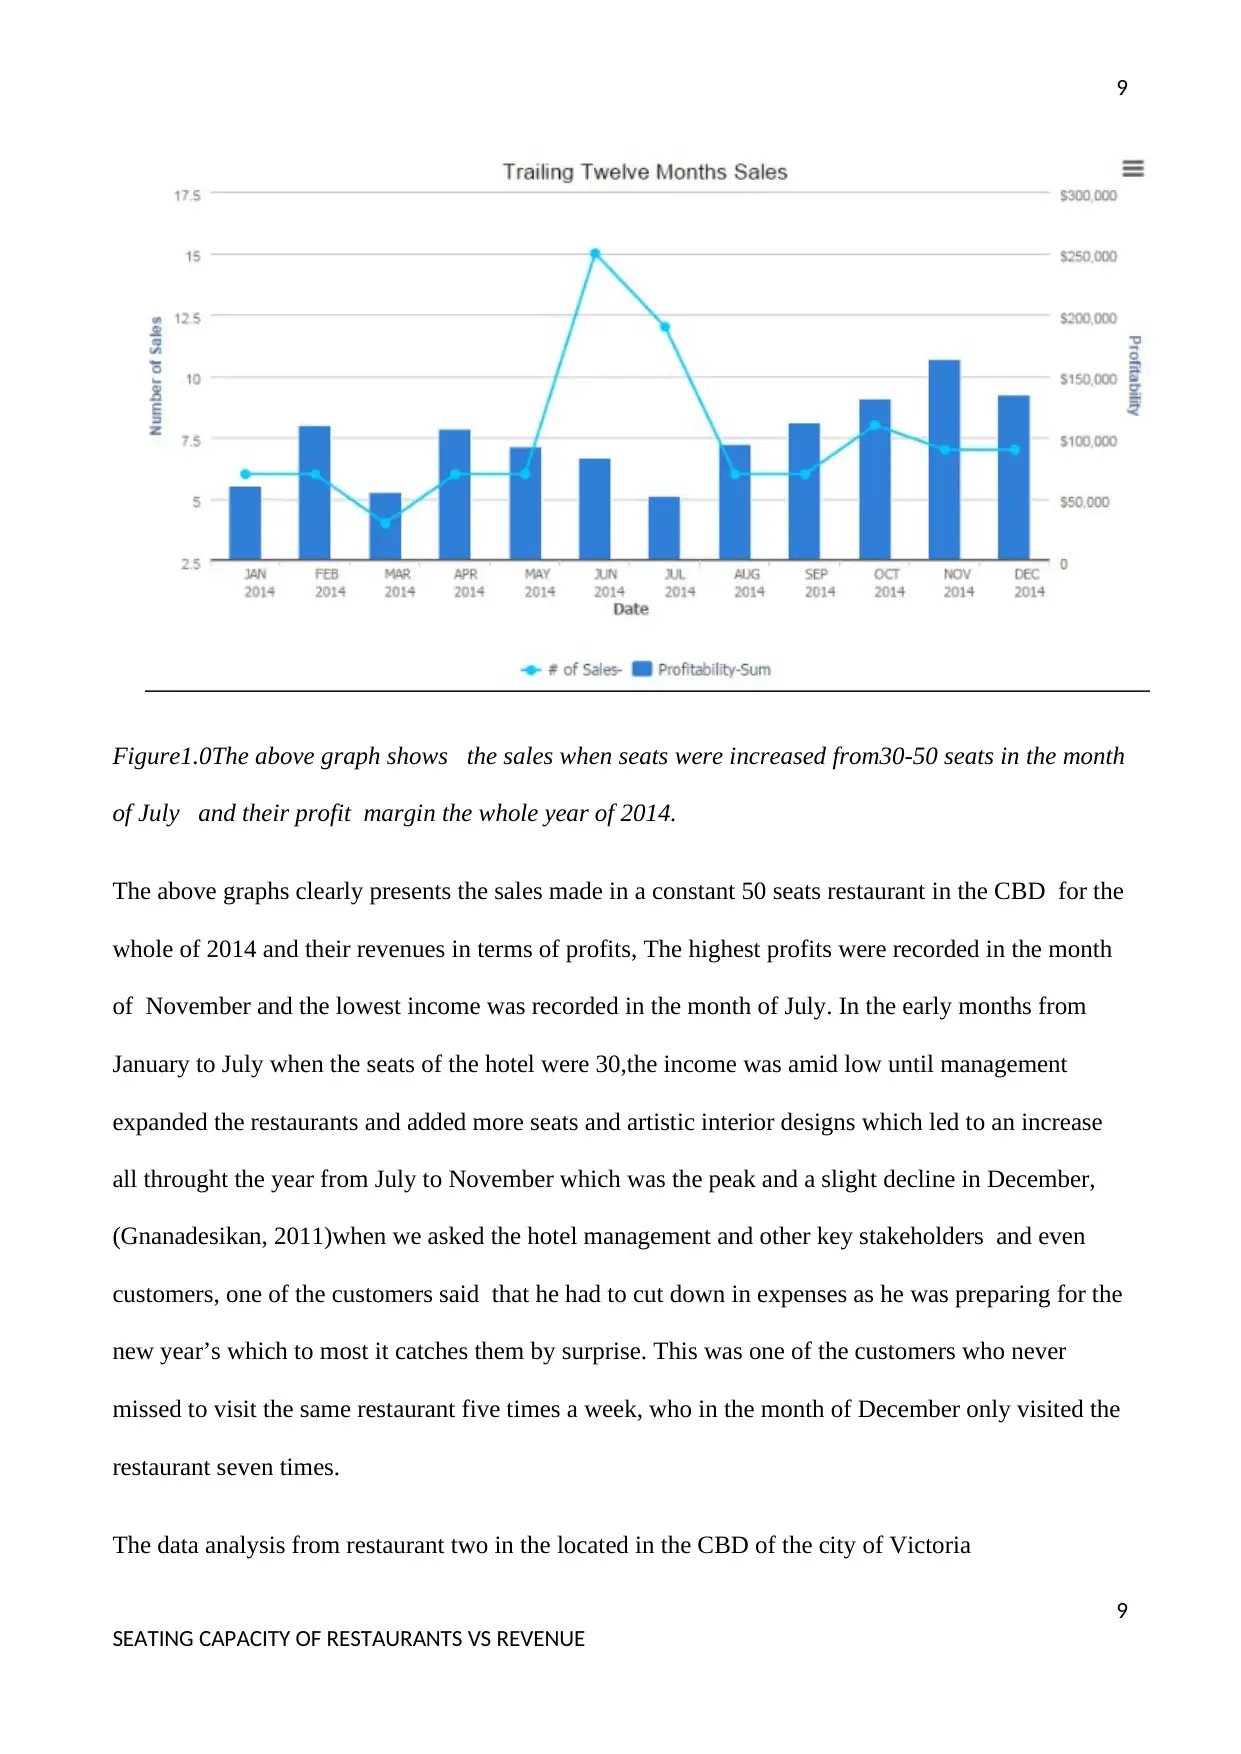
Figure1.0The above graph shows the sales when seats were increased from30-50 seats in the month
of July and their profit margin the whole year of 2014.
The above graphs clearly presents the sales made in a constant 50 seats restaurant in the CBD for the
whole of 2014 and their revenues in terms of profits, The highest profits were recorded in the month
of November and the lowest income was recorded in the month of July. In the early months from
January to July when the seats of the hotel were 30,the income was amid low until management
expanded the restaurants and added more seats and artistic interior designs which led to an increase
all throught the year from July to November which was the peak and a slight decline in December,
(Gnanadesikan, 2011)when we asked the hotel management and other key stakeholders and even
customers, one of the customers said that he had to cut down in expenses as he was preparing for the
new year’s which to most it catches them by surprise. This was one of the customers who never
missed to visit the same restaurant five times a week, who in the month of December only visited the
restaurant seven times.
The data analysis from restaurant two in the located in the CBD of the city of Victoria
9
SEATING CAPACITY OF RESTAURANTS VS REVENUE
Figure1.0The above graph shows the sales when seats were increased from30-50 seats in the month
of July and their profit margin the whole year of 2014.
The above graphs clearly presents the sales made in a constant 50 seats restaurant in the CBD for the
whole of 2014 and their revenues in terms of profits, The highest profits were recorded in the month
of November and the lowest income was recorded in the month of July. In the early months from
January to July when the seats of the hotel were 30,the income was amid low until management
expanded the restaurants and added more seats and artistic interior designs which led to an increase
all throught the year from July to November which was the peak and a slight decline in December,
(Gnanadesikan, 2011)when we asked the hotel management and other key stakeholders and even
customers, one of the customers said that he had to cut down in expenses as he was preparing for the
new year’s which to most it catches them by surprise. This was one of the customers who never
missed to visit the same restaurant five times a week, who in the month of December only visited the
restaurant seven times.
The data analysis from restaurant two in the located in the CBD of the city of Victoria
⊘ This is a preview!⊘
Do you want full access?
Subscribe today to unlock all pages.
Trusted by 1+ million students worldwide
10
10
SEATING CAPACITY OF RESTAURANTS VS REVENUE
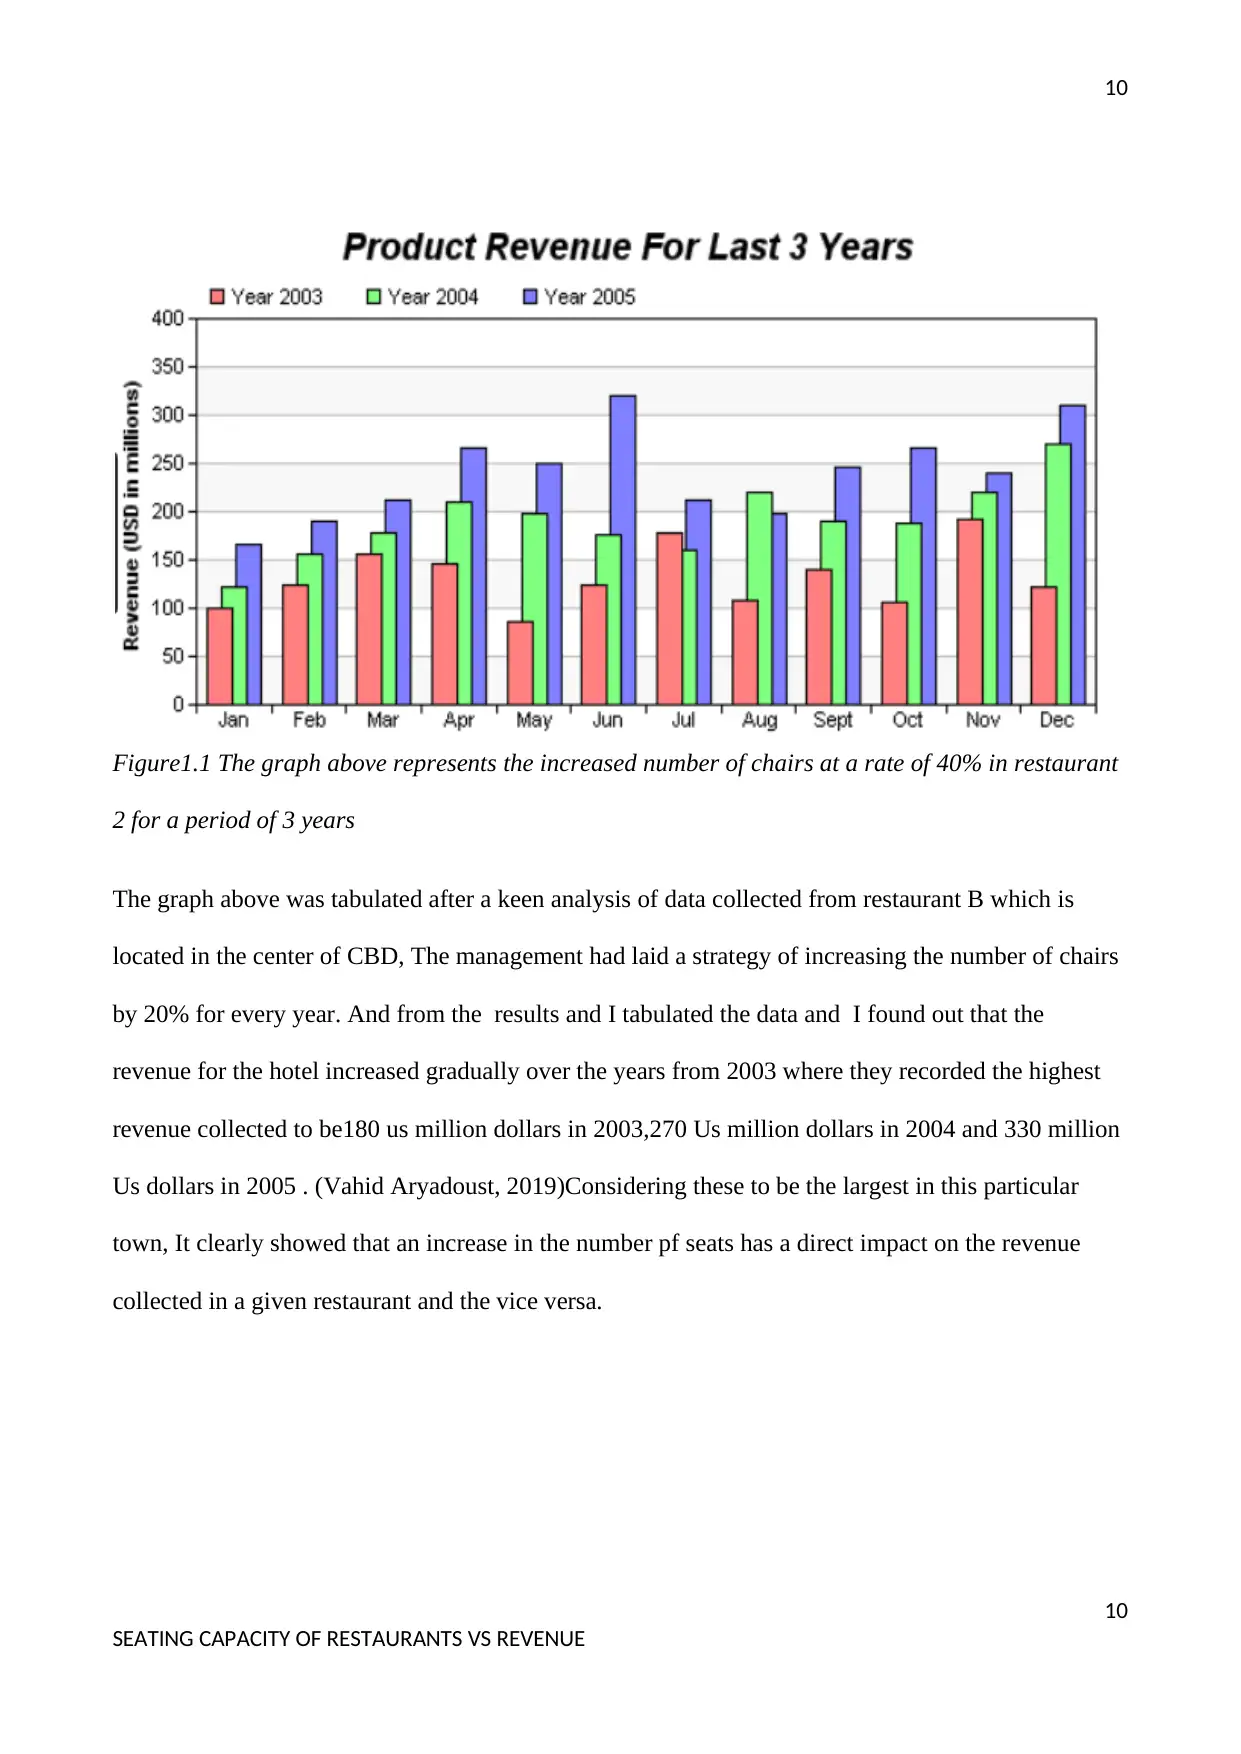
Figure1.1 The graph above represents the increased number of chairs at a rate of 40% in restaurant
2 for a period of 3 years
The graph above was tabulated after a keen analysis of data collected from restaurant B which is
located in the center of CBD, The management had laid a strategy of increasing the number of chairs
by 20% for every year. And from the results and I tabulated the data and I found out that the
revenue for the hotel increased gradually over the years from 2003 where they recorded the highest
revenue collected to be180 us million dollars in 2003,270 Us million dollars in 2004 and 330 million
Us dollars in 2005 . (Vahid Aryadoust, 2019)Considering these to be the largest in this particular
town, It clearly showed that an increase in the number pf seats has a direct impact on the revenue
collected in a given restaurant and the vice versa.
10
SEATING CAPACITY OF RESTAURANTS VS REVENUE
Figure1.1 The graph above represents the increased number of chairs at a rate of 40% in restaurant
2 for a period of 3 years
The graph above was tabulated after a keen analysis of data collected from restaurant B which is
located in the center of CBD, The management had laid a strategy of increasing the number of chairs
by 20% for every year. And from the results and I tabulated the data and I found out that the
revenue for the hotel increased gradually over the years from 2003 where they recorded the highest
revenue collected to be180 us million dollars in 2003,270 Us million dollars in 2004 and 330 million
Us dollars in 2005 . (Vahid Aryadoust, 2019)Considering these to be the largest in this particular
town, It clearly showed that an increase in the number pf seats has a direct impact on the revenue
collected in a given restaurant and the vice versa.
Paraphrase This Document
Need a fresh take? Get an instant paraphrase of this document with our AI Paraphraser
11
11
SEATING CAPACITY OF RESTAURANTS VS REVENUE
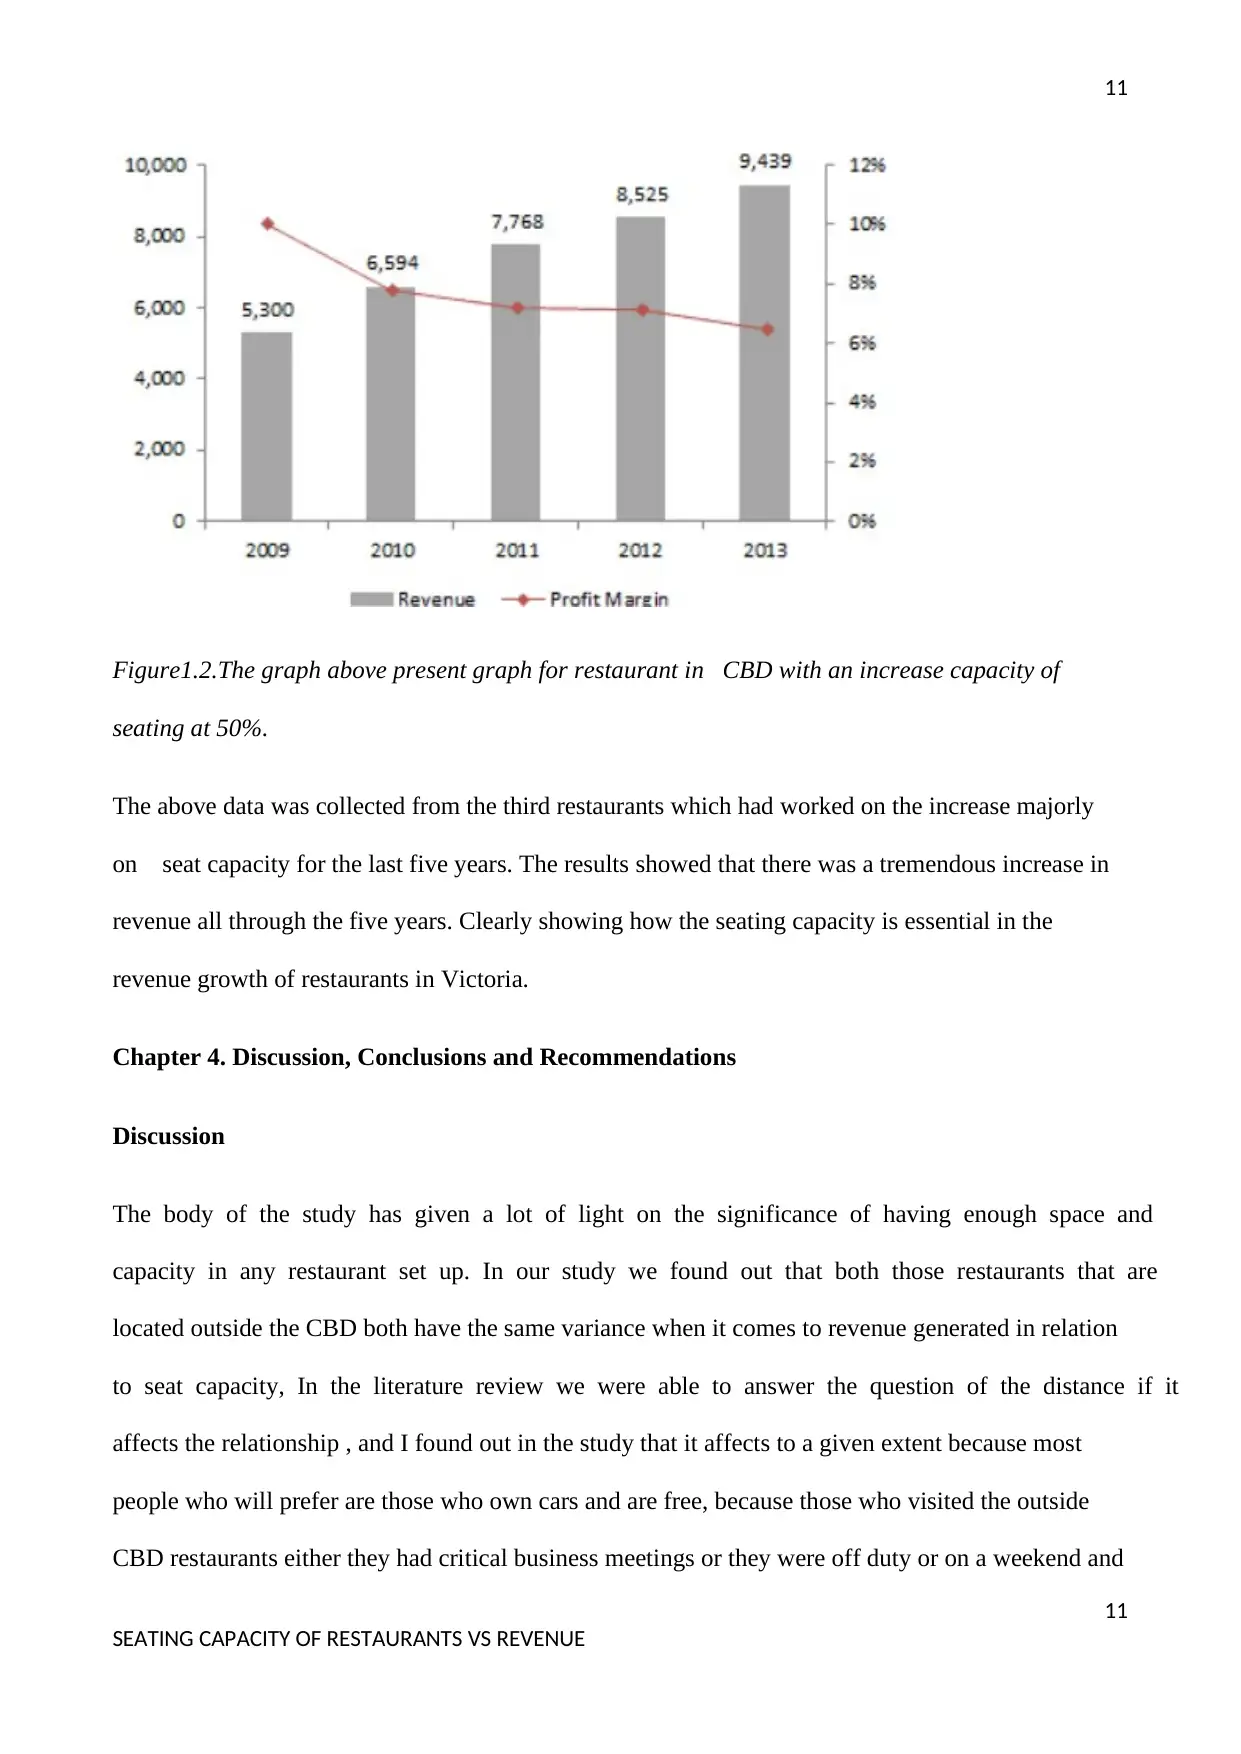
Figure1.2.The graph above present graph for restaurant in CBD with an increase capacity of
seating at 50%.
The above data was collected from the third restaurants which had worked on the increase majorly
on seat capacity for the last five years. The results showed that there was a tremendous increase in
revenue all through the five years. Clearly showing how the seating capacity is essential in the
revenue growth of restaurants in Victoria.
Chapter 4. Discussion, Conclusions and Recommendations
Discussion
The body of the study has given a lot of light on the significance of having enough space and
capacity in any restaurant set up. In our study we found out that both those restaurants that are
located outside the CBD both have the same variance when it comes to revenue generated in relation
to seat capacity, In the literature review we were able to answer the question of the distance if it
affects the relationship , and I found out in the study that it affects to a given extent because most
people who will prefer are those who own cars and are free, because those who visited the outside
CBD restaurants either they had critical business meetings or they were off duty or on a weekend and
11
SEATING CAPACITY OF RESTAURANTS VS REVENUE
Figure1.2.The graph above present graph for restaurant in CBD with an increase capacity of
seating at 50%.
The above data was collected from the third restaurants which had worked on the increase majorly
on seat capacity for the last five years. The results showed that there was a tremendous increase in
revenue all through the five years. Clearly showing how the seating capacity is essential in the
revenue growth of restaurants in Victoria.
Chapter 4. Discussion, Conclusions and Recommendations
Discussion
The body of the study has given a lot of light on the significance of having enough space and
capacity in any restaurant set up. In our study we found out that both those restaurants that are
located outside the CBD both have the same variance when it comes to revenue generated in relation
to seat capacity, In the literature review we were able to answer the question of the distance if it
affects the relationship , and I found out in the study that it affects to a given extent because most
people who will prefer are those who own cars and are free, because those who visited the outside
CBD restaurants either they had critical business meetings or they were off duty or on a weekend and
12
12
SEATING CAPACITY OF RESTAURANTS VS REVENUE
holidays these is the time the city occupancy was full until the need for more seats (Andrews, 2017).
This study will enable restaurant beginners to consider the factor of seat capacity as one of the main
factors that can affect the revenue generated in a given restaurant.Another major significance is that
for the investors who could wish to invest in the service industry such as hotels and restaurants they
should prioritize places with density of people , because this are the customers for the services they
are given and it is made available both for the middle and high class to afford. The statistics’ will
enable many to venture to the service industry and it will enable families to an extra income hence
more revenue will be generated which will finally led to income growth of a city and a country at
large.
4.2 Recommendation
According to the study that has been conducted I can recommend the following:
Service industries should develop both short term and long term strategic plans that they have to
implement in phases, because as the business gains popularity and good loyal customers who are
receive excellent customers will invite more friends and relatives through referrals hence the number
of customers increase with time, So the restaurant or hotel or the particular service provider must
expand both the seating capacity and the number of employees to ensure high quality service for high
revenues.
Location of the service industries e.g the restaurant should be located in accessible places where the
density is high, because in the study I found out that most of the people prefer to go nearby
restaurants which are located near work places , (Costas Katsigris, 2010)while those located off the
CBD receive guests during holidays, this means that the restaurants located in the CBD will receive
a constant revenue throught the year and the incomes despite economic challenges wont vary much.
4.3 Conclusion
⊘ This is a preview!⊘
Do you want full access?
Subscribe today to unlock all pages.
Trusted by 1+ million students worldwide
1 out of 15
Related Documents


Your All-in-One AI-Powered Toolkit for Academic Success.
+13062052269
info@desklib.com
Available 24*7 on WhatsApp / Email
![[object Object]](/_next/static/media/star-bottom.7253800d.svg)
Unlock your academic potential
Copyright © 2020–2026 A2Z Services. All Rights Reserved. Developed and managed by ZUCOL.