Database Analysis and Design for Victoria University Project
VerifiedAdded on 2020/12/30
|30
|2171
|128
Project
AI Summary
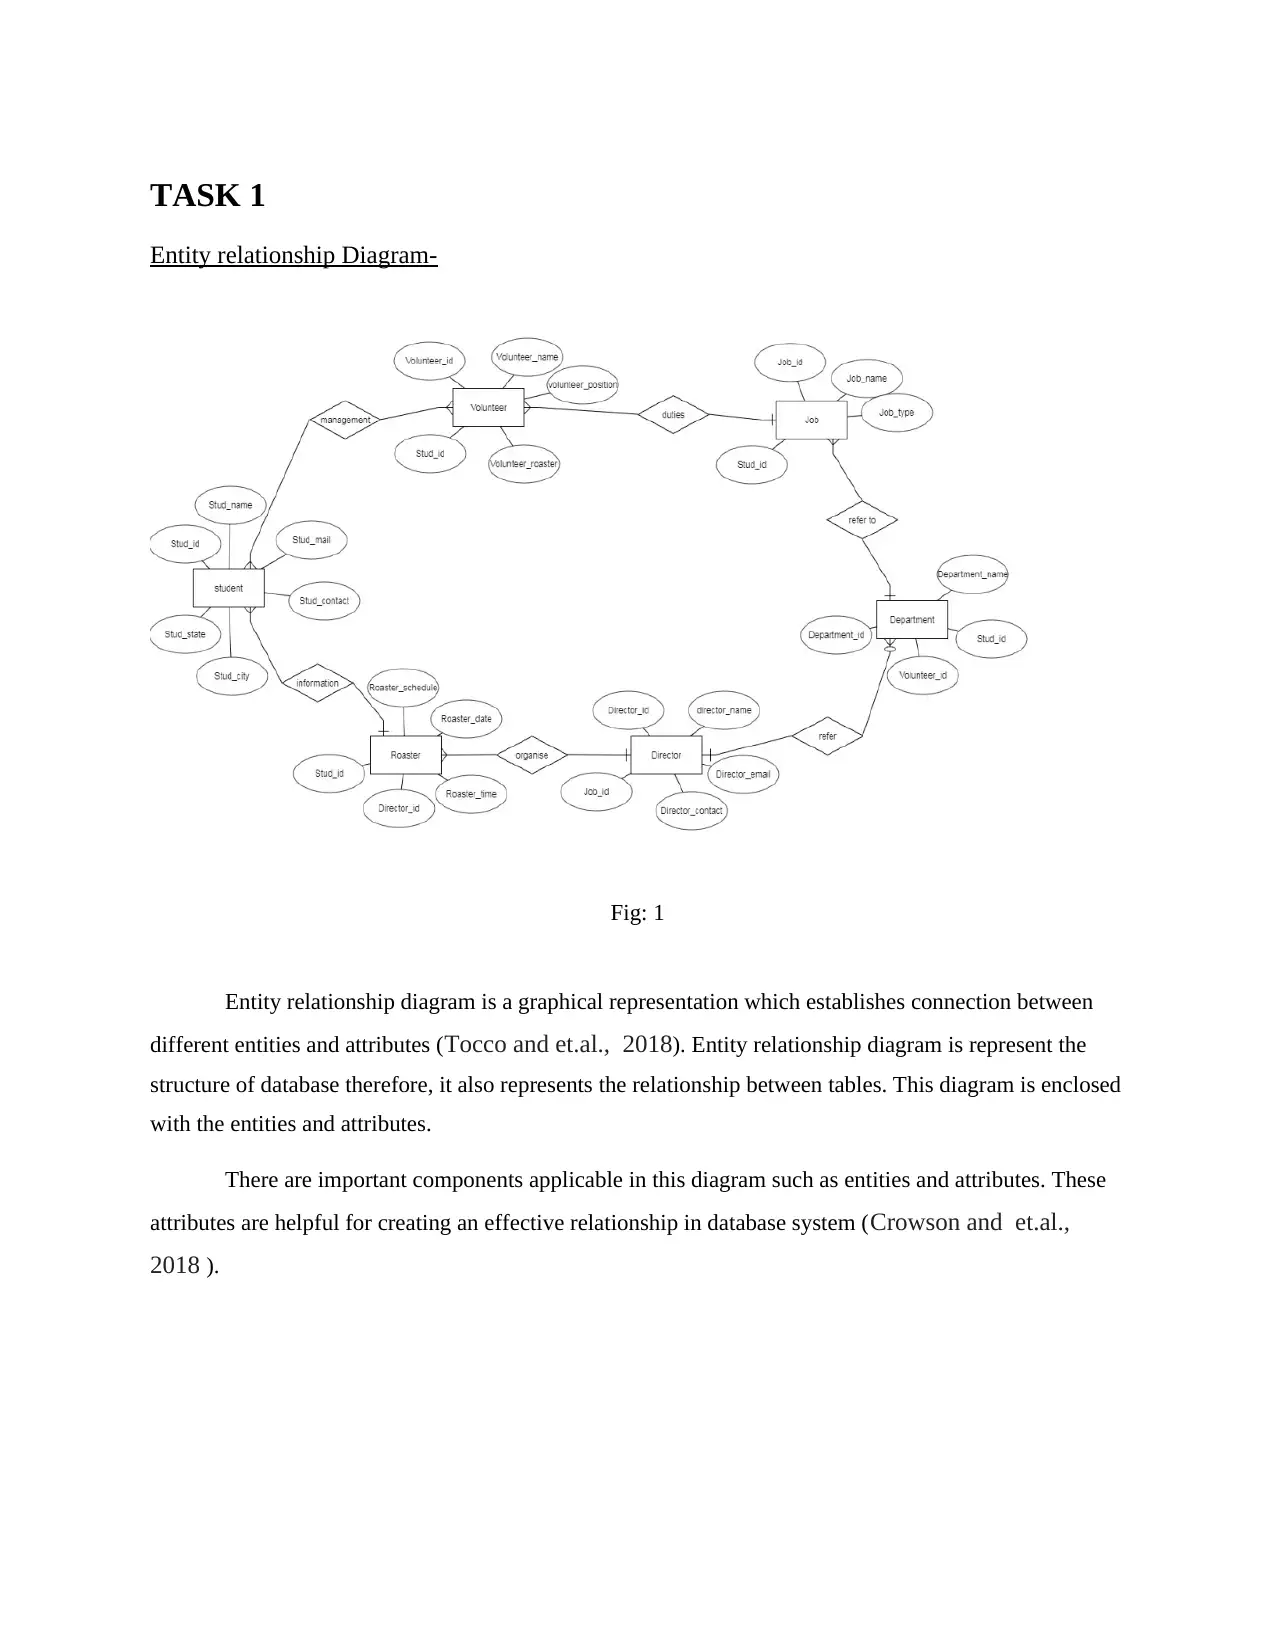
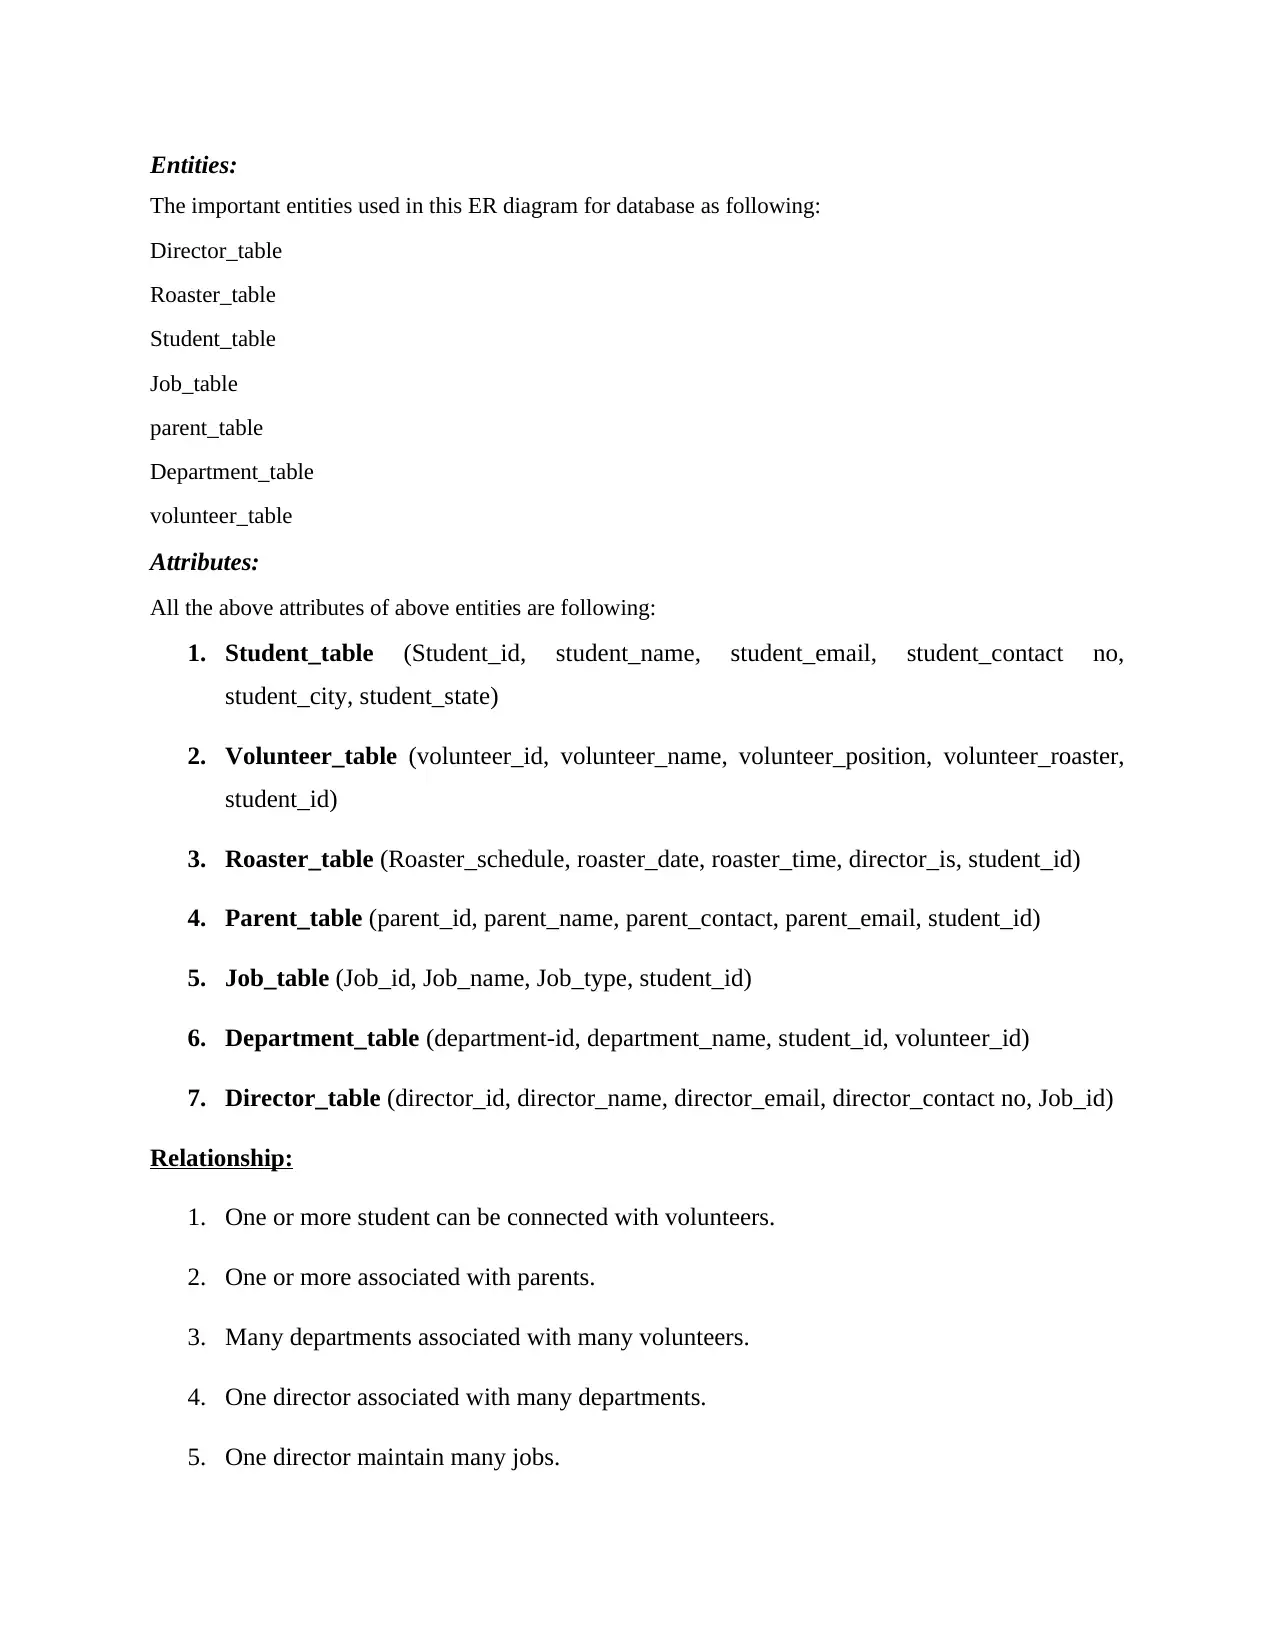
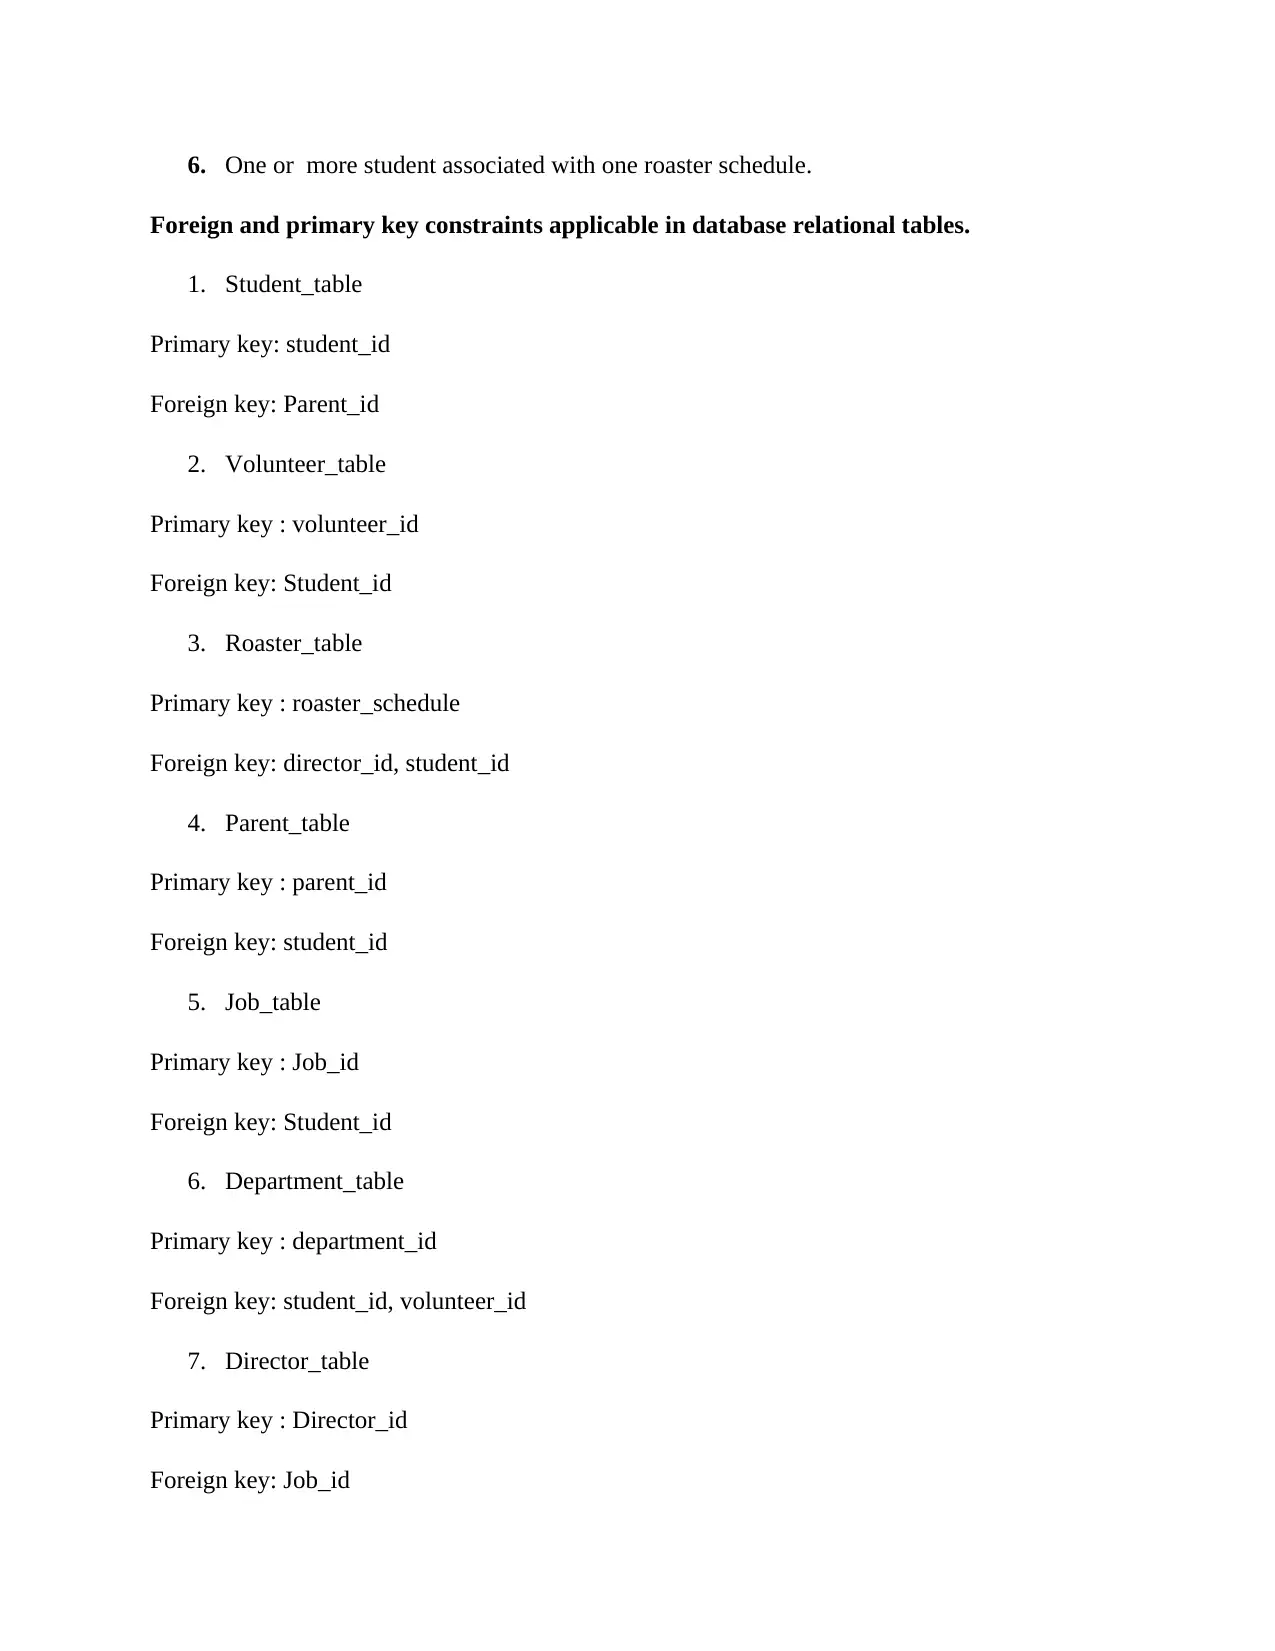
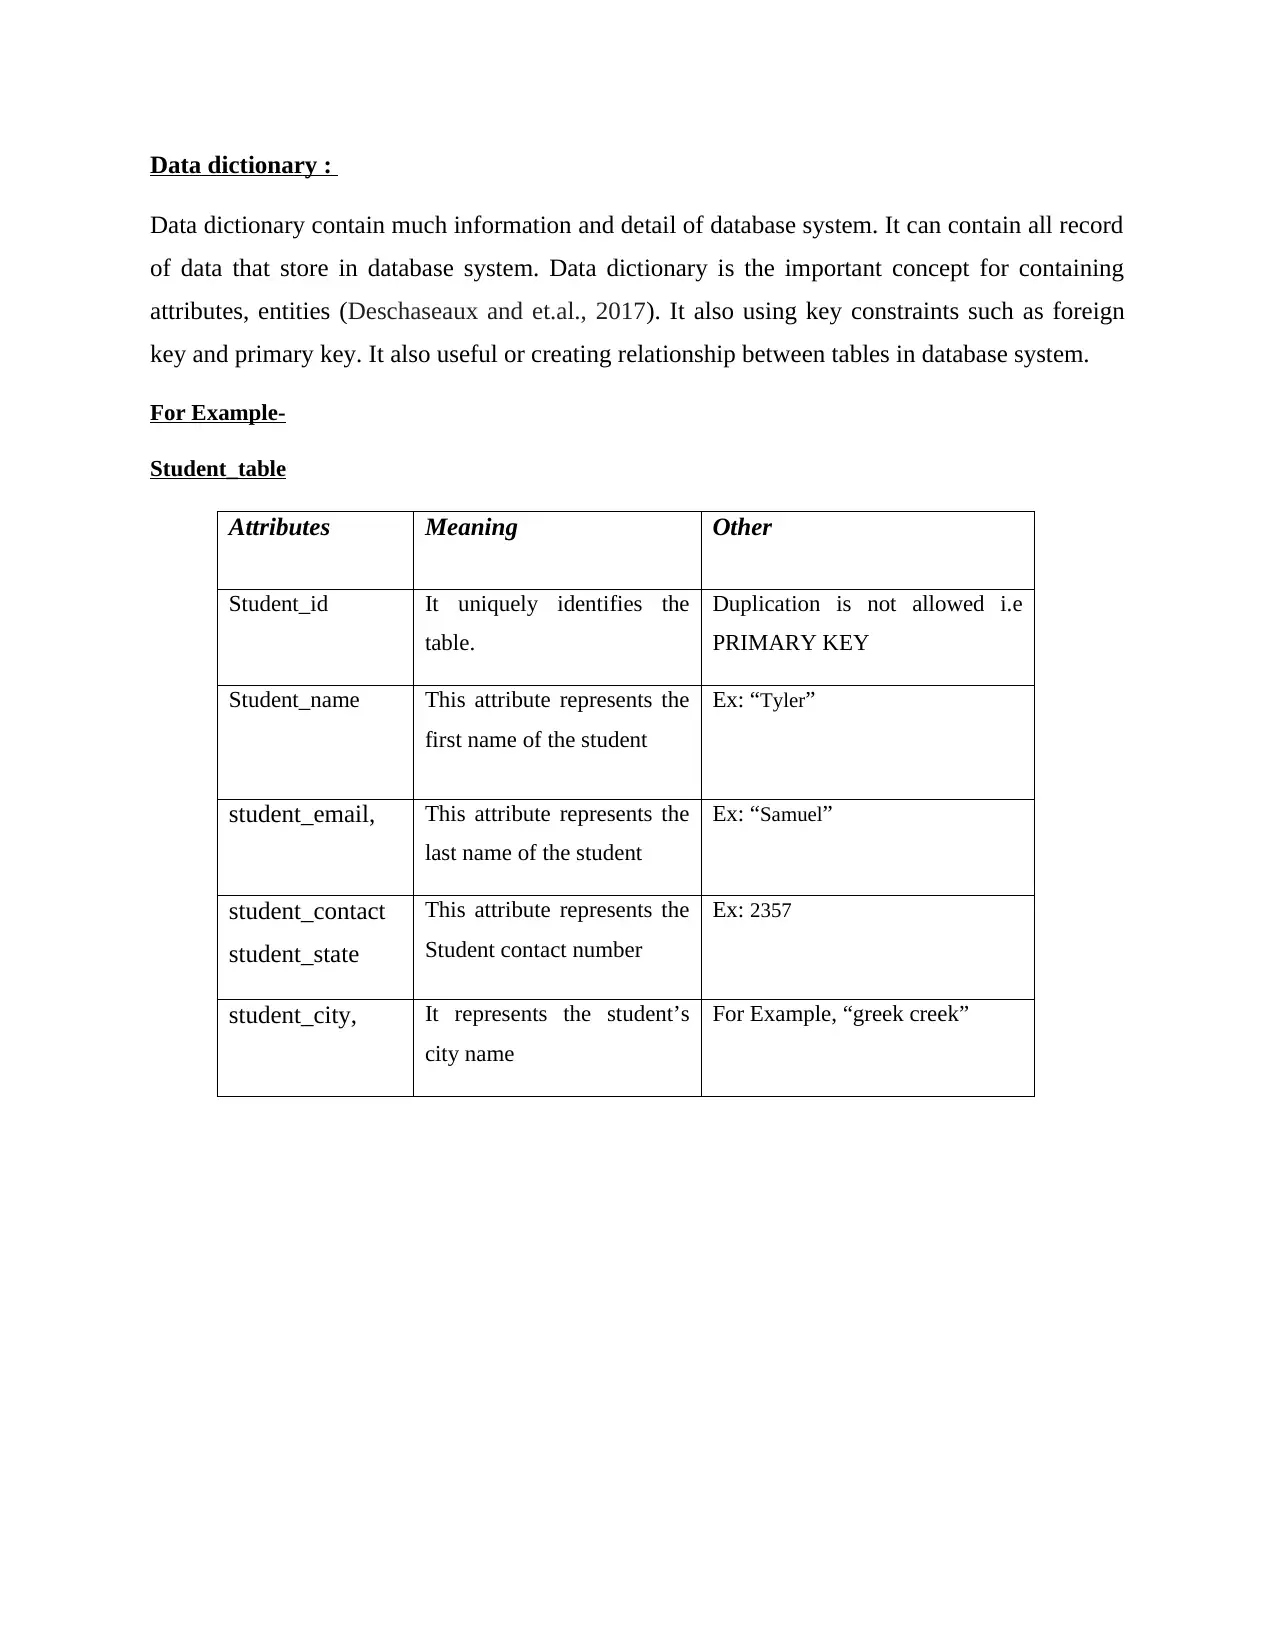
This project focuses on the design and implementation of a relational database for Victoria University. It begins with an introduction to database management systems and their importance, followed by the creation of an Entity Relationship (ER) Diagram to visually represent the database structure, including entities like students, volunteers, and directors, and their attributes and relationships. The project then delves into the implementation of the database, including the creation of a data dictionary to define the database elements and the application of normalization techniques to ensure data integrity and reduce redundancy, specifically up to the Third Normal Form (3NF). Furthermore, the project encompasses the design of database queries, views, and reports. It includes examples of forms for data entry and reports to extract and present information, such as student details and dietary requirements. The project demonstrates how to design forms for directors to manage jobs and volunteer schedules. The conclusion summarizes the key aspects of the database design and its practical applications.

Database Analysis and Design
Paraphrase This Document
Need a fresh take? Get an instant paraphrase of this document with our AI Paraphraser

Table of Contents
INTRODUCTION...........................................................................................................................................3
TASK 1..........................................................................................................................................................3
Entity relationship Diagram-..............................................................................................................3
TASK 2..........................................................................................................................................................8
1. Implement your data dictionary to create a relational database..................................................8
2. The queries, view(s), and report of database relational tables...................................................11
Design Forms and Report..........................................................................................................................13
4. A form for the director to fill in the jobs for the up-coming week with the volunteers available15
5. Report that lists all the people with particular dietary requirements of student information....16
6. A report that prints the students address details........................................................................17
CONCLUSION.............................................................................................................................................18
REFERENCES..............................................................................................................................................19

LIST OF FIGURES
Illustration Index
Illustration 1: figure 1................................................................................................................................10
Illustration 2: Figure:2................................................................................................................................11
Illustration 3: Figure:3................................................................................................................................11
Illustration 4: Figure: 4...............................................................................................................................12
Illustration 5: Figure: 5...............................................................................................................................12
Illustration 6: Figure: 6...............................................................................................................................13
Illustration 7: Figure: 7...............................................................................................................................14
Illustration 8: Figure:8................................................................................................................................14
Illustration 9: Figure :9...............................................................................................................................15
Illustration 10: Figure: 10...........................................................................................................................16
Illustration 11: Figure:11............................................................................................................................16
Illustration 12: Figure:12............................................................................................................................17
Illustration 13: Figure: 13...........................................................................................................................17
Illustration 14: Figure : 14..........................................................................................................................18
Illustration 15: Figure: 15...........................................................................................................................18
Illustration 16: Figure: 16...........................................................................................................................19
Illustration 17: Figure: 17...........................................................................................................................20
Illustration 18: Figure: 18...........................................................................................................................20
Illustration 19: Figure :19...........................................................................................................................21
Illustration 20: Figure :20...........................................................................................................................21
Illustration 21: Figure:21............................................................................................................................22
Illustration 22: Figure :22...........................................................................................................................22
Illustration 23: Figure: 23...........................................................................................................................23
⊘ This is a preview!⊘
Do you want full access?
Subscribe today to unlock all pages.

Trusted by 1+ million students worldwide

INTRODUCTION
Database management system is a technique for managing the business process which
help for identifying the need and requirement of organization this report will describe the
database of Victoria university. A database of Victoria university is been developed and
implemented. It will store and manage data of student and various other facilities provided by
college. Apart from this, information related to upcoming events and activities are also entered in
database (McMinn and et.al., 2017). This database system is designed for student to access the
system for checking all information. It is a type of relational database system that is all
relationship defined in between entities. Database table used in the organization and used third
normal form that is no data dependencies and data redundancy. This system is designed
according to the need and requirement of system.
The website is developed on Word-press and database is created on PHP MyAdmin panel. It
contains all information in the website. This website provides the opportunity for student to fill
the form and update their information. Plugin is used for designing form and it is useful for
designing an effective database system.
Paraphrase This Document
Need a fresh take? Get an instant paraphrase of this document with our AI Paraphraser

TASK 1
Entity relationship Diagram-
Fig: 1
Entity relationship diagram is a graphical representation which establishes connection between
different entities and attributes (Tocco and et.al., 2018). Entity relationship diagram is represent the
structure of database therefore, it also represents the relationship between tables. This diagram is enclosed
with the entities and attributes.
There are important components applicable in this diagram such as entities and attributes. These
attributes are helpful for creating an effective relationship in database system (Crowson and et.al.,
2018 ).

Entities:
The important entities used in this ER diagram for database as following:
Director_table
Roaster_table
Student_table
Job_table
parent_table
Department_table
volunteer_table
Attributes:
All the above attributes of above entities are following:
1. Student_table (Student_id, student_name, student_email, student_contact no,
student_city, student_state)
2. Volunteer_table (volunteer_id, volunteer_name, volunteer_position, volunteer_roaster,
student_id)
3. Roaster_table (Roaster_schedule, roaster_date, roaster_time, director_is, student_id)
4. Parent_table (parent_id, parent_name, parent_contact, parent_email, student_id)
5. Job_table (Job_id, Job_name, Job_type, student_id)
6. Department_table (department-id, department_name, student_id, volunteer_id)
7. Director_table (director_id, director_name, director_email, director_contact no, Job_id)
Relationship:
1. One or more student can be connected with volunteers.
2. One or more associated with parents.
3. Many departments associated with many volunteers.
4. One director associated with many departments.
5. One director maintain many jobs.
⊘ This is a preview!⊘
Do you want full access?
Subscribe today to unlock all pages.

Trusted by 1+ million students worldwide

6. One or more student associated with one roaster schedule.
Foreign and primary key constraints applicable in database relational tables.
1. Student_table
Primary key: student_id
Foreign key: Parent_id
2. Volunteer_table
Primary key : volunteer_id
Foreign key: Student_id
3. Roaster_table
Primary key : roaster_schedule
Foreign key: director_id, student_id
4. Parent_table
Primary key : parent_id
Foreign key: student_id
5. Job_table
Primary key : Job_id
Foreign key: Student_id
6. Department_table
Primary key : department_id
Foreign key: student_id, volunteer_id
7. Director_table
Primary key : Director_id
Foreign key: Job_id
Paraphrase This Document
Need a fresh take? Get an instant paraphrase of this document with our AI Paraphraser

Data dictionary :
Data dictionary contain much information and detail of database system. It can contain all record
of data that store in database system. Data dictionary is the important concept for containing
attributes, entities (Deschaseaux and et.al., 2017). It also using key constraints such as foreign
key and primary key. It also useful or creating relationship between tables in database system.
For Example-
Student_table
Attributes Meaning Other
Student_id It uniquely identifies the
table.
Duplication is not allowed i.e
PRIMARY KEY
Student_name This attribute represents the
first name of the student
Ex: “Tyler”
student_email, This attribute represents the
last name of the student
Ex: “Samuel”
student_contact
student_state
This attribute represents the
Student contact number
Ex: 2357
student_city, It represents the student’s
city name
For Example, “greek creek”

Volunteer table
Attributes Meaning Other
volunteer_id, It uniquely identifies the
table.
Duplication is not allowed i.e PRIMARY
KEY
volunteer_name This attribute represents the
first name of the student
Ex: “Tyler”
volunteer_position This attribute represents the
last name of the student
Ex: “Samuel”
volunteer_roaster, This attribute represents the
Student contact number
Ex: 2357
student_id It represents the student’s
city name
For Example, “greek creek”
⊘ This is a preview!⊘
Do you want full access?
Subscribe today to unlock all pages.

Trusted by 1+ million students worldwide

Department table:
Attributes Meaning Data Type Other
department_id It is the unique
identifier to the
rows.
Int (11) Duplication is not
allowed i.e
PRIMARY KEY
department_name The name of the
department.
Text Ex: “Computer
Science”
Attributes Meaning Data Type Other
department_id It is the unique
identifier to the
rows.
Int (11) Duplication is not
allowed i.e
PRIMARY KEY
department_name The name of the
department.
Text Ex: “Computer
Science”
Paraphrase This Document
Need a fresh take? Get an instant paraphrase of this document with our AI Paraphraser

This table shows different attributes and their specific meaning in database table. It also
identifies the primary key in particular table. Data dictionary is a process for collecting
information and data in proper manner.
Normalization:
Database normalization is a process for reconstructing the relational database in accordance with
the organizational need and requirement. Normal form is useful in order to reduce the data redundancy.
This normalization form is helpful for improving the data integrity. The main objective of normalization
as discuss in followings:
To minimizing the need of reconstructing the different collection of relations while new data are
introduced and increase the life of application programs.
To increase the efficiency of relational database table and more informative to user.
It is free for user to insert the information in database that would be managed by administrator
which control the entire functionality.
Map the Entity Relationship Diagram (ERD) into a set of relations in at least Third Normal Form (3NF).
You should show that each relation satisfies the rules for 1NF, 2NF, and 3NF.
3NF:
Fig: 1

This table show data dependencies and reduce redundancy in database. Student table can reduce into two
tables that is:
1st student table
2nd parents table
Both tables have data dependency and primary key that show as a foreign key.
Fig: 1 shows data 1 normalization form therefore, 1st Normal form contain the unique value in table. They
do not have data dependencies.
1NF: 1st normal form is process that is unique value in table and doesn't have any data
dependencies.
In student table-
All the information contain unique value and cannot match to another attributes.
Each table cell contain single value.
Each record need to be unique.
2NF: this normal form contain single column primary key in database table (Whited and et.al.,
2018).
⊘ This is a preview!⊘
Do you want full access?
Subscribe today to unlock all pages.

Trusted by 1+ million students worldwide
1 out of 30
Related Documents

Your All-in-One AI-Powered Toolkit for Academic Success.
+13062052269
info@desklib.com
Available 24*7 on WhatsApp / Email
Unlock your academic potential
Copyright © 2020–2025 A2Z Services. All Rights Reserved. Developed and managed by ZUCOL.