Analyzing Competitiveness: Beverage Firms Listed on Vietnam Market
VerifiedAdded on 2024/05/03
|5
|3725
|391
Report
AI Summary
This report examines the competitiveness of beverage firms listed on the Vietnam stock market between 2018 and 2022. It uses market share (MS) as the primary indicator and employs descriptive statistics and comparative analysis with Stata software. The study reveals significant differences in competitiveness among firms listed on the Hanoi Stock Exchange (HNX) and the Ho Chi Minh Stock Exchange (HSX). The findings indicate that firms listed on HSX generally have a higher market share. The report also discusses the importance of innovation and strategic development for beverage firms to enhance their competitiveness in a dynamic market influenced by factors such as economic integration and regulatory changes. The research methodology combines qualitative insights from expert interviews with quantitative analysis of panel data collected from reputable financial websites. The study contributes to understanding the competitive landscape of the beverage industry in Vietnam and offers implications for firms seeking to improve their market position.
OPEN ACCESS JOURNALS
Indiana Journal of Economics and Business Management
Abbriviate Tittle- Ind J Econ Bus Manag
ISSN (Online)- 2583-3758
Journal Homepage Link- https://indianapublications.com/journal/IJEBM
DOI: https://doi.org/10.5281/zenodo.10183647
*Corresponding Author: To Thi Thu Trang 10
INDIANA PUBLICATIONS
PRODUCTIVE AND QUALITY RESEARCH
Review Article Volume-03|Issue-062023
Competitiveness of beverage firms listed on the Vietnam stock market
To Thi Thu Trang1*, Vu Huy Tu2, Do Thi Kim Ngan3
1University of Labour and Social Affairs, Vietnam
2Hanoi University of Business and Technology, Vietnam
3Department of Information Technology - General Department of Taxation, Vietnam
Article History
Received: 29.10.2023
Accepted: 21.11.2023
Published: 22.11.2023
Citation
Trang, T. T. T., Tu, V. H., Ngan, D.
T. K. (2023). Competitiveness of
beverage firms listed on the
Vietnam stock market. Indiana
Journal of Economics and Business
Management, 3(6),10-14.
Abstract: In a market economy, competition is a common phenomenon and has important implications for economic
development in countries. The main purpose of this study is to empirically examine the competitiveness index of
beverage firms listed on the Vietnamese stock market. The authors collected secondary data from previous studies
on beverage firms listed on the Vietnamese stock market in the period 2018–2022. For this purpose, in this study,
we use the market share (MS) variable to measure the competitiveness index of beverage firms. We have performed
a number of analyses, such as descriptive statistics and comparisons, with the support of Stata software to evaluate
and measure the competitiveness index of beverage firms listed on the stock market in Vietnam. The results show
that there is a large difference in the competitiveness indicators of beverage firms listed on the Vietnamese stock
market. The difference in competitiveness index between beverage firms listed on HNX and HSX is statistically
significant.
Keywords: competitiveness, beverage firms, business administration, accountant, finance
Copyright © 2023 The Author(s): This is an open-access article distributed under the terms of the Creative Commons Attribution 4.0 International License ( CC BY-NC 4.0).
INTRODUCTION
According to Trung Viet (2023), Vietnam is a
very competitive market, with almost all of the biggest
international names such as Anheuser-Busch InBev,
Carlsberg, and Asahi, as well as locally sourced
businesses such as Sabeco. Habeco continuously
launches new products. According to market research
firm Euromonitor, in 2019, Heineken held nearly 40% of
the market share and Sabeco approximately 34%. Beer
companies such as Habeco, Carslberg, AB-InBev, etc.
own the remaining 26% of the market share. However, in
the two years 2020–2021, Heineken has surpassed
Sabeco to become the beer brand holding the number one
market share in Vietnam with 44.4%. According to
MBS's report, four major companies, Heineken, Sabeco,
Carlsberg, and Habeco, will account for 94.4% of the
market share of Vietnam's beer industry in 2021, of
which Heineken and Sabeco alone have a total market
share of 78.3%, reversing the remaining two companies.
In recent years, firm competitiveness has
always been a top concern for domestic and foreign
research. Because competitiveness is one of the metrics
for comparison between firms in the same industry, it is
closely linked to competitive advantage, or the basic
factor determining the success of a firm (Bredrup, 1995).
Competitiveness is the ability to create,
maintain, use, and create new competitive advantages for
an enterprise to create products with higher productivity
and quality than competitors and gain a larger market
share, as well as create high income for employees and
sustainable development for the organization (Porter,
1990). In the context of international economic
integration, the impact of the COVID-19 epidemic and
legal documents on business—drinking beer and wine—
has decreased. With the strict implementation of Decree
100 by the government, the total demand for beer
consumption has decreased. This also requires firms
themselves to constantly innovate, perfect, and develop,
including solutions to improve competitiveness.
THEORETICAL BACKGROUND
AND LITERATURE REVIEW
In addition to profit goals, competitiveness is
also the ability to achieve sustainable development goals
expressed through products provided to the market,
production costs, and added value (Porter, 2009a).
The competitiveness of enterprises is mentioned
in this study according to the opinion of Vu (2006).
Competitiveness is the ability of enterprises to find and
develop market share to gain more profits or
Competitiveness is understood as the ability of a firm to
provide more products and earn higher profits than other
firms.
According to Porter (1998), enterprise
competitiveness is the synthesis of the ability to hold and
dominate the market of entities participating in
production and business activities to achieve optimal
efficiency in a specific business environment. The
competitiveness of a beverage firm is the synthesis of all
the enterprise's abilities to meet customer needs in
Paraphrase This Document
Need a fresh take? Get an instant paraphrase of this document with our AI Paraphraser
Trang, T. T. T., Tu, V. H., Ngan, D. T. K.; Ind J Econ Bus Manag; Vol-3, Iss-6 (Nov-Dec, 2023): 10-14
*Corresponding Author: To Thi Thu Trang 11
providing products. Beverage firms that want to enhance
their competitiveness in addition to providing high-
quality, diverse, and rich services also need to pay
attention to convenience and uniqueness compared to
other products. similar services on the market. From
there, creating a competitive advantage, increasing the
annual profits of banks, creating prestige, brand, and high
position in the market, and being able to withstand and
overcome adverse fluctuations of the business
environment.
Currently, there are many different views on
measuring and determining criteria for measuring the
competitiveness of enterprises, such as Porter (1990)
using the ability to maintain competitive advantages of
enterprises (costs low and product differentiation);
Wangwe (1995) used technical efficiency and
productivity indicators; Cockburn et al. (2000) uses
financial efficiency (profit); and Salinger (2001) uses
labor productivity and human capital capacity. Pham
(2017) pointed out that market share is an indicator to
measure the competitiveness of enterprises. An
enterprise has greater competitiveness than another
enterprise when that enterprise has a larger market share.
Market share indicators are often measured by
comparing a firm's revenue with the total revenue of
firms in the same industry in the market in a certain
period. The calculation formula is as follows:
Market share (MS) =
Ri
R
MS: Market share
Ri: Revenue of the i enterprise,
R: Total revenue of firms in the same industry in the
market and listed on the Vietnam stock market.
METHODOLOGY
This study uses both qualitative research
methods and quantitative research methods.
Qualitative research method: We use techniques
of synthesis, analysis, comparison, and contrast to
evaluate the competitiveness index of beverage firms
listed on the Vietnam stock market. In addition to
collecting previous research works, we interviewed five
experts who are leading lecturers in business
administration: directors of beverage enterprises.
Qualitative research methods guide and refine the
research results of previous studies. From there, this
research inherits and applies. Regarding how to measure
the competitiveness of enterprises, all 5/5 experts (100%)
agree with the measurement method proposed by us.
Thus, the way to measure enterprise competitiveness
remains unchanged, according to our proposal.
The quantitative research method is based on
panel data, which has been compiled for 5 years, from
2018 to 2022. Based on reputable websites such as
http://cafef.vn, https://financevietstock.vn, etc. and a
global data service company, we collect data on
competitiveness indicators of beverage firms, which are
firms that produce and trade alcohol and beer.
Enterprises that do not produce alcohol or beer are not
included in the research sample.
The research sample is 7 beverage businesses
listed on the Vietnamese stock market, including Hanoi
Stock Exchange (HNX) and Ho Chi Minh Stock
Exchange (HSX) (cophieu68.vn), with 1
competitiveness target in 5 years. We collected 35
observations. We then evaluated and analyzed with the
support of Stata 13 software.
RESEARCH RESULTS
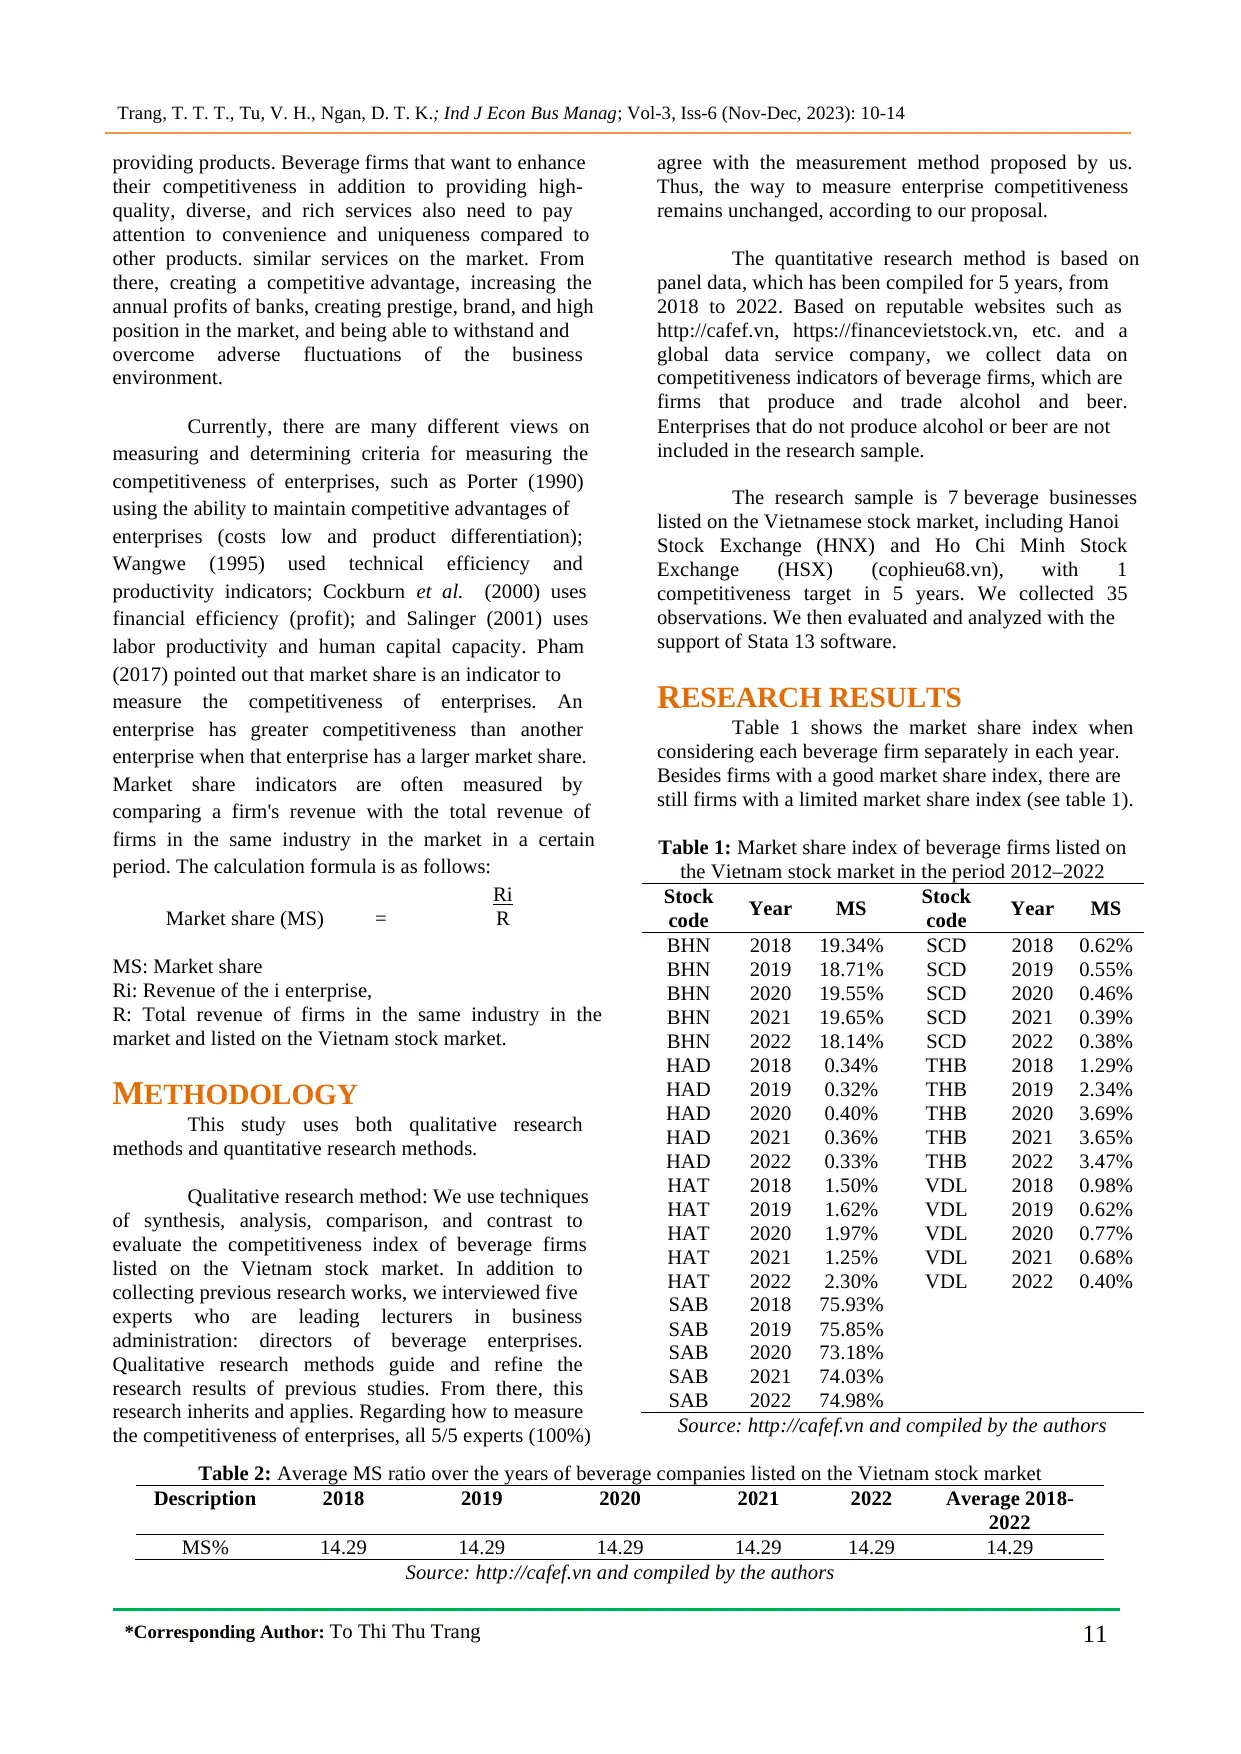
Table 1 shows the market share index when
considering each beverage firm separately in each year.
Besides firms with a good market share index, there are
still firms with a limited market share index (see table 1).
Table 1: Market share index of beverage firms listed on
the Vietnam stock market in the period 2012–2022
Stock
code Year MS Stock
code Year MS
BHN 2018 19.34% SCD 2018 0.62%
BHN 2019 18.71% SCD 2019 0.55%
BHN 2020 19.55% SCD 2020 0.46%
BHN 2021 19.65% SCD 2021 0.39%
BHN 2022 18.14% SCD 2022 0.38%
HAD 2018 0.34% THB 2018 1.29%
HAD 2019 0.32% THB 2019 2.34%
HAD 2020 0.40% THB 2020 3.69%
HAD 2021 0.36% THB 2021 3.65%
HAD 2022 0.33% THB 2022 3.47%
HAT 2018 1.50% VDL 2018 0.98%
HAT 2019 1.62% VDL 2019 0.62%
HAT 2020 1.97% VDL 2020 0.77%
HAT 2021 1.25% VDL 2021 0.68%
HAT 2022 2.30% VDL 2022 0.40%
SAB 2018 75.93%
SAB 2019 75.85%
SAB 2020 73.18%
SAB 2021 74.03%
SAB 2022 74.98%
Source: http://cafef.vn and compiled by the authors
Table 2: Average MS ratio over the years of beverage companies listed on the Vietnam stock market
Description 2018 2019 2020 2021 2022 Average 2018-
2022
MS% 14.29 14.29 14.29 14.29 14.29 14.29
Source: http://cafef.vn and compiled by the authors
*Corresponding Author: To Thi Thu Trang 11
providing products. Beverage firms that want to enhance
their competitiveness in addition to providing high-
quality, diverse, and rich services also need to pay
attention to convenience and uniqueness compared to
other products. similar services on the market. From
there, creating a competitive advantage, increasing the
annual profits of banks, creating prestige, brand, and high
position in the market, and being able to withstand and
overcome adverse fluctuations of the business
environment.
Currently, there are many different views on
measuring and determining criteria for measuring the
competitiveness of enterprises, such as Porter (1990)
using the ability to maintain competitive advantages of
enterprises (costs low and product differentiation);
Wangwe (1995) used technical efficiency and
productivity indicators; Cockburn et al. (2000) uses
financial efficiency (profit); and Salinger (2001) uses
labor productivity and human capital capacity. Pham
(2017) pointed out that market share is an indicator to
measure the competitiveness of enterprises. An
enterprise has greater competitiveness than another
enterprise when that enterprise has a larger market share.
Market share indicators are often measured by
comparing a firm's revenue with the total revenue of
firms in the same industry in the market in a certain
period. The calculation formula is as follows:
Market share (MS) =
Ri
R
MS: Market share
Ri: Revenue of the i enterprise,
R: Total revenue of firms in the same industry in the
market and listed on the Vietnam stock market.
METHODOLOGY
This study uses both qualitative research
methods and quantitative research methods.
Qualitative research method: We use techniques
of synthesis, analysis, comparison, and contrast to
evaluate the competitiveness index of beverage firms
listed on the Vietnam stock market. In addition to
collecting previous research works, we interviewed five
experts who are leading lecturers in business
administration: directors of beverage enterprises.
Qualitative research methods guide and refine the
research results of previous studies. From there, this
research inherits and applies. Regarding how to measure
the competitiveness of enterprises, all 5/5 experts (100%)
agree with the measurement method proposed by us.
Thus, the way to measure enterprise competitiveness
remains unchanged, according to our proposal.
The quantitative research method is based on
panel data, which has been compiled for 5 years, from
2018 to 2022. Based on reputable websites such as
http://cafef.vn, https://financevietstock.vn, etc. and a
global data service company, we collect data on
competitiveness indicators of beverage firms, which are
firms that produce and trade alcohol and beer.
Enterprises that do not produce alcohol or beer are not
included in the research sample.
The research sample is 7 beverage businesses
listed on the Vietnamese stock market, including Hanoi
Stock Exchange (HNX) and Ho Chi Minh Stock
Exchange (HSX) (cophieu68.vn), with 1
competitiveness target in 5 years. We collected 35
observations. We then evaluated and analyzed with the
support of Stata 13 software.
RESEARCH RESULTS
Table 1 shows the market share index when
considering each beverage firm separately in each year.
Besides firms with a good market share index, there are
still firms with a limited market share index (see table 1).
Table 1: Market share index of beverage firms listed on
the Vietnam stock market in the period 2012–2022
Stock
code Year MS Stock
code Year MS
BHN 2018 19.34% SCD 2018 0.62%
BHN 2019 18.71% SCD 2019 0.55%
BHN 2020 19.55% SCD 2020 0.46%
BHN 2021 19.65% SCD 2021 0.39%
BHN 2022 18.14% SCD 2022 0.38%
HAD 2018 0.34% THB 2018 1.29%
HAD 2019 0.32% THB 2019 2.34%
HAD 2020 0.40% THB 2020 3.69%
HAD 2021 0.36% THB 2021 3.65%
HAD 2022 0.33% THB 2022 3.47%
HAT 2018 1.50% VDL 2018 0.98%
HAT 2019 1.62% VDL 2019 0.62%
HAT 2020 1.97% VDL 2020 0.77%
HAT 2021 1.25% VDL 2021 0.68%
HAT 2022 2.30% VDL 2022 0.40%
SAB 2018 75.93%
SAB 2019 75.85%
SAB 2020 73.18%
SAB 2021 74.03%
SAB 2022 74.98%
Source: http://cafef.vn and compiled by the authors
Table 2: Average MS ratio over the years of beverage companies listed on the Vietnam stock market
Description 2018 2019 2020 2021 2022 Average 2018-
2022
MS% 14.29 14.29 14.29 14.29 14.29 14.29
Source: http://cafef.vn and compiled by the authors
Trang, T. T. T., Tu, V. H., Ngan, D. T. K.; Ind J Econ Bus Manag; Vol-3, Iss-6 (Nov-Dec, 2023): 10-14
*Corresponding Author: To Thi Thu Trang 12
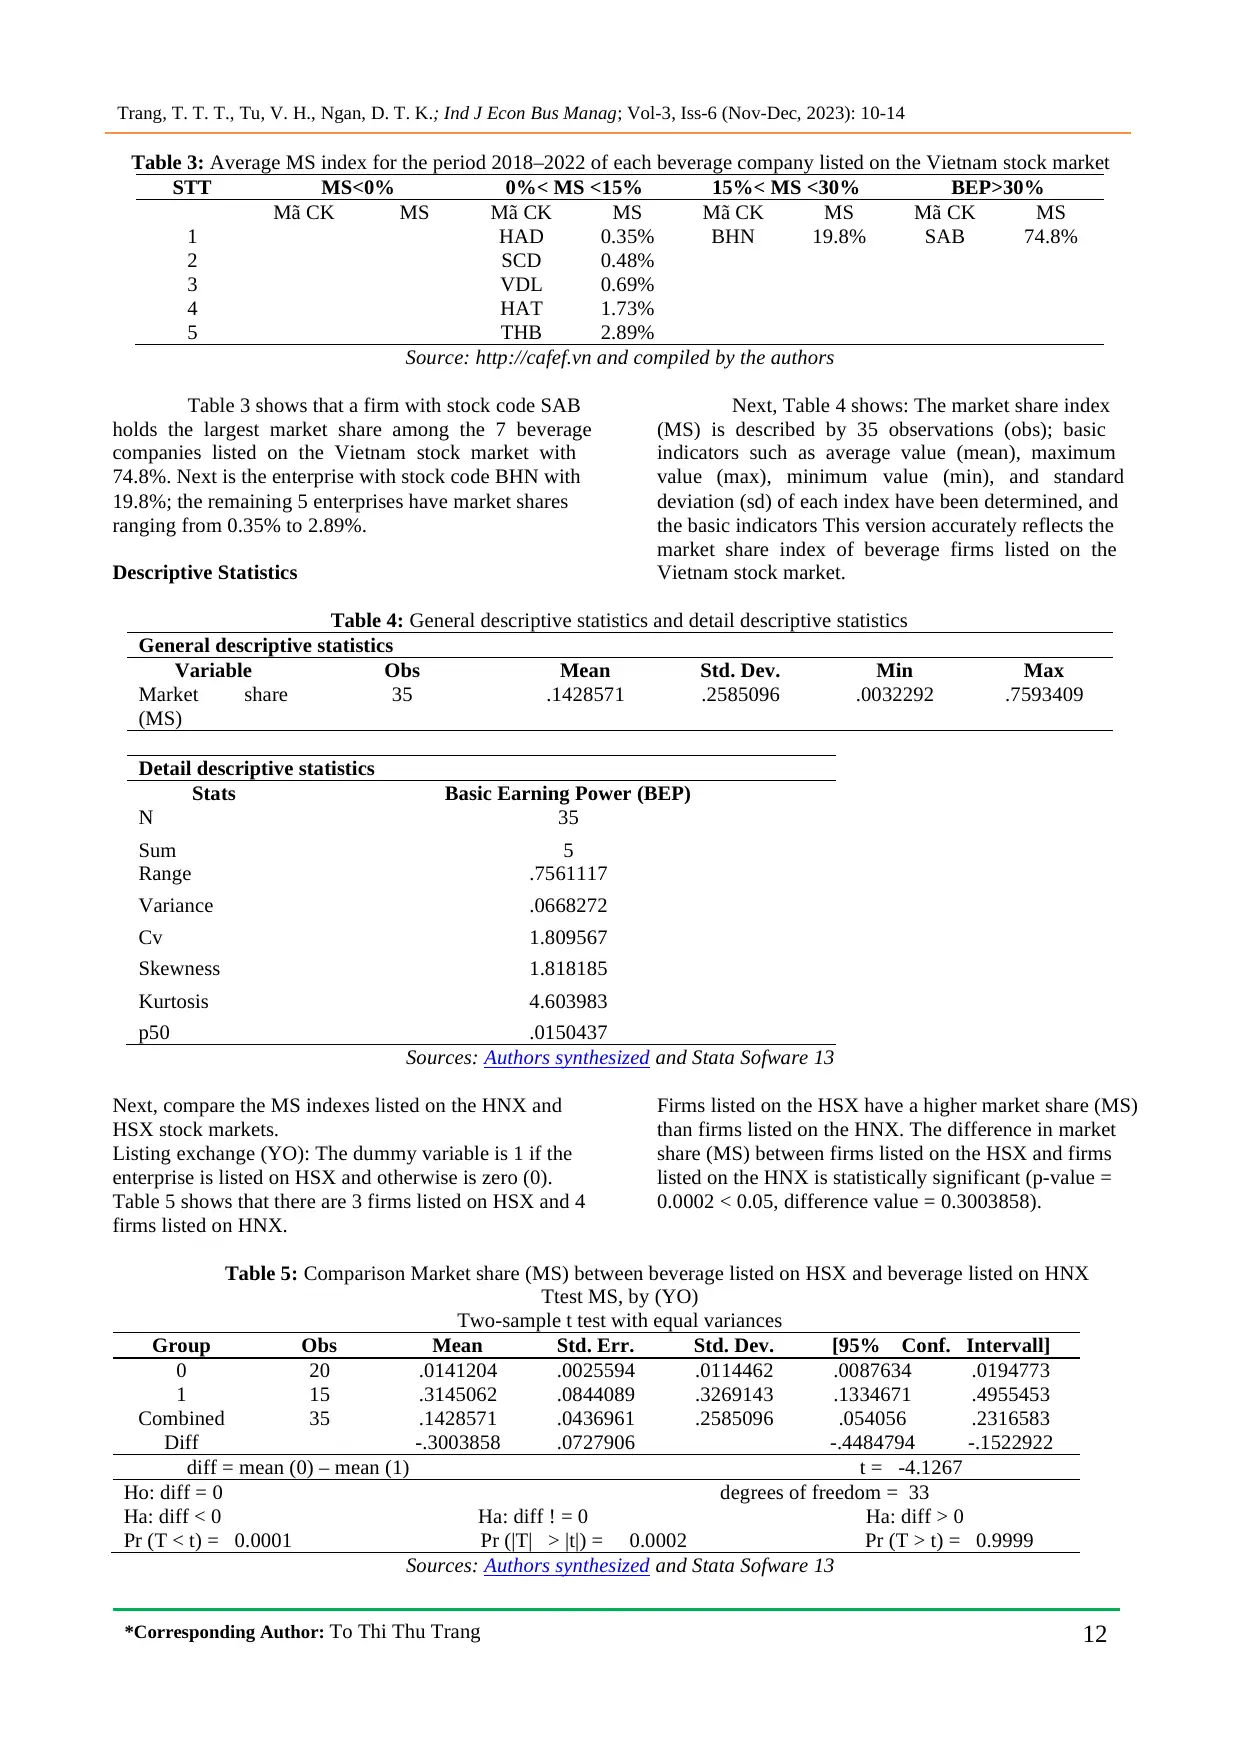
Table 3: Average MS index for the period 2018–2022 of each beverage company listed on the Vietnam stock market
STT MS<0% 0%< MS <15% 15%< MS <30% BEP>30%
Mã CK MS Mã CK MS Mã CK MS Mã CK MS
1 HAD 0.35% BHN 19.8% SAB 74.8%
2 SCD 0.48%
3 VDL 0.69%
4 HAT 1.73%
5 THB 2.89%
Source: http://cafef.vn and compiled by the authors
Table 3 shows that a firm with stock code SAB
holds the largest market share among the 7 beverage
companies listed on the Vietnam stock market with
74.8%. Next is the enterprise with stock code BHN with
19.8%; the remaining 5 enterprises have market shares
ranging from 0.35% to 2.89%.
Descriptive Statistics
Next, Table 4 shows: The market share index
(MS) is described by 35 observations (obs); basic
indicators such as average value (mean), maximum
value (max), minimum value (min), and standard
deviation (sd) of each index have been determined, and
the basic indicators This version accurately reflects the
market share index of beverage firms listed on the
Vietnam stock market.
Table 4: General descriptive statistics and detail descriptive statistics
General descriptive statistics
Variable Obs Mean Std. Dev. Min Max
Market share
(MS)
35 .1428571 .2585096 .0032292 .7593409
Detail descriptive statistics
Stats Basic Earning Power (BEP)
N 35
Sum 5
Range .7561117
Variance .0668272
Cv 1.809567
Skewness 1.818185
Kurtosis 4.603983
p50 .0150437
Sources: Authors synthesized and Stata Sofware 13
Next, compare the MS indexes listed on the HNX and
HSX stock markets.
Listing exchange (YO): The dummy variable is 1 if the
enterprise is listed on HSX and otherwise is zero (0).
Table 5 shows that there are 3 firms listed on HSX and 4
firms listed on HNX.
Firms listed on the HSX have a higher market share (MS)
than firms listed on the HNX. The difference in market
share (MS) between firms listed on the HSX and firms
listed on the HNX is statistically significant (p-value =
0.0002 < 0.05, difference value = 0.3003858).
Table 5: Comparison Market share (MS) between beverage listed on HSX and beverage listed on HNX
Ttest MS, by (YO)
Two-sample t test with equal variances
Group Obs Mean Std. Err. Std. Dev. [95% Conf. Intervall]
0 20 .0141204 .0025594 .0114462 .0087634 .0194773
1 15 .3145062 .0844089 .3269143 .1334671 .4955453
Combined 35 .1428571 .0436961 .2585096 .054056 .2316583
Diff -.3003858 .0727906 -.4484794 -.1522922
diff = mean (0) – mean (1) t = -4.1267
Ho: diff = 0 degrees of freedom = 33
Ha: diff < 0 Ha: diff ! = 0 Ha: diff > 0
Pr (T < t) = 0.0001 Pr (|T| > |t|) = 0.0002 Pr (T > t) = 0.9999
Sources: Authors synthesized and Stata Sofware 13
*Corresponding Author: To Thi Thu Trang 12
Table 3: Average MS index for the period 2018–2022 of each beverage company listed on the Vietnam stock market
STT MS<0% 0%< MS <15% 15%< MS <30% BEP>30%
Mã CK MS Mã CK MS Mã CK MS Mã CK MS
1 HAD 0.35% BHN 19.8% SAB 74.8%
2 SCD 0.48%
3 VDL 0.69%
4 HAT 1.73%
5 THB 2.89%
Source: http://cafef.vn and compiled by the authors
Table 3 shows that a firm with stock code SAB
holds the largest market share among the 7 beverage
companies listed on the Vietnam stock market with
74.8%. Next is the enterprise with stock code BHN with
19.8%; the remaining 5 enterprises have market shares
ranging from 0.35% to 2.89%.
Descriptive Statistics
Next, Table 4 shows: The market share index
(MS) is described by 35 observations (obs); basic
indicators such as average value (mean), maximum
value (max), minimum value (min), and standard
deviation (sd) of each index have been determined, and
the basic indicators This version accurately reflects the
market share index of beverage firms listed on the
Vietnam stock market.
Table 4: General descriptive statistics and detail descriptive statistics
General descriptive statistics
Variable Obs Mean Std. Dev. Min Max
Market share
(MS)
35 .1428571 .2585096 .0032292 .7593409
Detail descriptive statistics
Stats Basic Earning Power (BEP)
N 35
Sum 5
Range .7561117
Variance .0668272
Cv 1.809567
Skewness 1.818185
Kurtosis 4.603983
p50 .0150437
Sources: Authors synthesized and Stata Sofware 13
Next, compare the MS indexes listed on the HNX and
HSX stock markets.
Listing exchange (YO): The dummy variable is 1 if the
enterprise is listed on HSX and otherwise is zero (0).
Table 5 shows that there are 3 firms listed on HSX and 4
firms listed on HNX.
Firms listed on the HSX have a higher market share (MS)
than firms listed on the HNX. The difference in market
share (MS) between firms listed on the HSX and firms
listed on the HNX is statistically significant (p-value =
0.0002 < 0.05, difference value = 0.3003858).
Table 5: Comparison Market share (MS) between beverage listed on HSX and beverage listed on HNX
Ttest MS, by (YO)
Two-sample t test with equal variances
Group Obs Mean Std. Err. Std. Dev. [95% Conf. Intervall]
0 20 .0141204 .0025594 .0114462 .0087634 .0194773
1 15 .3145062 .0844089 .3269143 .1334671 .4955453
Combined 35 .1428571 .0436961 .2585096 .054056 .2316583
Diff -.3003858 .0727906 -.4484794 -.1522922
diff = mean (0) – mean (1) t = -4.1267
Ho: diff = 0 degrees of freedom = 33
Ha: diff < 0 Ha: diff ! = 0 Ha: diff > 0
Pr (T < t) = 0.0001 Pr (|T| > |t|) = 0.0002 Pr (T > t) = 0.9999
Sources: Authors synthesized and Stata Sofware 13
⊘ This is a preview!⊘
Do you want full access?
Subscribe today to unlock all pages.
Trusted by 1+ million students worldwide
Trang, T. T. T., Tu, V. H., Ngan, D. T. K.; Ind J Econ Bus Manag; Vol-3, Iss-6 (Nov-Dec, 2023): 10-14
*Corresponding Author: To Thi Thu Trang 13
DISCUSSION AND
IMPLICATIONS
Operational competitiveness, including
indicators such as productivity, financial market share,
differentiation, profitability, price, cost, product
diversity, efficiency, value creation, and responsiveness,
requires customers to develop new products.
Competitiveness and measurement of a business's
competitiveness are associated with three groups of
factors: operational capabilities, assets' ability to
generate output, and management processes.
Vietnam is one of the largest beer markets in the
region and the world. According to the Vietnam Beer,
Alcohol, and Beverage Association (VBA), each year the
market consumes more than four billion liters of beer.
Total beer market revenue in 2019 was 7.7 billion USD,
estimated to reach 8.2 billion USD in 2020, with annual
growth of 5.5% in the period 2019–2023 (Trung Viet,
2023).
Due to the impact of the COVID-19 epidemic,
beer industry production in 2020 decreased by 14%
compared to 2019. In 2021, output continued to decrease
by 7.8% compared to 2020. Total beer consumption
decreased by more than 20% compared to 2020 in 2019,
equivalent to a reduction of more than 1 billion liters of
beer. Meanwhile, according to Bloomberg, beer
consumption in Vietnam in 2020 is estimated to decrease
by 25% (Trung Viet, 2023).
In the context of the overall decline in beer
consumption demand, Saigon Beer, Alcohol, and
Beverage Joint Stock Corporation (Sabeco) has decided
to prioritize market share over growth while also gaining
market share from competitors. This will be the basis for
the company to continue growing in 2024, when the
economy enters a period of large-scale recovery. In
particular, in the second quarter of 2023 alone, Sabeco's
advertising and promotion costs increased by 5.6% over
the same period and accounted for 9% of total revenue
(the same period accounted for 7.8% of total revenue in
the second quarter of 2022). This is an effort to protect
market share as well as gain market share from
competitors (Vu, 2023).
According to Vu (2023), thanks to efforts to
gain market share in the context of weak overall demand,
Sabeco has had superior consumption results compared
to competitors. In particular, according to SSI Securities,
in the first half of 2023, Sabeco's consumption output
only decreased by 11% over the same period, while that
of its competitors decreased by up to 25%. Sabeco's
Board of Directors added that, thanks to the early
implementation of advertising and promotion strategies,
the company has begun to regain market share after the
Tet holiday and is expected to continue to gain more
market share in the late 2023 period.
Faced with the situation of businesses applying
the achievements of the 4.0 revolution and the entire
society undergoing digital transformation, beverage
firms should quickly innovate technology and digitally
transform. First of all, beverage firms should choose
technology suitable for production conditions, product
characteristics, and the skill levels of employees in the
firm to optimize the combination of resources to achieve
high efficiency. This is an important measure for
beverage firms to gain a competitive advantage over
imported goods right in the domestic market, creating
conditions for the export of goods—a key step in the
integration roadmap. In recent times, the beer, alcohol,
and beverage associations have encouraged beverage
firms to boldly invest, research, and innovate technology.
Therefore, technological innovation is the shortest path
to breakthrough and improve competitiveness. In
addition, technology is one of the most important
resources for firms. In a narrow sense, technology is
defined as the ability to transform inputs into outputs for
a firm (Coelli et al., 1998). Enterprises with high
technology levels are enterprises with a high level of
knowledge integrated into their products, and this index
is often measured through the average research and
development (R&D) spending per year revenue of that
enterprise. In a broader perspective, technology is
anything that helps us produce things faster, better, or
cheaper, or that is, unique ways of combining and
applying innovative resources (product development
capabilities), human resources, capital, brand, or
experience.
Beverage firms should regularly research the
market, analyze competitors, and learn about potential
customers. Market research to obtain necessary
information about supply, demand, prices, and
competitors. Market research also helps firms organize
their product production and consumption systems well
and select and segment the market appropriately.
Beverage firms should proactively learn about
customers, markets, technology, etc. to offer suitable
products.
REFERENCES
1. Bredrup, H. (1995). Competitiveness and
competitive advantage. In Performance
Management: A business process benchmarking
approach (pp. 43-60). Dordrecht: Springer
Netherlands. DOI: https://doi.org/10.1007/978-94-
011-1212-3_3.
2. Coelli, T., Rao, D. & Battese, G. (1998). An
Introduction to Efficiency and Productivity
Analysis, Kluwer Academic, Boston.
3. Cockburn, I. M., Henderson, R. M., & Stern, S.
(2000). Untangling the Origins of Competitive
Advantage. Strategic Management Journal,
21(10/11), 1123-1145.
4. Pham, T. H. (2017). Competitiveness of small and
medium enterprises, research in Hanoi City.
Paraphrase This Document
Need a fresh take? Get an instant paraphrase of this document with our AI Paraphraser
Trang, T. T. T., Tu, V. H., Ngan, D. T. K.; Ind J Econ Bus Manag; Vol-3, Iss-6 (Nov-Dec, 2023): 10-14
*Corresponding Author: To Thi Thu Trang 14
Doctoral thesis, University of Mining and Geology.
[Vietnamese]
5. Porter, M.E. (1990), The competitive Advantage of
nations, Macmillan Press LTD.
6. Porter, M. E. (1998), Competitive Strategy:
Techniques for Analyzing Industries and
Competitors, Illustrated edition, Free Press, New
York.
7. Porter, M. E. (2009). A strategy for health care
reform—toward a value-based system. New
England Journal of Medicine, 361(2), 109-112.
8. Salinger, B. L. (2001) Productivity, Competitive
Advantage and Competitiveness in Africa, USAID.
9. Trung Viet (2023). Heineken beer sales decreased
due to weak consumption in the Vietnamese market.
Accessed April 19, 2023, from
https://vnbusiness.vn/tieu-dung/doanh-so-bia-
heineken-giam-do-suc-tieu-thu-thi-truong-viet-
nam-yeu-
1092104.html#:~:text=Theo%20h%C3%A3ng%20
nghi%C3%AAn%20c%E1%BB%A9u%20th%E1
%BB%8B,Nam%20v%E1%BB%9Bi%2044%2C4
%25.
10. Vu, D. B. (2023). Sabeco (SAB): Continue to
increase market share in the context of weak overall
consumer demand. Accessed September 29, 2023,
from https://www.tinnhanhchungkhoan.vn/sabeco-
sab-tiep-tuc-gia-tang-thi-phan-trong-boi-canh-tong-
nhu-cau-tieu-thu-yeu-post330810.html
[Vietnamese].
11. Vu, T. L. (2006). Enhance the competitiveness of
companies in the process of international economic
integration. National Political Publishing House,
Hanoi. [Vietnamese].
12. Wangwe, S. 1995. Exporting Africa: Technology,
Trade, and Industrialization in Sub-Saharan Africa.
UNU/INTECH studies in new technology and
development, Routledge London.
1 out of 5

Your All-in-One AI-Powered Toolkit for Academic Success.
+13062052269
info@desklib.com
Available 24*7 on WhatsApp / Email
![[object Object]](/_next/static/media/star-bottom.7253800d.svg)
Unlock your academic potential
Copyright © 2020–2025 A2Z Services. All Rights Reserved. Developed and managed by ZUCOL.