Financial Performance Analysis of Vinamilk: A 3-Year Report
VerifiedAdded on 2023/06/08
|14
|2429
|282
Report
AI Summary
This report analyzes the financial performance of Vinamilk from 2019 to 2021, focusing on profitability, liquidity, and efficiency. The analysis includes financial ratio analysis and trend analysis of the company's audited financial statements. Key findings reveal declining profitability in 2021 compared to 2019 and 2020, with a decrease in ROCE and gross profit margin, attributed to commodity price increases and rising freight rates. The report examines liquidity through current and acid-test ratios, showing good short-term solvency. Efficiency is assessed through asset turnover and cash cycle analysis, indicating stable cash activity cycles. The report concludes with recommendations for Vinamilk to improve performance, including investments in research and development, marketing, and customer support. The report also highlights the impact of the Covid-19 pandemic and the need to address supply chain issues and rising costs.
Report
From:
TỪ THỊ PHƯƠNG LINH
To: Lecturer Nguyen Pham Hai Ha
Subject: Analysis of Vinamilk’s financial performance
Date: 31th March 2022
Introduction
In compliance with your instructions I have undertaken a financial
analysis of the company’s Vinamilk performance for the three financial
periods 2019-2021. This comprises both a financial ratio analysis and a
trend analysis of the audited published financial statements.
The analysis has been mainly undertaken on the pre-exceptional figures
to identify the underlying core performance trends of above average
performance.
Profitability
2019- The latest financial report data has shown significant declines.
Based on indicators through year sales, although 2021 has higher sales
than 2020 and 2019, in terms of value, ROCE of 2019 was 45.29% higher
than ROCE, 36.92% of 2021. The significant drop in overall profit with
ROCE negative compared to two years ago showed high risk for the
business. This means that by 2019, Vinamilk has done better capital
deployment work than 2021. Vinamilk's gross profit for the last year
decreased slightly with 48.71% from 2020, to 1,390 billion VND, due to
commodity prices, continued growth of freight rates as a major cause of
impact. Despite reducing sales costs and business management costs at
unreasonable costs, after-tax profit was reduced by 2021 from a decrease
of 5.37%, or around 603 million VND. So despite an increase in profits
between 2019 and 2020, that by 2021 Vinamilk would both grow
negative returns compared to the previous year. The business was again
swarming with profits after three years of continuous growth. A 3 - year
Paraphrase This Document
Need a fresh take? Get an instant paraphrase of this document with our AI Paraphraser
asset turnover of 13.14 percent showed that businesses were still not
doing business efficiently and delivered true cash flow.
2019 - 1.37 bilion
2020 - 1.28 bilion
2021- 1.19 bilion
ROCE (2021) = Net Operating Profit (EBIT) / Total Assets - Current
Liabilities = 35.63%
ROCE (2020) = 39.50%
ROCE (2019) = 42.88%
Liquidity
Working capital ratio
Current Ratio = Current asset/ Current
Liabilities
2019 2020 2021 the industry
average
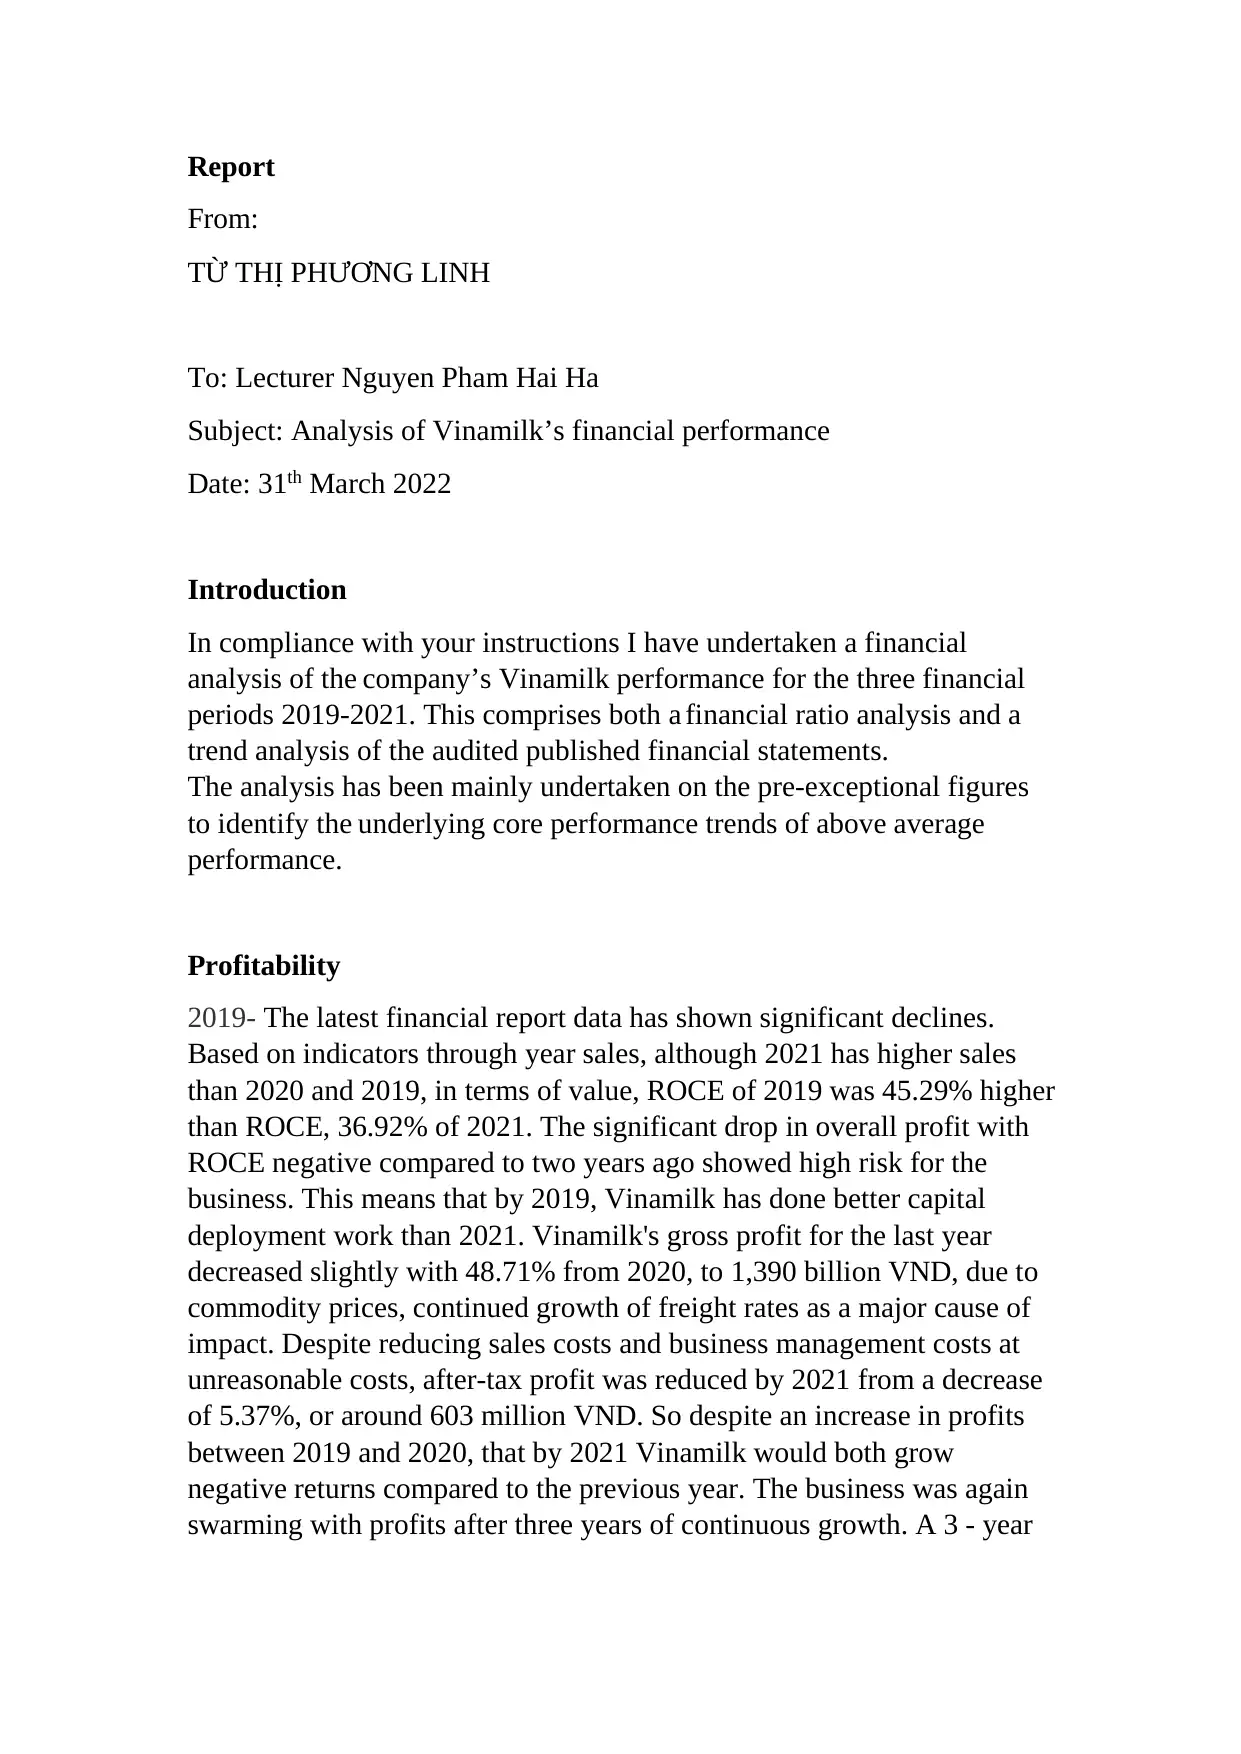
Current
asset 24,721,565,376,552 29,665,725,805,058 36,109,910,649,785
Current
Liabilites 14,442,851,833,360 14,212,646,285,475 17,068,416,995,519
Current
ratio 1,71 2,09 2,12 1,79
doing business efficiently and delivered true cash flow.
2019 - 1.37 bilion
2020 - 1.28 bilion
2021- 1.19 bilion
ROCE (2021) = Net Operating Profit (EBIT) / Total Assets - Current
Liabilities = 35.63%
ROCE (2020) = 39.50%
ROCE (2019) = 42.88%
Liquidity
Working capital ratio
Current Ratio = Current asset/ Current
Liabilities
2019 2020 2021 the industry
average
Current
asset 24,721,565,376,552 29,665,725,805,058 36,109,910,649,785
Current
Liabilites 14,442,851,833,360 14,212,646,285,475 17,068,416,995,519
Current
ratio 1,71 2,09 2,12 1,79
- The ratio of short-term payment terms from 2019 to 2021 is all
greater than 1, this allows enterprises to ensure short-term payment
and be able to pay.
- The short-term solvency of the company increases steadily every
year
- This ratio is higher than the industry average [ (1,71+2,09+2,12 ) /3 =
1,97 ] in 2021, which shows that Vinamilk's short-term solvency is
good
-
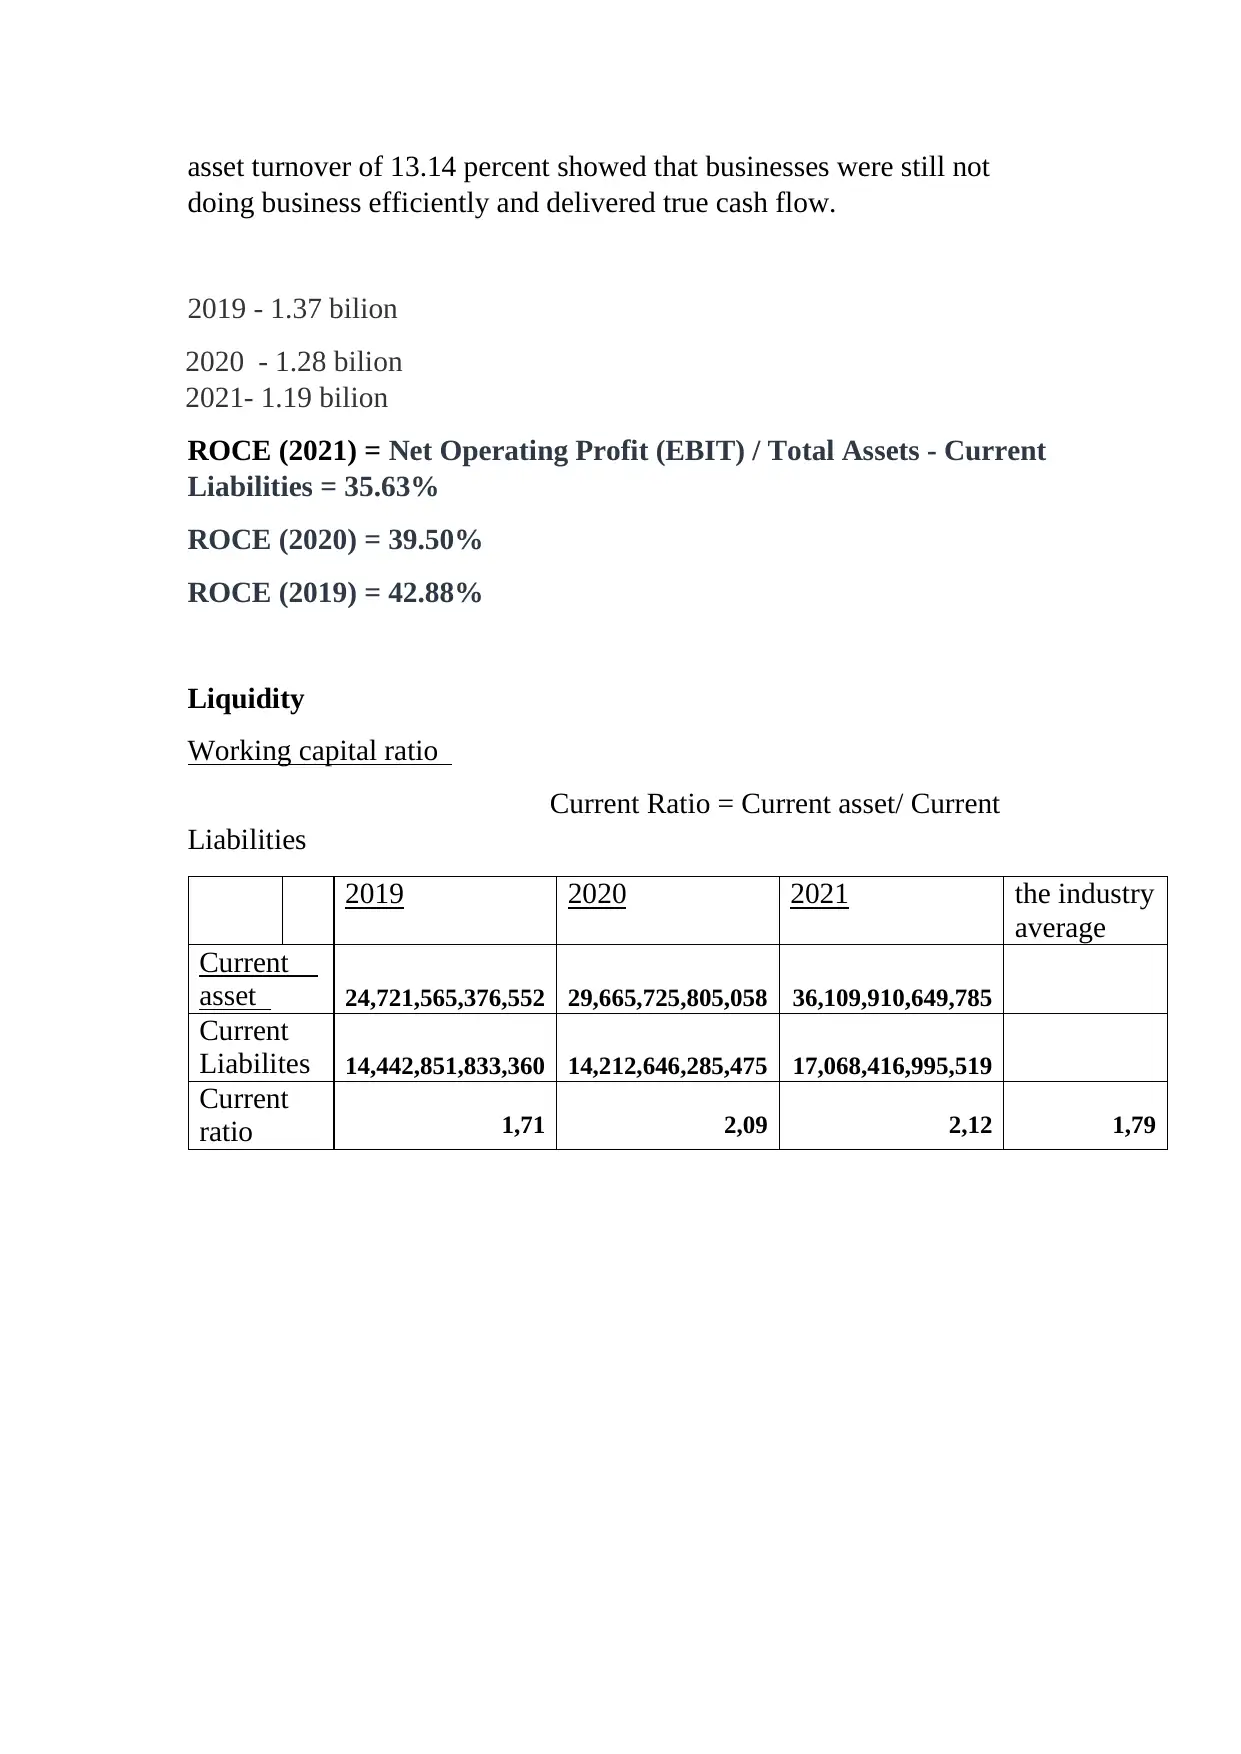
Acid test ratio
Ca’s – inventories
Current liabilities
2019 2020 2021 the
industry
average
Current
asset 24,721,565,376,552 29,665,725,805,058 36,109,910,649,785
Inventories 4,983,044,403,917 4,905,068,613,616 6,773,071,634,017
Current
Liabilities 14,442,851,833,360 14,212,646,285,475 17,068,416,995,519
Acid test
ratio 1,367 1,742 1,719 1,61
0
5
10
15
20
25
30
35
40
2019 2020 2021
Chart Title
Current asset Current Liabilities Current ratio
greater than 1, this allows enterprises to ensure short-term payment
and be able to pay.
- The short-term solvency of the company increases steadily every
year
- This ratio is higher than the industry average [ (1,71+2,09+2,12 ) /3 =
1,97 ] in 2021, which shows that Vinamilk's short-term solvency is
good
-
Acid test ratio
Ca’s – inventories
Current liabilities
2019 2020 2021 the
industry
average
Current
asset 24,721,565,376,552 29,665,725,805,058 36,109,910,649,785
Inventories 4,983,044,403,917 4,905,068,613,616 6,773,071,634,017
Current
Liabilities 14,442,851,833,360 14,212,646,285,475 17,068,416,995,519
Acid test
ratio 1,367 1,742 1,719 1,61
0
5
10
15
20
25
30
35
40
2019 2020 2021
Chart Title
Current asset Current Liabilities Current ratio
⊘ This is a preview!⊘
Do you want full access?
Subscribe today to unlock all pages.
Trusted by 1+ million students worldwide
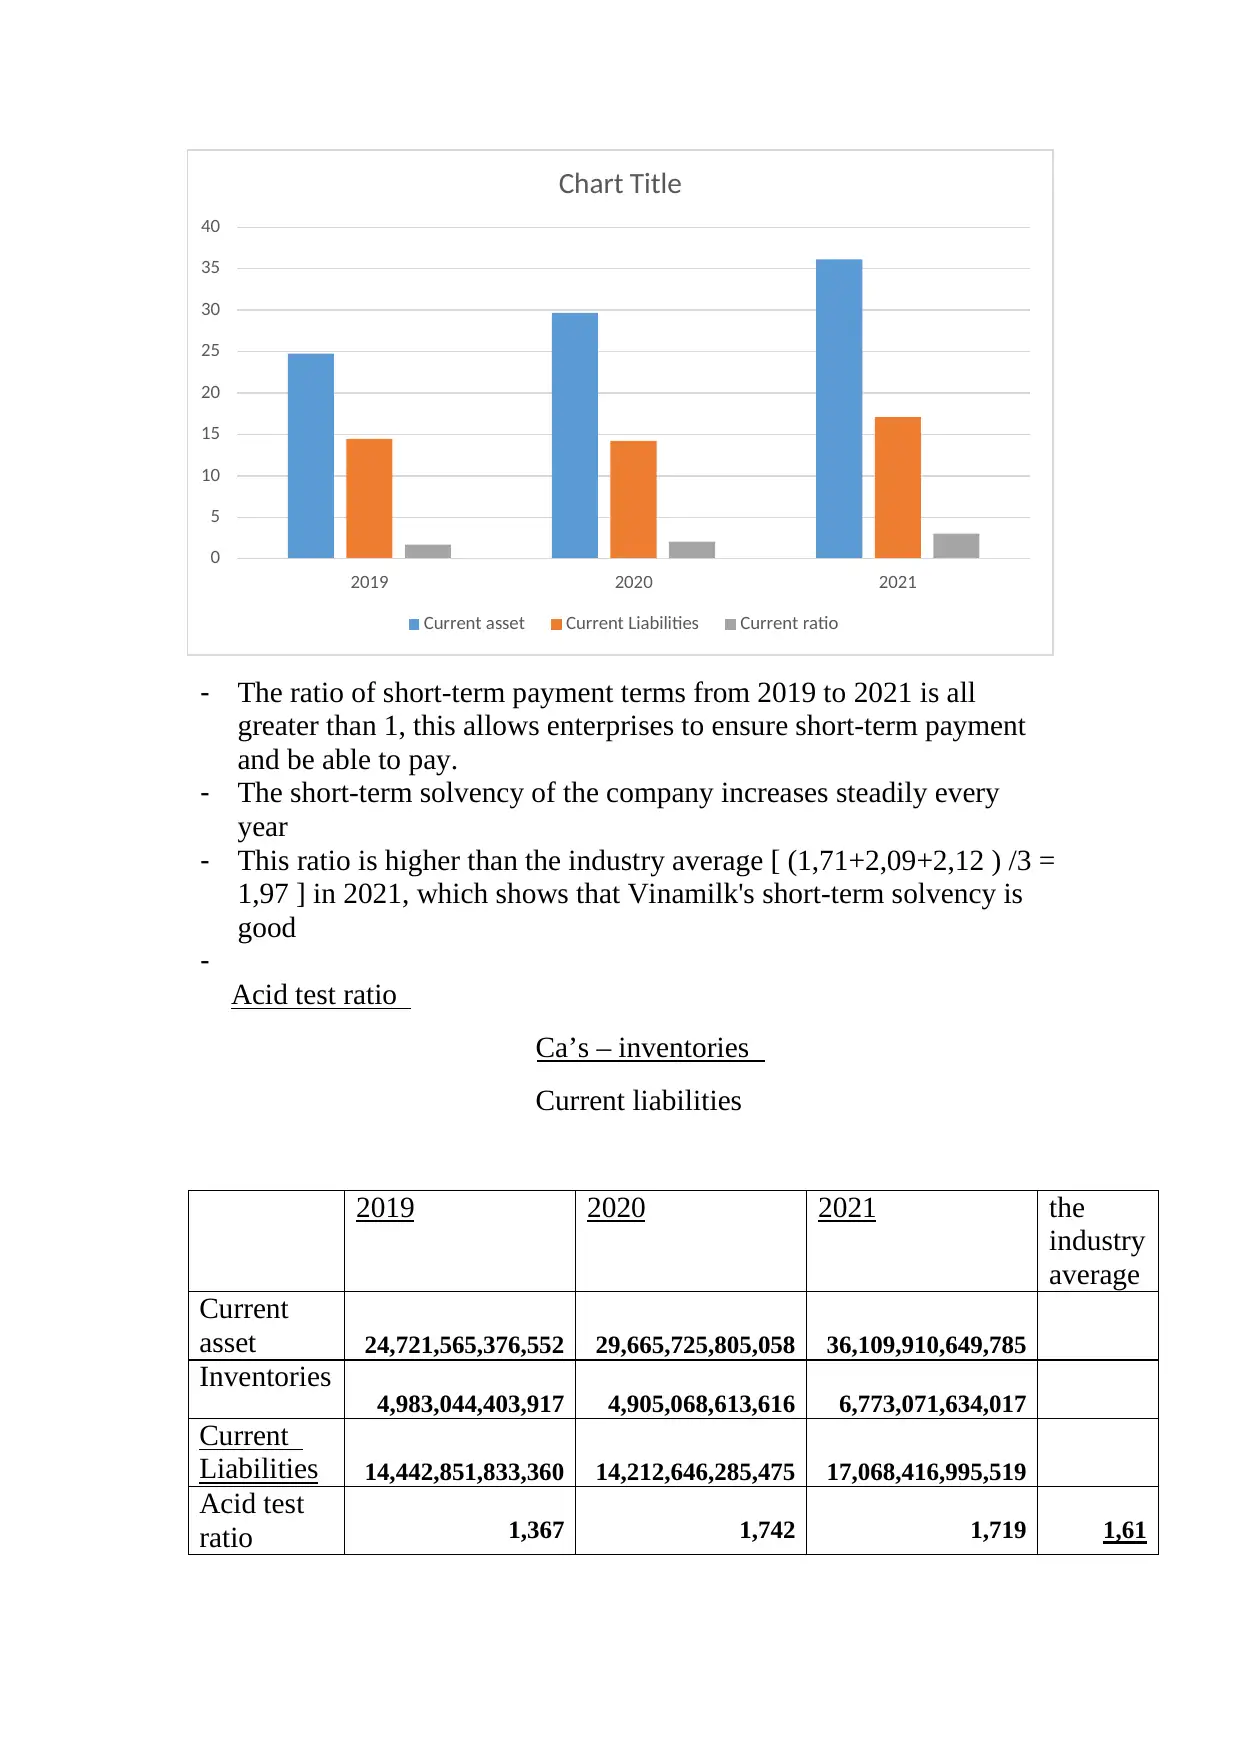
- The payment ratio of the business increases every year.
- The ratio of enterprises in 3 years ( 2019,2020,2021) > 1 shows that:
reflects the enterprise with good solvency and high liquidity.
- The quick ratio in 2020 and 2021 has improved compared to 2019
and is even higher than the industry average [ (1,376 1,742 1,719)/3
= 1.61 ]
Efficienty
Over three years, short-term customer receivables have a slight increase
but remain stable as long term receivables have been paid off in 2019. In
the case of liabilities there has been significant growth, however, as from
2019 it grows to the end of the year at 14,968 billion VND, and continues
to rise until the end of 2021 at 17,482 billion VND. This shows that
Vinamilk has taken advantage of the long term to use optimal capital
effectively in 2019, but by 2021, this kind of debt had grown even higher,
suggesting that under negative influence from Covid-19, it had in part
caused Vinamilk to switch to heavily increased short term loans over a
year in order to gain interest to enhance its revenue stream. '
The cash activity cycle remains stable when payment via cash
transactions with inventory, and receiving cash for other sales. The cash
cycle has changed in the previous two years when there is a slight decline
in cash at the end of the year, but by 2021 the increase in the amount
gradually increases to the end of the year, representing a steady amount
parallel to receivables increase over the years
0
5
10
15
20
25
30
35
40
2019 2020 2021
Chart Title
Current asset Inventories Current Liabilities Acid test ratio
Paraphrase This Document
Need a fresh take? Get an instant paraphrase of this document with our AI Paraphraser
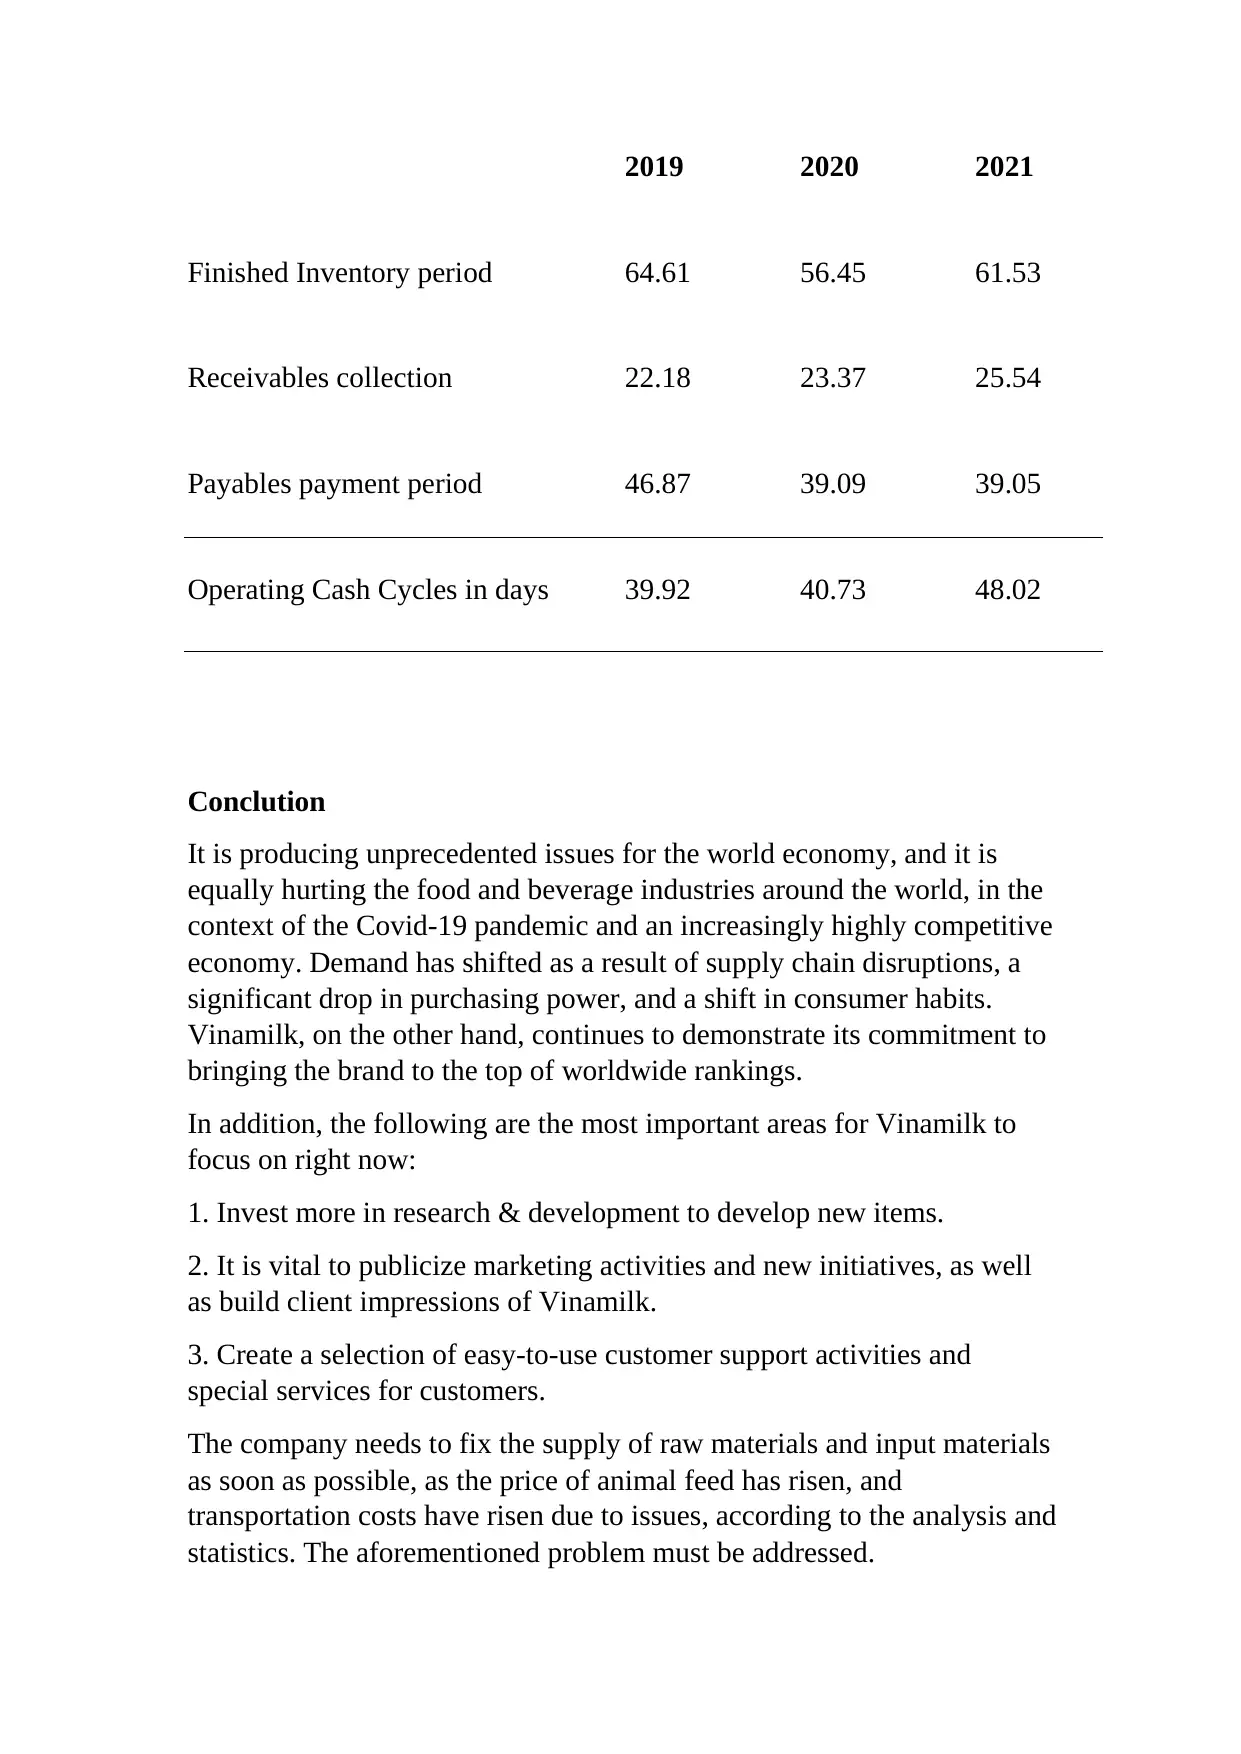
2019 2020 2021
Finished Inventory period 64.61 56.45 61.53
Receivables collection 22.18 23.37 25.54
Payables payment period 46.87 39.09 39.05
Operating Cash Cycles in days 39.92 40.73 48.02
Conclution
It is producing unprecedented issues for the world economy, and it is
equally hurting the food and beverage industries around the world, in the
context of the Covid-19 pandemic and an increasingly highly competitive
economy. Demand has shifted as a result of supply chain disruptions, a
significant drop in purchasing power, and a shift in consumer habits.
Vinamilk, on the other hand, continues to demonstrate its commitment to
bringing the brand to the top of worldwide rankings.
In addition, the following are the most important areas for Vinamilk to
focus on right now:
1. Invest more in research & development to develop new items.
2. It is vital to publicize marketing activities and new initiatives, as well
as build client impressions of Vinamilk.
3. Create a selection of easy-to-use customer support activities and
special services for customers.
The company needs to fix the supply of raw materials and input materials
as soon as possible, as the price of animal feed has risen, and
transportation costs have risen due to issues, according to the analysis and
statistics. The aforementioned problem must be addressed.

FINANCIAL
STATEMENT
2021 2020 2019
Non Current Assets
Good will 1,813,007,890,387 2,058,548,005,612 2,366,060,103,995
Long-term recievables 16,695,104,495 19,974,111,715 21,169,968,995
Intangibles 1,086,503,968,330 1,136,500,988,622 1,149,630,598,102
Property, plant and
equipment 11,620,094,589,519 12,717,306,878,414 13,743,909,618,601
Investment properties 60,049,893,676 59,996,974,041 62,018,116,736
Long-term assets in
progress 1,130,023,695,910 1,062,633,519,957 943,845,551,903
Long-term investments 743,862,023,831 973,440,912,476 986,676,290,429
Long-term prepaid
expenses 725,108,101,375 713,499,307,014 678,630,479,869
Deferred tax asset 27,147,520,911 24,854,170,720 26,367,280,852
Total non-current assets 17,222,492,788,434 18,766,754,868,571 19,978,308,009,482
Current Assets
Inventories 6,773,071,634,017 4,905,068,613,616 4,983,044,403,917
Trade and other receivables 5,822,028,742,791 5,187,253,172,150 4,503,154,728,959
Cash and cash equivalents 2,348,551,874,348 2,111,242,815,581 2,665,194,638,452
Short-term investments 21,025,735,779,475 17,313,679,774,893 12,435,744,328,964
Other current assets
140,522,619,154 148,481,428,818 134,427,276,260
Total current assets 36,109,910,649,785 29,665,725,805,058 24,721,565,376,552
Total Assets 53,332,403,438,219 48,432,480,673,629 44,699,873,386,034
⊘ This is a preview!⊘
Do you want full access?
Subscribe today to unlock all pages.
Trusted by 1+ million students worldwide
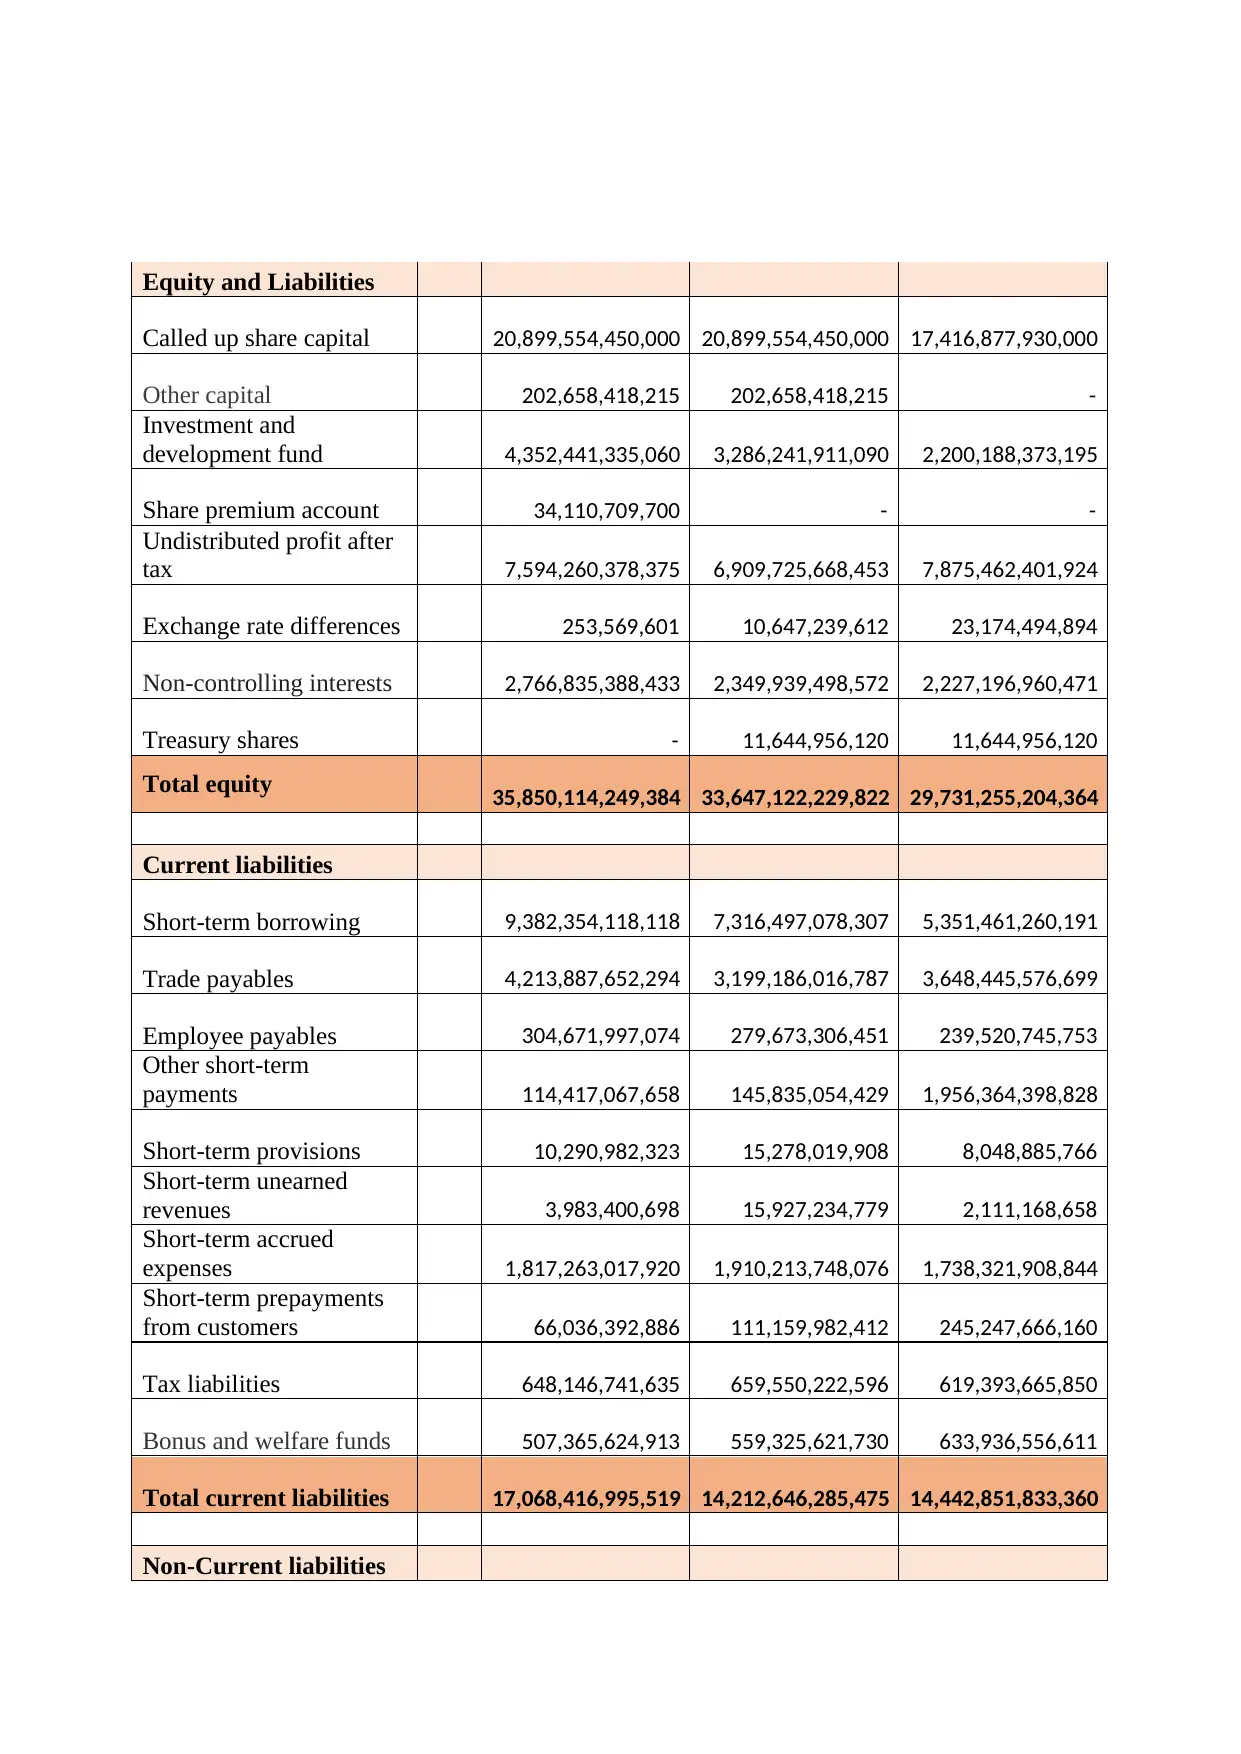
Equity and Liabilities
Called up share capital 20,899,554,450,000 20,899,554,450,000 17,416,877,930,000
Other capital 202,658,418,215 202,658,418,215 -
Investment and
development fund 4,352,441,335,060 3,286,241,911,090 2,200,188,373,195
Share premium account 34,110,709,700 - -
Undistributed profit after
tax 7,594,260,378,375 6,909,725,668,453 7,875,462,401,924
Exchange rate differences 253,569,601 10,647,239,612 23,174,494,894
Non-controlling interests 2,766,835,388,433 2,349,939,498,572 2,227,196,960,471
Treasury shares - 11,644,956,120 11,644,956,120
Total equity 35,850,114,249,384 33,647,122,229,822 29,731,255,204,364
Current liabilities
Short-term borrowing 9,382,354,118,118 7,316,497,078,307 5,351,461,260,191
Trade payables 4,213,887,652,294 3,199,186,016,787 3,648,445,576,699
Employee payables 304,671,997,074 279,673,306,451 239,520,745,753
Other short-term
payments 114,417,067,658 145,835,054,429 1,956,364,398,828
Short-term provisions 10,290,982,323 15,278,019,908 8,048,885,766
Short-term unearned
revenues 3,983,400,698 15,927,234,779 2,111,168,658
Short-term accrued
expenses 1,817,263,017,920 1,910,213,748,076 1,738,321,908,844
Short-term prepayments
from customers 66,036,392,886 111,159,982,412 245,247,666,160
Tax liabilities 648,146,741,635 659,550,222,596 619,393,665,850
Bonus and welfare funds 507,365,624,913 559,325,621,730 633,936,556,611
Total current liabilities 17,068,416,995,519 14,212,646,285,475 14,442,851,833,360
Non-Current liabilities
Paraphrase This Document
Need a fresh take? Get an instant paraphrase of this document with our AI Paraphraser
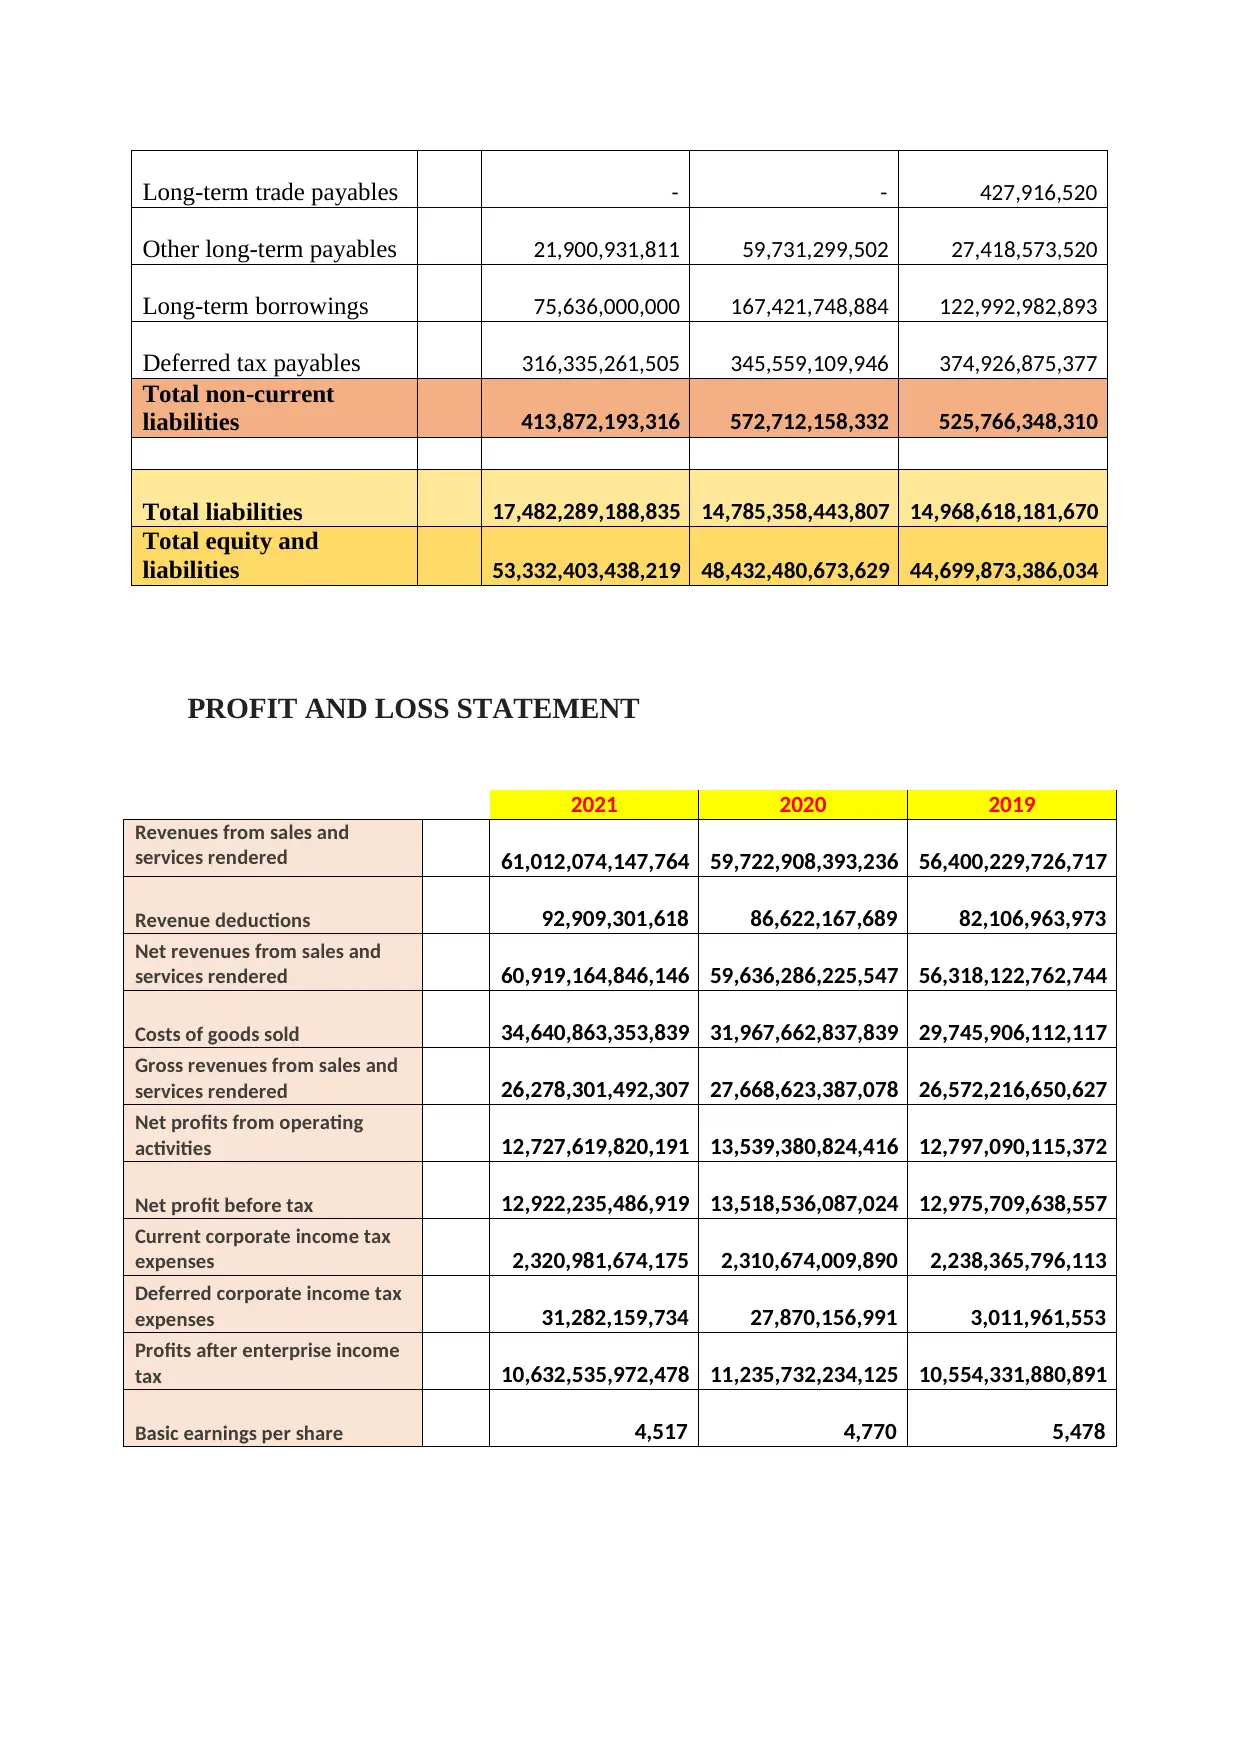
PROFIT AND LOSS STATEMENT
Long-term trade payables - - 427,916,520
Other long-term payables 21,900,931,811 59,731,299,502 27,418,573,520
Long-term borrowings 75,636,000,000 167,421,748,884 122,992,982,893
Deferred tax payables 316,335,261,505 345,559,109,946 374,926,875,377
Total non-current
liabilities 413,872,193,316 572,712,158,332 525,766,348,310
Total liabilities 17,482,289,188,835 14,785,358,443,807 14,968,618,181,670
Total equity and
liabilities 53,332,403,438,219 48,432,480,673,629 44,699,873,386,034
2021 2020 2019
Revenues from sales and
services rendered 61,012,074,147,764 59,722,908,393,236 56,400,229,726,717
Revenue deductions 92,909,301,618 86,622,167,689 82,106,963,973
Net revenues from sales and
services rendered 60,919,164,846,146 59,636,286,225,547 56,318,122,762,744
Costs of goods sold 34,640,863,353,839 31,967,662,837,839 29,745,906,112,117
Gross revenues from sales and
services rendered 26,278,301,492,307 27,668,623,387,078 26,572,216,650,627
Net profits from operating
activities 12,727,619,820,191 13,539,380,824,416 12,797,090,115,372
Net profit before tax 12,922,235,486,919 13,518,536,087,024 12,975,709,638,557
Current corporate income tax
expenses 2,320,981,674,175 2,310,674,009,890 2,238,365,796,113
Deferred corporate income tax
expenses 31,282,159,734 27,870,156,991 3,011,961,553
Profits after enterprise income
tax 10,632,535,972,478 11,235,732,234,125 10,554,331,880,891
Basic earnings per share 4,517 4,770 5,478
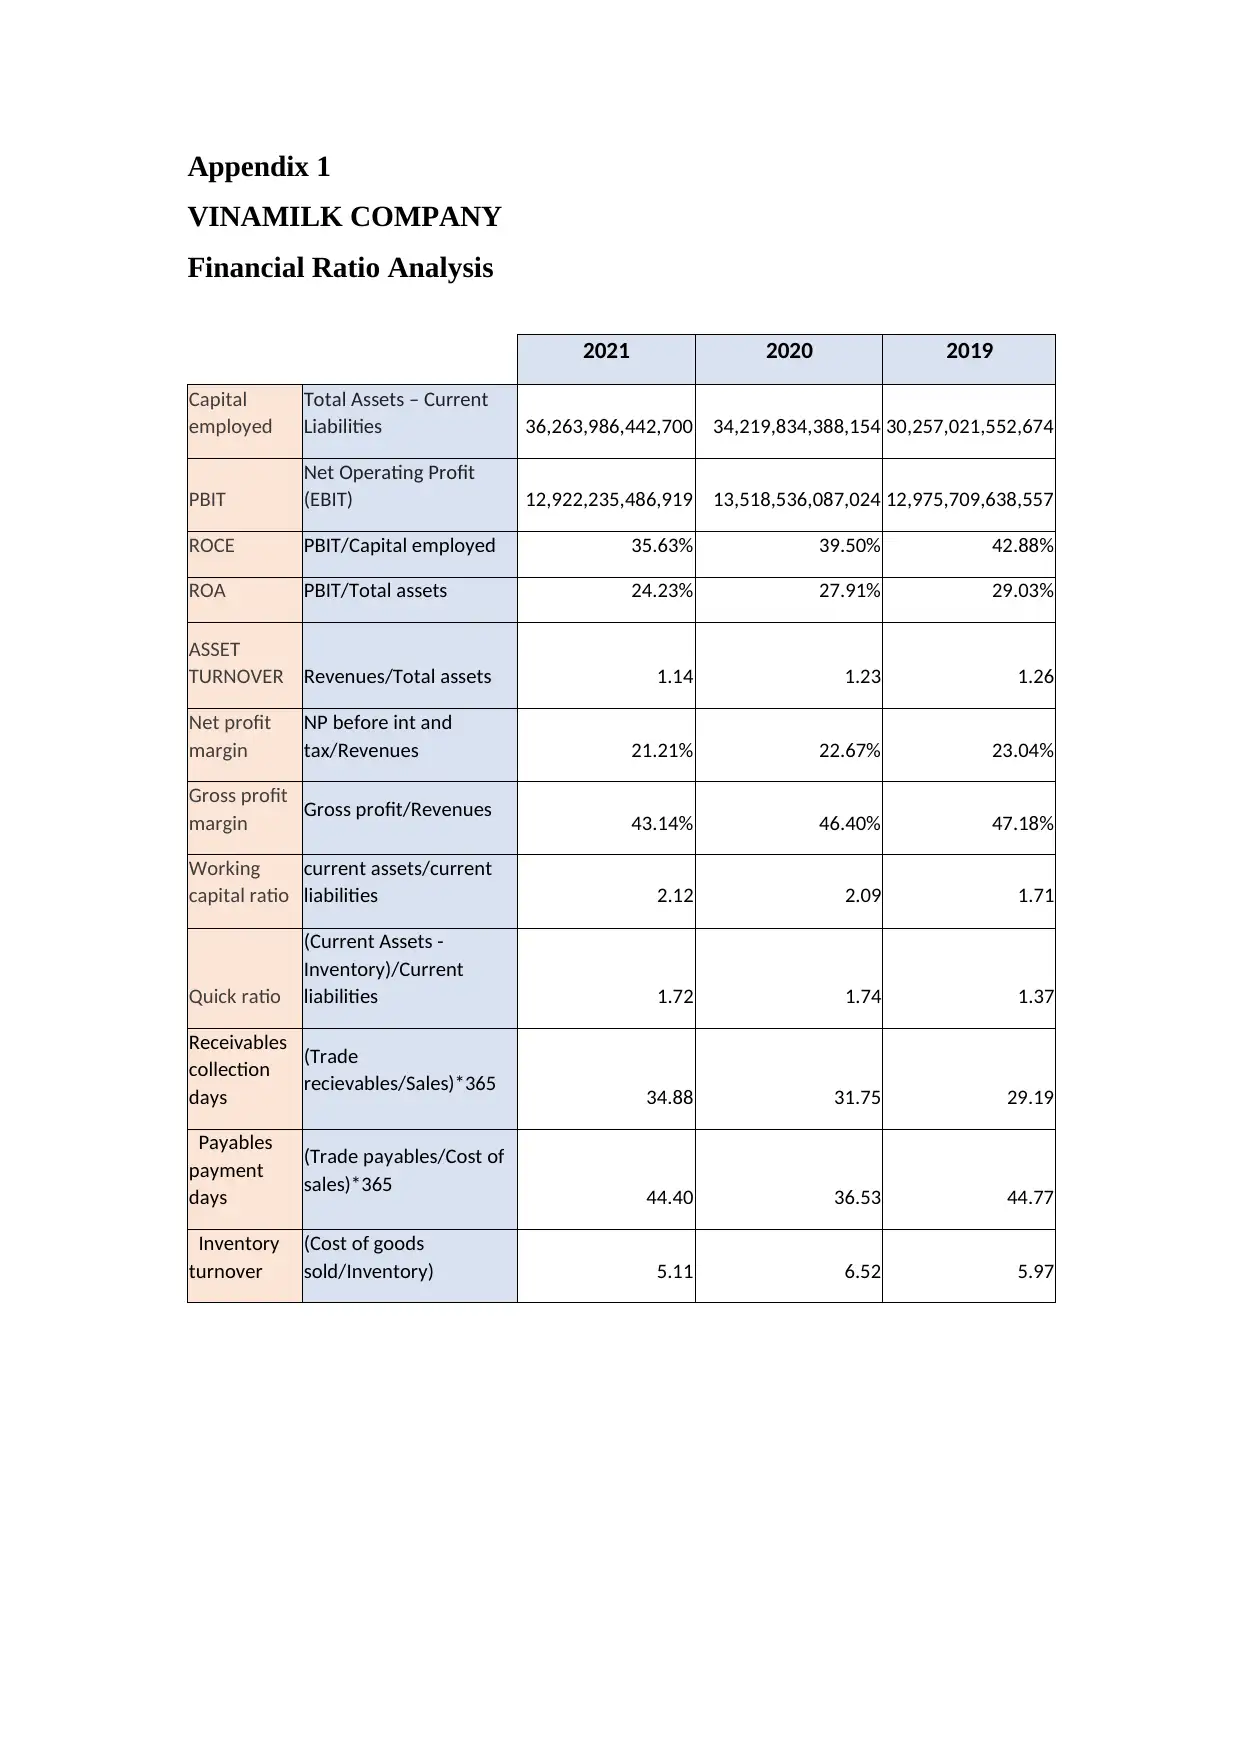
Appendix 1
VINAMILK COMPANY
Financial Ratio Analysis
2021 2020 2019
Capital
employed
Total Assets – Current
Liabilities 36,263,986,442,700 34,219,834,388,154 30,257,021,552,674
PBIT
Net Operating Profit
(EBIT) 12,922,235,486,919 13,518,536,087,024 12,975,709,638,557
ROCE PBIT/Capital employed 35.63% 39.50% 42.88%
ROA PBIT/Total assets 24.23% 27.91% 29.03%
ASSET
TURNOVER Revenues/Total assets 1.14 1.23 1.26
Net profit
margin
NP before int and
tax/Revenues 21.21% 22.67% 23.04%
Gross profit
margin Gross profit/Revenues 43.14% 46.40% 47.18%
Working
capital ratio
current assets/current
liabilities 2.12 2.09 1.71
Quick ratio
(Current Assets -
Inventory)/Current
liabilities 1.72 1.74 1.37
Receivables
collection
days
(Trade
recievables/Sales)*365 34.88 31.75 29.19
Payables
payment
days
(Trade payables/Cost of
sales)*365 44.40 36.53 44.77
Inventory
turnover
(Cost of goods
sold/Inventory) 5.11 6.52 5.97
⊘ This is a preview!⊘
Do you want full access?
Subscribe today to unlock all pages.
Trusted by 1+ million students worldwide
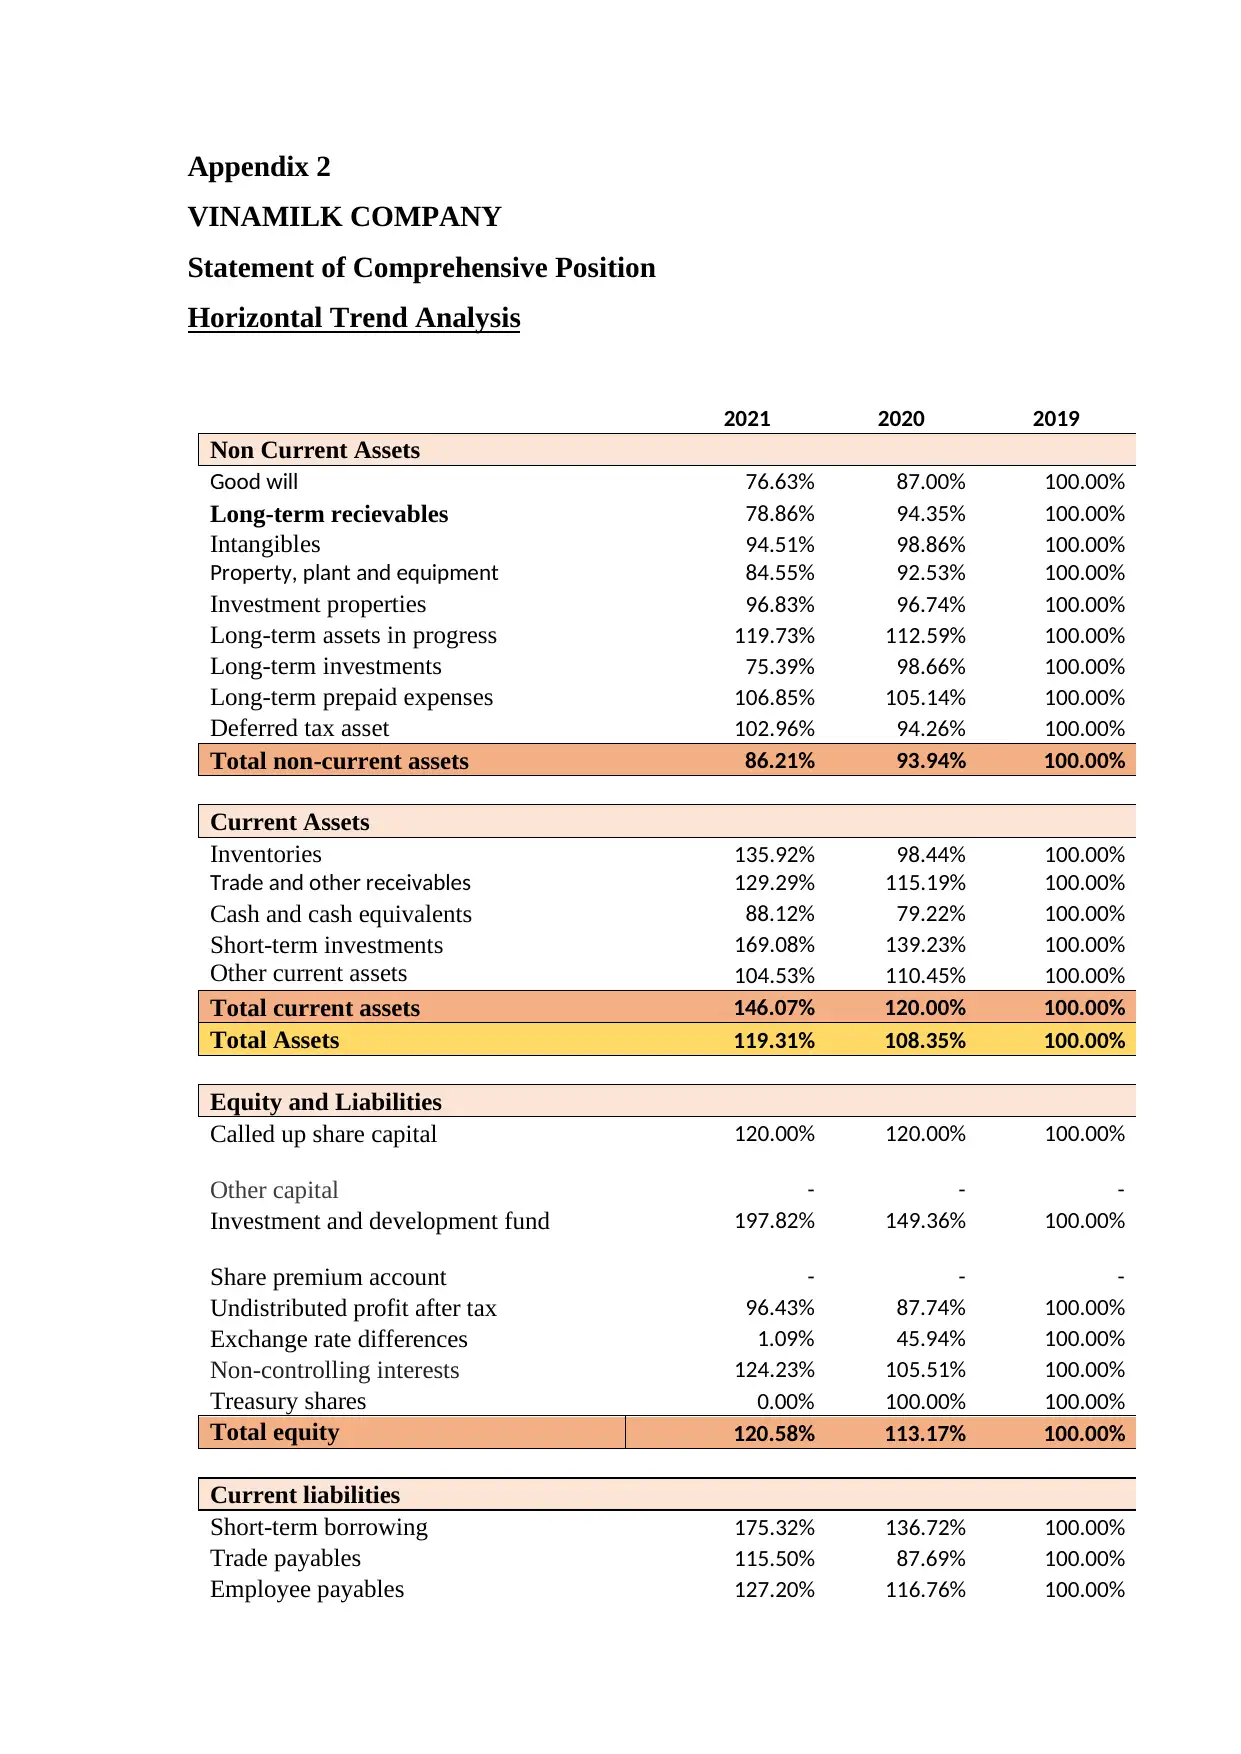
Appendix 2
VINAMILK COMPANY
Statement of Comprehensive Position
Horizontal Trend Analysis
2021 2020 2019
Non Current Assets
Good will 76.63% 87.00% 100.00%
Long-term recievables 78.86% 94.35% 100.00%
Intangibles 94.51% 98.86% 100.00%
Property, plant and equipment 84.55% 92.53% 100.00%
Investment properties 96.83% 96.74% 100.00%
Long-term assets in progress 119.73% 112.59% 100.00%
Long-term investments 75.39% 98.66% 100.00%
Long-term prepaid expenses 106.85% 105.14% 100.00%
Deferred tax asset 102.96% 94.26% 100.00%
Total non-current assets 86.21% 93.94% 100.00%
Current Assets
Inventories 135.92% 98.44% 100.00%
Trade and other receivables 129.29% 115.19% 100.00%
Cash and cash equivalents 88.12% 79.22% 100.00%
Short-term investments 169.08% 139.23% 100.00%
Other current assets 104.53% 110.45% 100.00%
Total current assets 146.07% 120.00% 100.00%
Total Assets 119.31% 108.35% 100.00%
Equity and Liabilities
Called up share capital 120.00% 120.00% 100.00%
Other capital - - -
Investment and development fund 197.82% 149.36% 100.00%
Share premium account - - -
Undistributed profit after tax 96.43% 87.74% 100.00%
Exchange rate differences 1.09% 45.94% 100.00%
Non-controlling interests 124.23% 105.51% 100.00%
Treasury shares 0.00% 100.00% 100.00%
Total equity 120.58% 113.17% 100.00%
Current liabilities
Short-term borrowing 175.32% 136.72% 100.00%
Trade payables 115.50% 87.69% 100.00%
Employee payables 127.20% 116.76% 100.00%
Paraphrase This Document
Need a fresh take? Get an instant paraphrase of this document with our AI Paraphraser
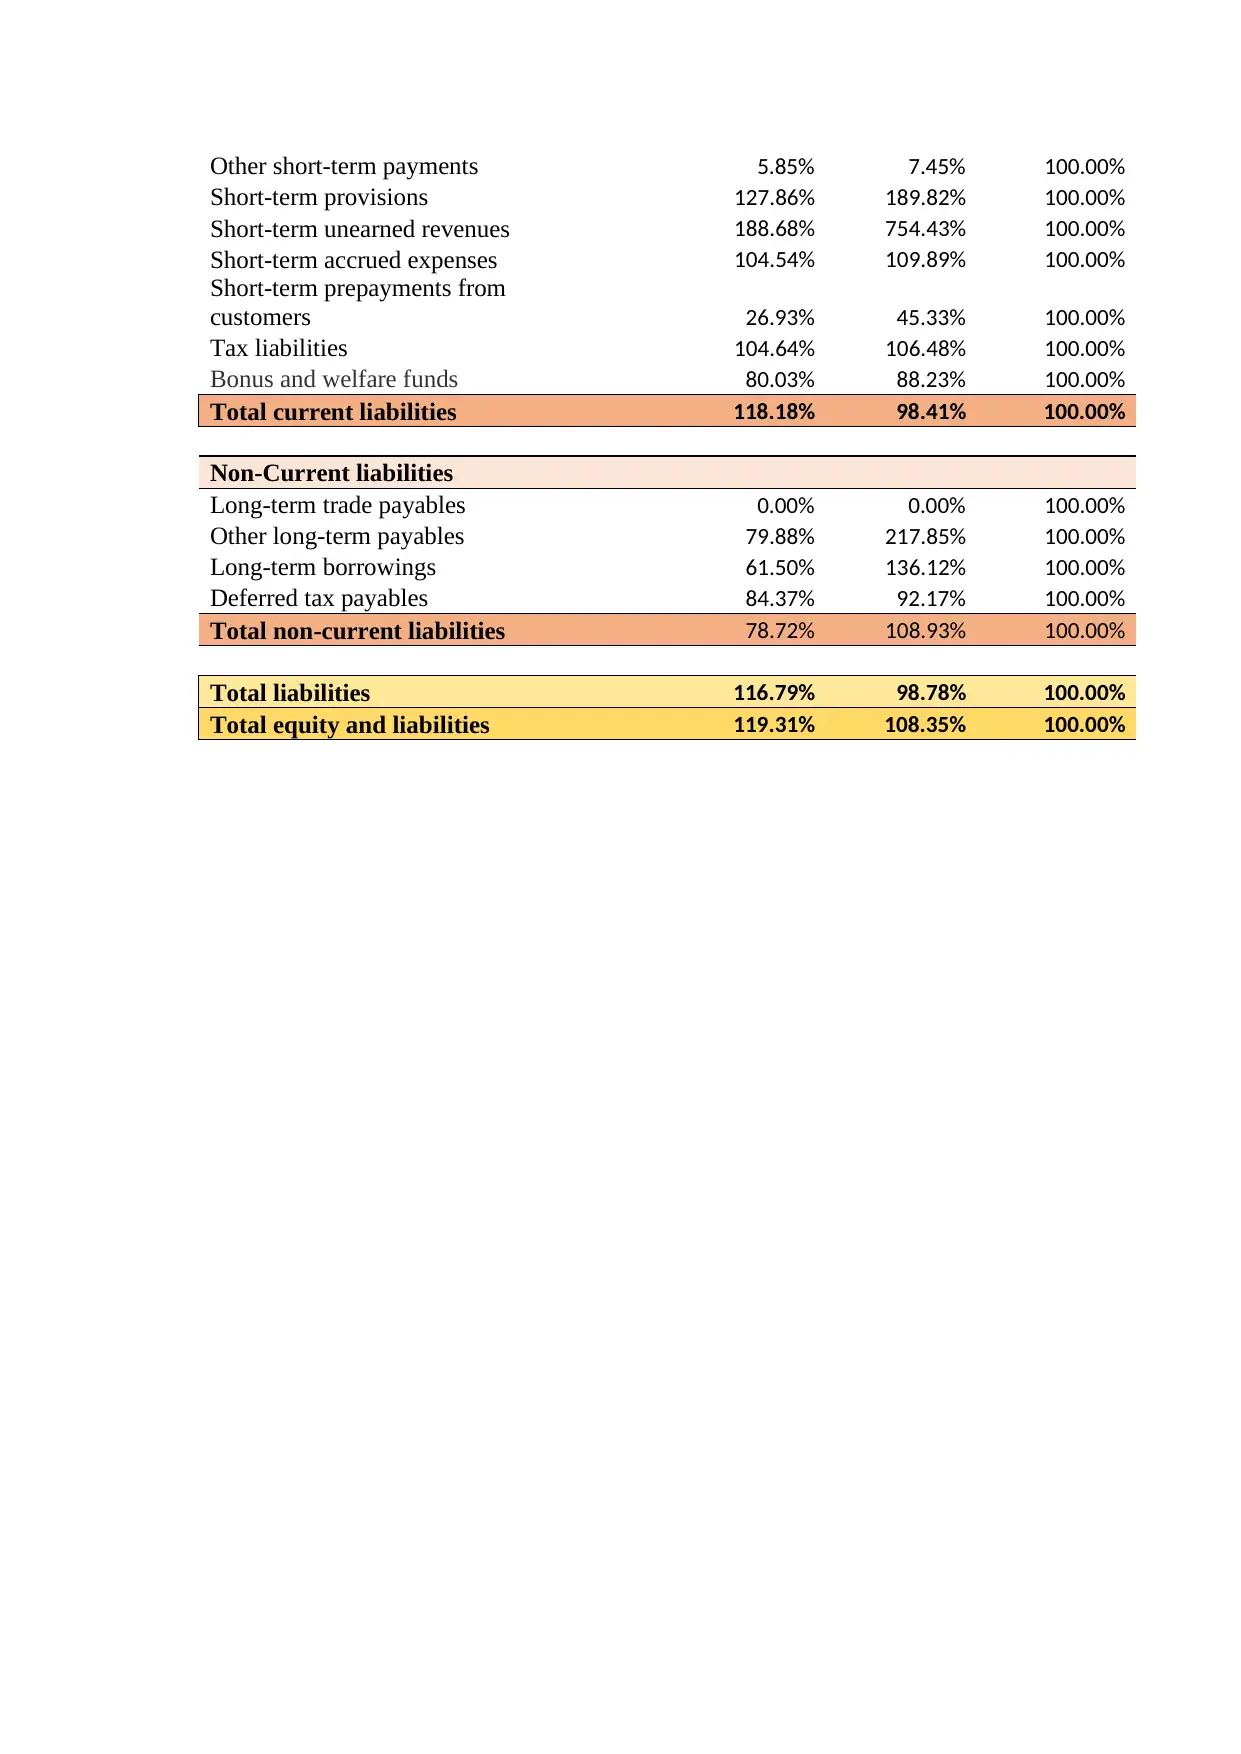
Other short-term payments 5.85% 7.45% 100.00%
Short-term provisions 127.86% 189.82% 100.00%
Short-term unearned revenues 188.68% 754.43% 100.00%
Short-term accrued expenses 104.54% 109.89% 100.00%
Short-term prepayments from
customers 26.93% 45.33% 100.00%
Tax liabilities 104.64% 106.48% 100.00%
Bonus and welfare funds 80.03% 88.23% 100.00%
Total current liabilities 118.18% 98.41% 100.00%
Non-Current liabilities
Long-term trade payables 0.00% 0.00% 100.00%
Other long-term payables 79.88% 217.85% 100.00%
Long-term borrowings 61.50% 136.12% 100.00%
Deferred tax payables 84.37% 92.17% 100.00%
Total non-current liabilities 78.72% 108.93% 100.00%
Total liabilities 116.79% 98.78% 100.00%
Total equity and liabilities 119.31% 108.35% 100.00%
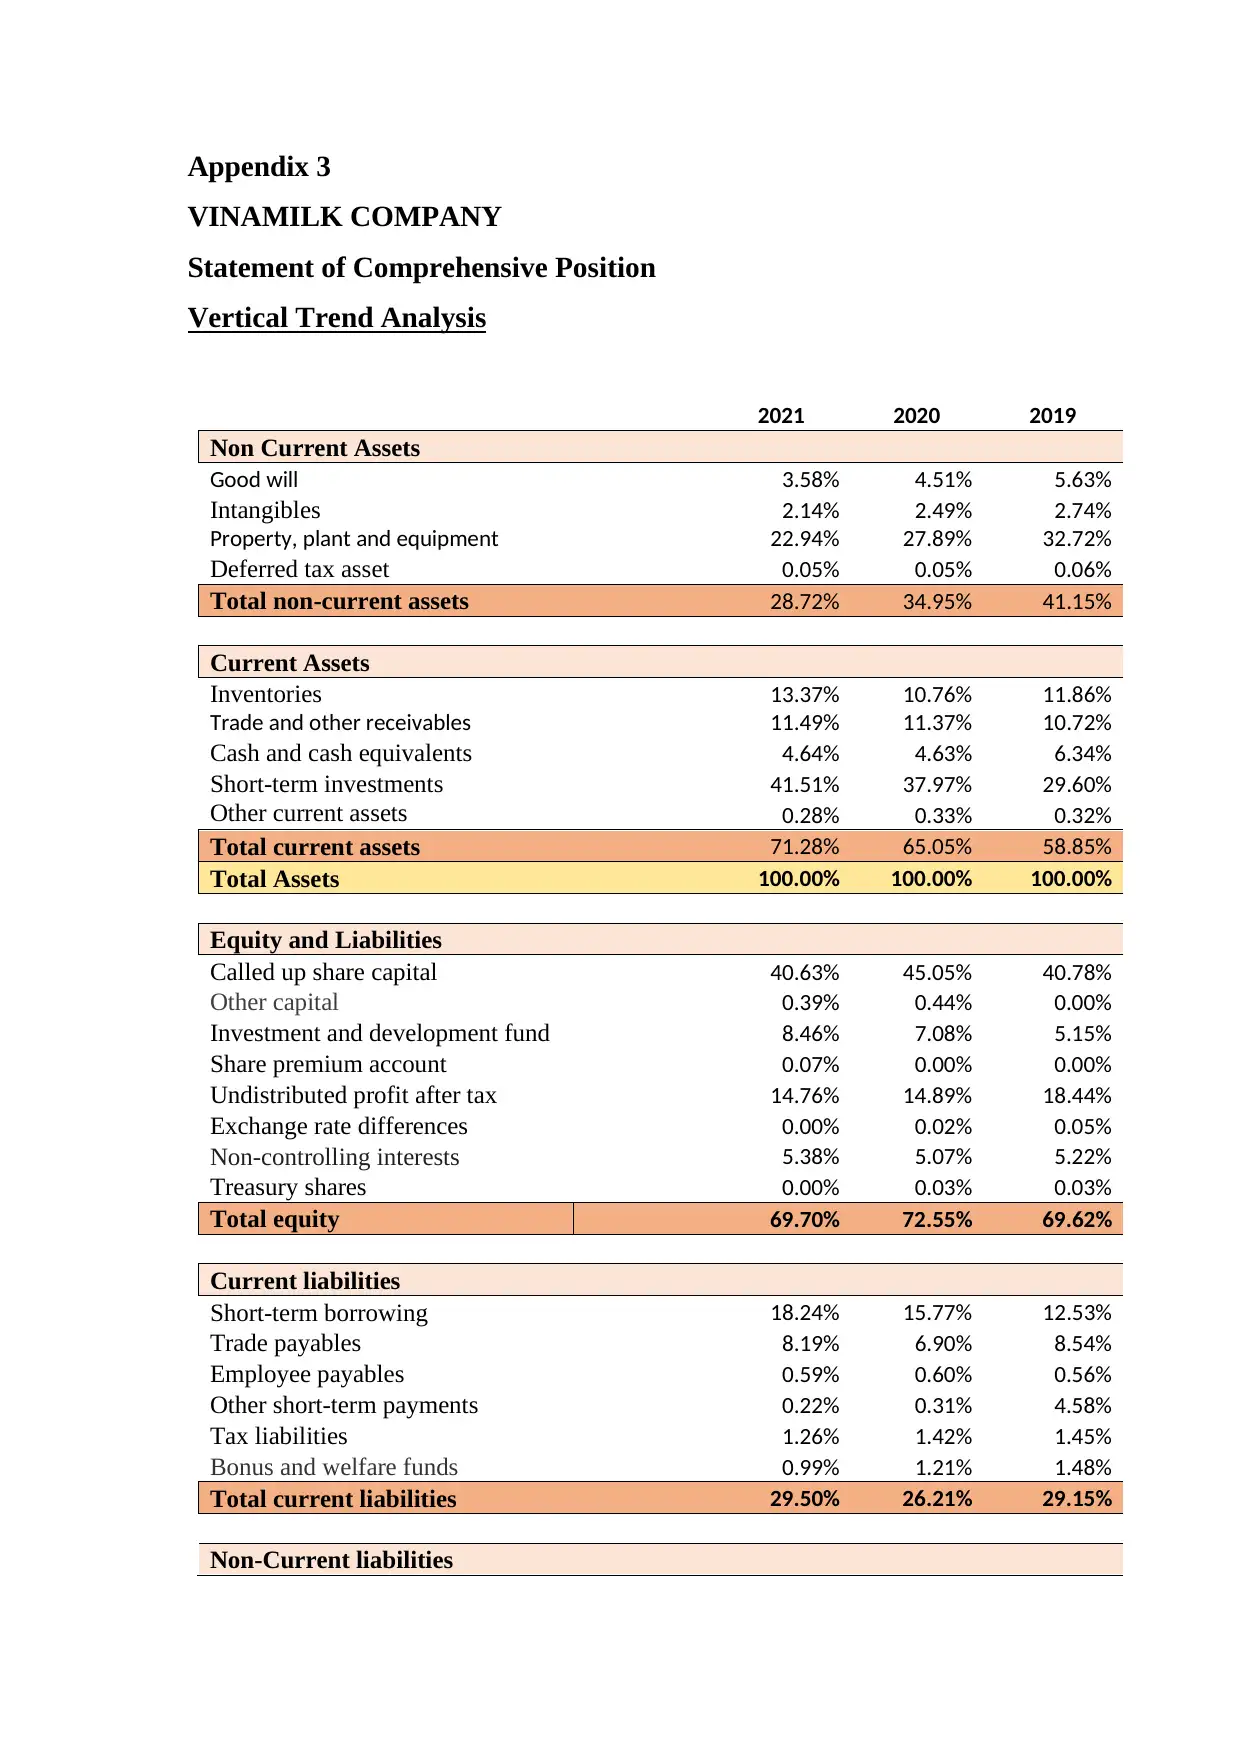
Appendix 3
VINAMILK COMPANY
Statement of Comprehensive Position
Vertical Trend Analysis
2021 2020 2019
Non Current Assets
Good will 3.58% 4.51% 5.63%
Intangibles 2.14% 2.49% 2.74%
Property, plant and equipment 22.94% 27.89% 32.72%
Deferred tax asset 0.05% 0.05% 0.06%
Total non-current assets 28.72% 34.95% 41.15%
Current Assets
Inventories 13.37% 10.76% 11.86%
Trade and other receivables 11.49% 11.37% 10.72%
Cash and cash equivalents 4.64% 4.63% 6.34%
Short-term investments 41.51% 37.97% 29.60%
Other current assets 0.28% 0.33% 0.32%
Total current assets 71.28% 65.05% 58.85%
Total Assets 100.00% 100.00% 100.00%
Equity and Liabilities
Called up share capital 40.63% 45.05% 40.78%
Other capital 0.39% 0.44% 0.00%
Investment and development fund 8.46% 7.08% 5.15%
Share premium account 0.07% 0.00% 0.00%
Undistributed profit after tax 14.76% 14.89% 18.44%
Exchange rate differences 0.00% 0.02% 0.05%
Non-controlling interests 5.38% 5.07% 5.22%
Treasury shares 0.00% 0.03% 0.03%
Total equity 69.70% 72.55% 69.62%
Current liabilities
Short-term borrowing 18.24% 15.77% 12.53%
Trade payables 8.19% 6.90% 8.54%
Employee payables 0.59% 0.60% 0.56%
Other short-term payments 0.22% 0.31% 4.58%
Tax liabilities 1.26% 1.42% 1.45%
Bonus and welfare funds 0.99% 1.21% 1.48%
Total current liabilities 29.50% 26.21% 29.15%
Non-Current liabilities
⊘ This is a preview!⊘
Do you want full access?
Subscribe today to unlock all pages.
Trusted by 1+ million students worldwide
1 out of 14
Related Documents


Your All-in-One AI-Powered Toolkit for Academic Success.
+13062052269
info@desklib.com
Available 24*7 on WhatsApp / Email
![[object Object]](/_next/static/media/star-bottom.7253800d.svg)
Unlock your academic potential
Copyright © 2020–2026 A2Z Services. All Rights Reserved. Developed and managed by ZUCOL.