Vinamilk's Plant-Based Milk: Entering the International Market
VerifiedAdded on 2024/05/05
|46
|9379
|355
Report
AI Summary
This report analyzes Vinamilk's potential entry into the international plant-based milk market, specifically focusing on the UK and India. It begins with an overview of global trends favoring healthy and sustainable lifestyles and the growing plant-based milk market. The report then provides background information on Vinamilk, its business model, and value chain. A comparison of the UK and India is conducted, considering general, political, and economic environments. Market selection models, including preliminary screening (focusing on Western Europe and Asian Pacific), BERI, and MACS, are employed to assess market attractiveness and competitive strength. The report concludes that a joint venture is the most suitable market entry mode and outlines marketing tactics, including STP strategy, benchmarking, and pricing/distribution strategies, tailored for the chosen market, with a final consideration of product standardization versus adaptation.
TRƯỜNG ĐẠI HỌC NGOẠI THƯƠNG
CƠ SỞ II TẠI THÀNH PHỐ HỒ CHÍ MINH
---------***--------
MIDTERM ASSIGNMENT
Major: International Marketing
ANALYSIS OF VINAMILK’S PLANT-BASED MILK
INTO INTERNATIONAL MARKET
Lecturer: Nguyễn Thị Thu Thảo
Class code: ML124
Group: 07
Class: K60CLC6
Group members:
Nguyễn Thanh Thảo: 2112153158
Lê Trần Khánh Ngọc: 2112153110
Đào Ngọc Quỳnh Anh: 2112153004
Hà Anh Kiệt: 2112153071
Lê Thị Bảo Trâm: 2113153062
Vũ Thị Thu Hiền: 2012256009
Nguyễn Ngọc Đông Nghi: 2112153105
Ho Chi Minh City, March 2023
Paraphrase This Document
Need a fresh take? Get an instant paraphrase of this document with our AI Paraphraser
Table of contents
LIST OF TABLES ...................................................................................................... 3
LIST OF GRAPHS ..................................................................................................... 4
CHAPTER 1. EXECUTIVE SUMMARY AND GLOBAL OVERVIEW ................ 5
1.1. Executive Summary ......................................................................................... 5
1.2. Global Trend Overview.................................................................................... 5
1.3. Vinamilk ........................................................................................................... 6
1.3.1 Background information ............................................................................ 6
1.3.2. Plant-based milk overview ........................................................................ 7
1.3.3. Business model.......................................................................................... 7
1.3.4 Value chain ................................................................................................. 8
CHAPTER 2. OVERVIEW OF 2 PROMISING COUNTRIES .............................. 10
2.1. Overview of The UK & India ........................................................................ 10
2.1.1. General environment ............................................................................... 10
2.1.2. Political environment .............................................................................. 10
2.1.3. Economic environment ........................................................................... 11
CHAPTER 3. MODELS FOR MARKET SELECTION.......................................... 15
3.1 Market Comparison ......................................................................................... 15
3.2 Preliminary screening ...................................................................................... 15
3.2.1 Why Western Europe & Asian Pacific .................................................... 15
3.2.2 Why United Kingdom & India ................................................................. 16
3.3.3 Business Environment Risk Index (BERI) .............................................. 17
3.3 Fine-grained screening: MACS ...................................................................... 20
3.3.1 Market attractiveness ............................................................................... 20
3.3.2 Competitive strength ................................................................................ 22
3.4 Market Expansion Strategies and Market Choice ........................................... 24
3.4.1 Market Expansion Strategies ................................................................... 24
3.4.2 Market choice ........................................................................................... 24
CHAPTER 4. ENTRY MODE ................................................................................. 25
4.1. SWOT Analysis of Vinamilk ......................................................................... 25
4.2. Why Joint-venture in Intermediate mode? ..................................................... 27
4.3 Mid and long-term objectives ......................................................................... 27
CHAPTER 5. MARKETING TACTICS .................................................................. 29
5.1. STP Strategy ................................................................................................... 29
5.2. Benchmarking ................................................................................................ 30
5.3. Price Tactics ................................................................................................... 36
5.3.1. Oatly’s current price ................................................................................ 36
5.3.2. Vinamilk’s price opportunity .................................................................. 37
5.3.3. Strategy for Vinamilk .............................................................................. 37
5.4. Distribution Tactics ........................................................................................ 37
5.4.1. Oatly’s current distribution ..................................................................... 37
5.4.2. Vinamilk’s distribution opportunity........................................................ 37
5.4.3. Strategy for Vinamilk .............................................................................. 38
CHAPTER 6. CONCLUSION .................................................................................. 39
REFERENCE ............................................................................................................ 40
⊘ This is a preview!⊘
Do you want full access?
Subscribe today to unlock all pages.
Trusted by 1+ million students worldwide
LIST OF TABLES
Table 1.1: Health benefits among the global concern of consumers
Table 1.2: The business model of Vinamilk.
Table 1.3: Value chain analysis of Vinamilk
Table 3.1: BERI justification
Table 3.2: BERI scores
Table 3.3: Market attractiveness justification
Table 3.4: Market attractiveness scores
Table 3.5: Competitive strength justification
Table 3.6: Competitive strength scores
Table 4.1: Analysis of entry criteria for Vinamilk
Table 5.1: STP Strategy
Table 5.2: Benchmarking table
Table 5.3: Explanation table
Paraphrase This Document
Need a fresh take? Get an instant paraphrase of this document with our AI Paraphraser
LIST OF GRAPHS
Figure 2.1: Health benefits among the global concern of consumers
Figure 2.2: Consumer trends regarding sustainability
Figure 3.1: General marketing screening process
Figure 3.2: Import values for grains, oilseeds, and pulses in 2021
Figure 3.3: UK dairy alternatives market estimates and forecasts, 2014-2025 (USD Million),
by Smart Protein
Figure 3.4: Market Attractiveness/Competitive Strength matrix
CHAPTER 1. EXECUTIVE SUMMARY AND GLOBAL
OVERVIEW
1.1. Executive Summary
The goal of this study is to assess the potential impact of Vinamilk's entry into the
UK market and propose appropriate strategies for market entry. To demonstrate Vinamilk's
ability to enter new markets, this study will utilize the preliminary, detailed, and MACS
models, as well as information on global consumer trends and market conditions, to
determine the most suitable country for Vinamilk to enter. Joint venture will be the most
preferable market entry mode resulting from previous analysis. Key marketing strategies,
including product and communication tactics utilized specifically in the UK will also be
demonstrated. In conclusion, the concern of the extent of product standardization or
adaptation is included in the last section.
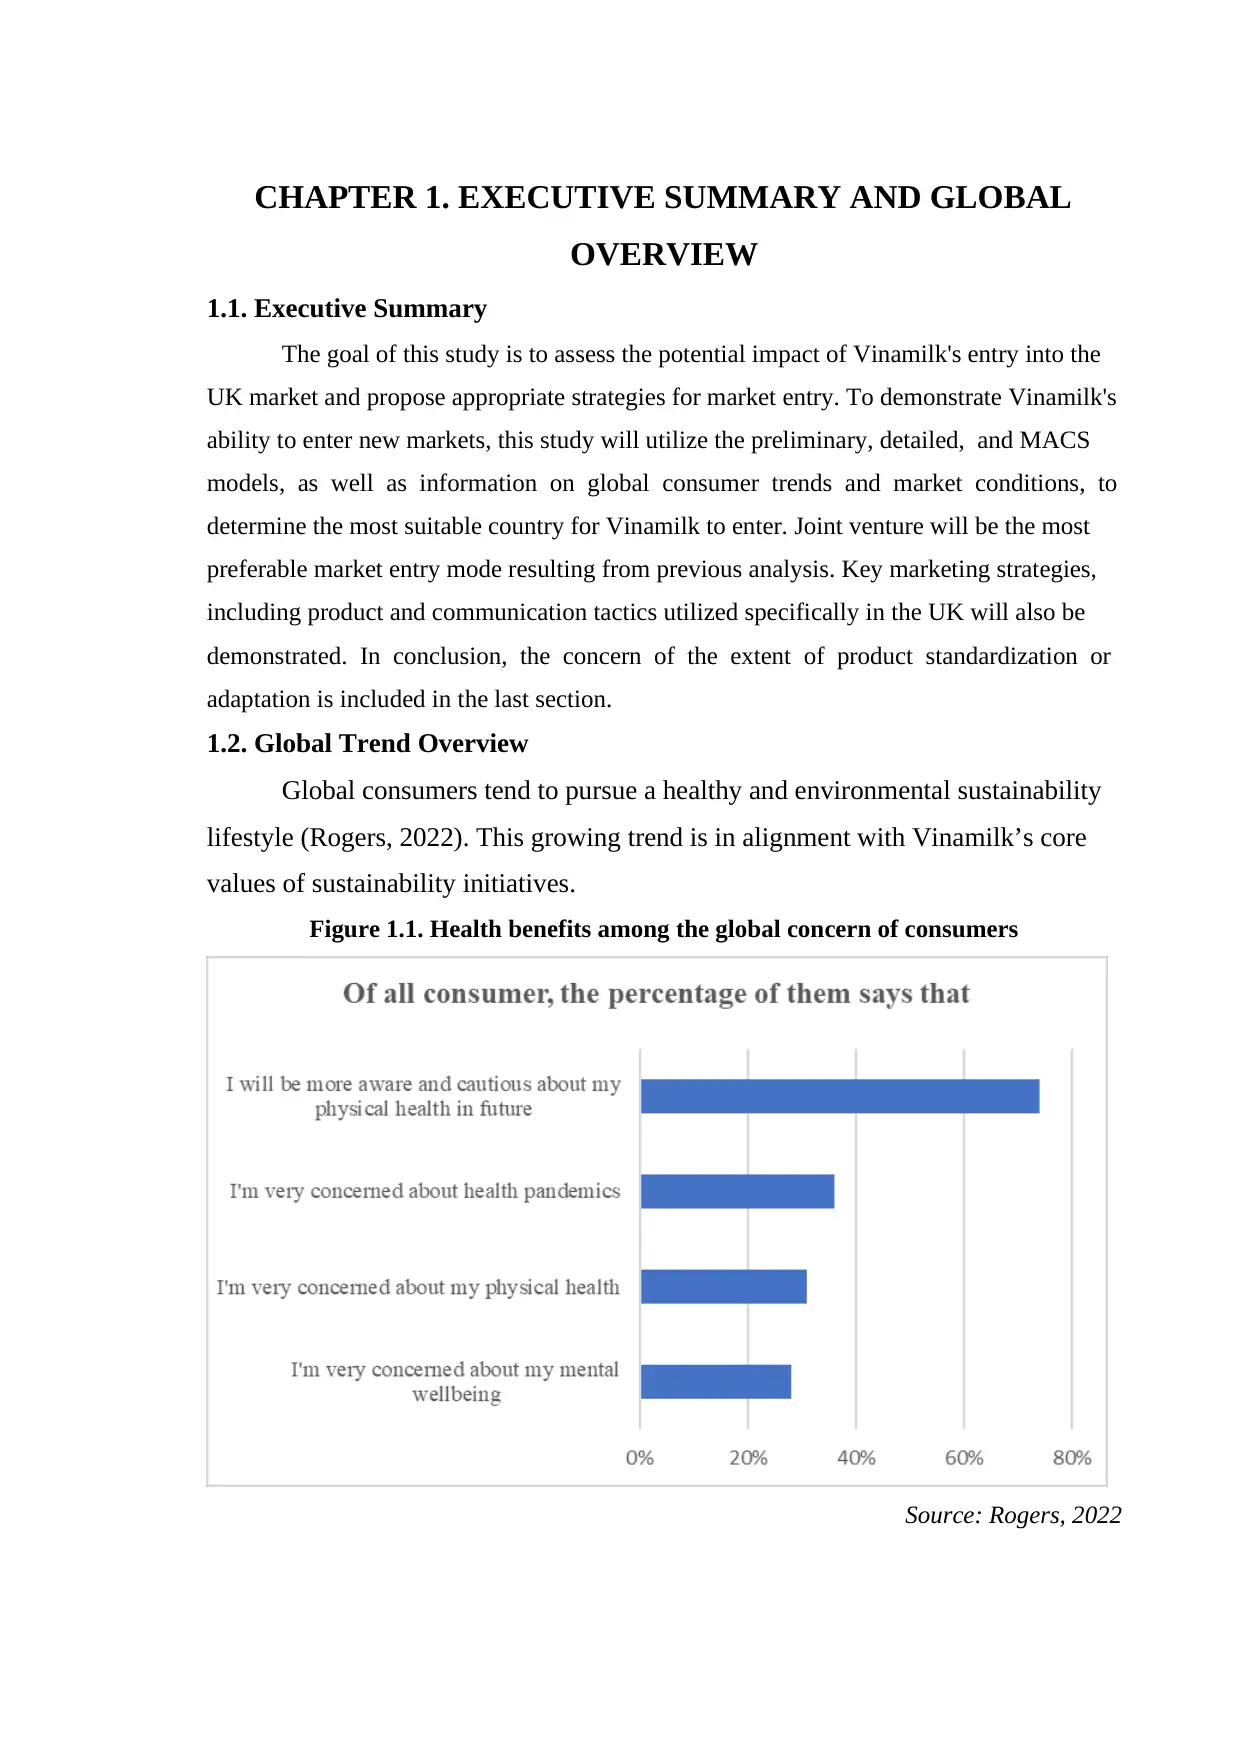
1.2. Global Trend Overview
Global consumers tend to pursue a healthy and environmental sustainability
lifestyle (Rogers, 2022). This growing trend is in alignment with Vinamilk’s core
values of sustainability initiatives.
Figure 1.1. Health benefits among the global concern of consumers
Source: Rogers, 2022
OVERVIEW
1.1. Executive Summary
The goal of this study is to assess the potential impact of Vinamilk's entry into the
UK market and propose appropriate strategies for market entry. To demonstrate Vinamilk's
ability to enter new markets, this study will utilize the preliminary, detailed, and MACS
models, as well as information on global consumer trends and market conditions, to
determine the most suitable country for Vinamilk to enter. Joint venture will be the most
preferable market entry mode resulting from previous analysis. Key marketing strategies,
including product and communication tactics utilized specifically in the UK will also be
demonstrated. In conclusion, the concern of the extent of product standardization or
adaptation is included in the last section.
1.2. Global Trend Overview
Global consumers tend to pursue a healthy and environmental sustainability
lifestyle (Rogers, 2022). This growing trend is in alignment with Vinamilk’s core
values of sustainability initiatives.
Figure 1.1. Health benefits among the global concern of consumers
Source: Rogers, 2022
⊘ This is a preview!⊘
Do you want full access?
Subscribe today to unlock all pages.
Trusted by 1+ million students worldwide
Based on this data, we can see that consumers intend to prioritize health and
wellness as a key factor driving their purchasing behavior in the coming years.
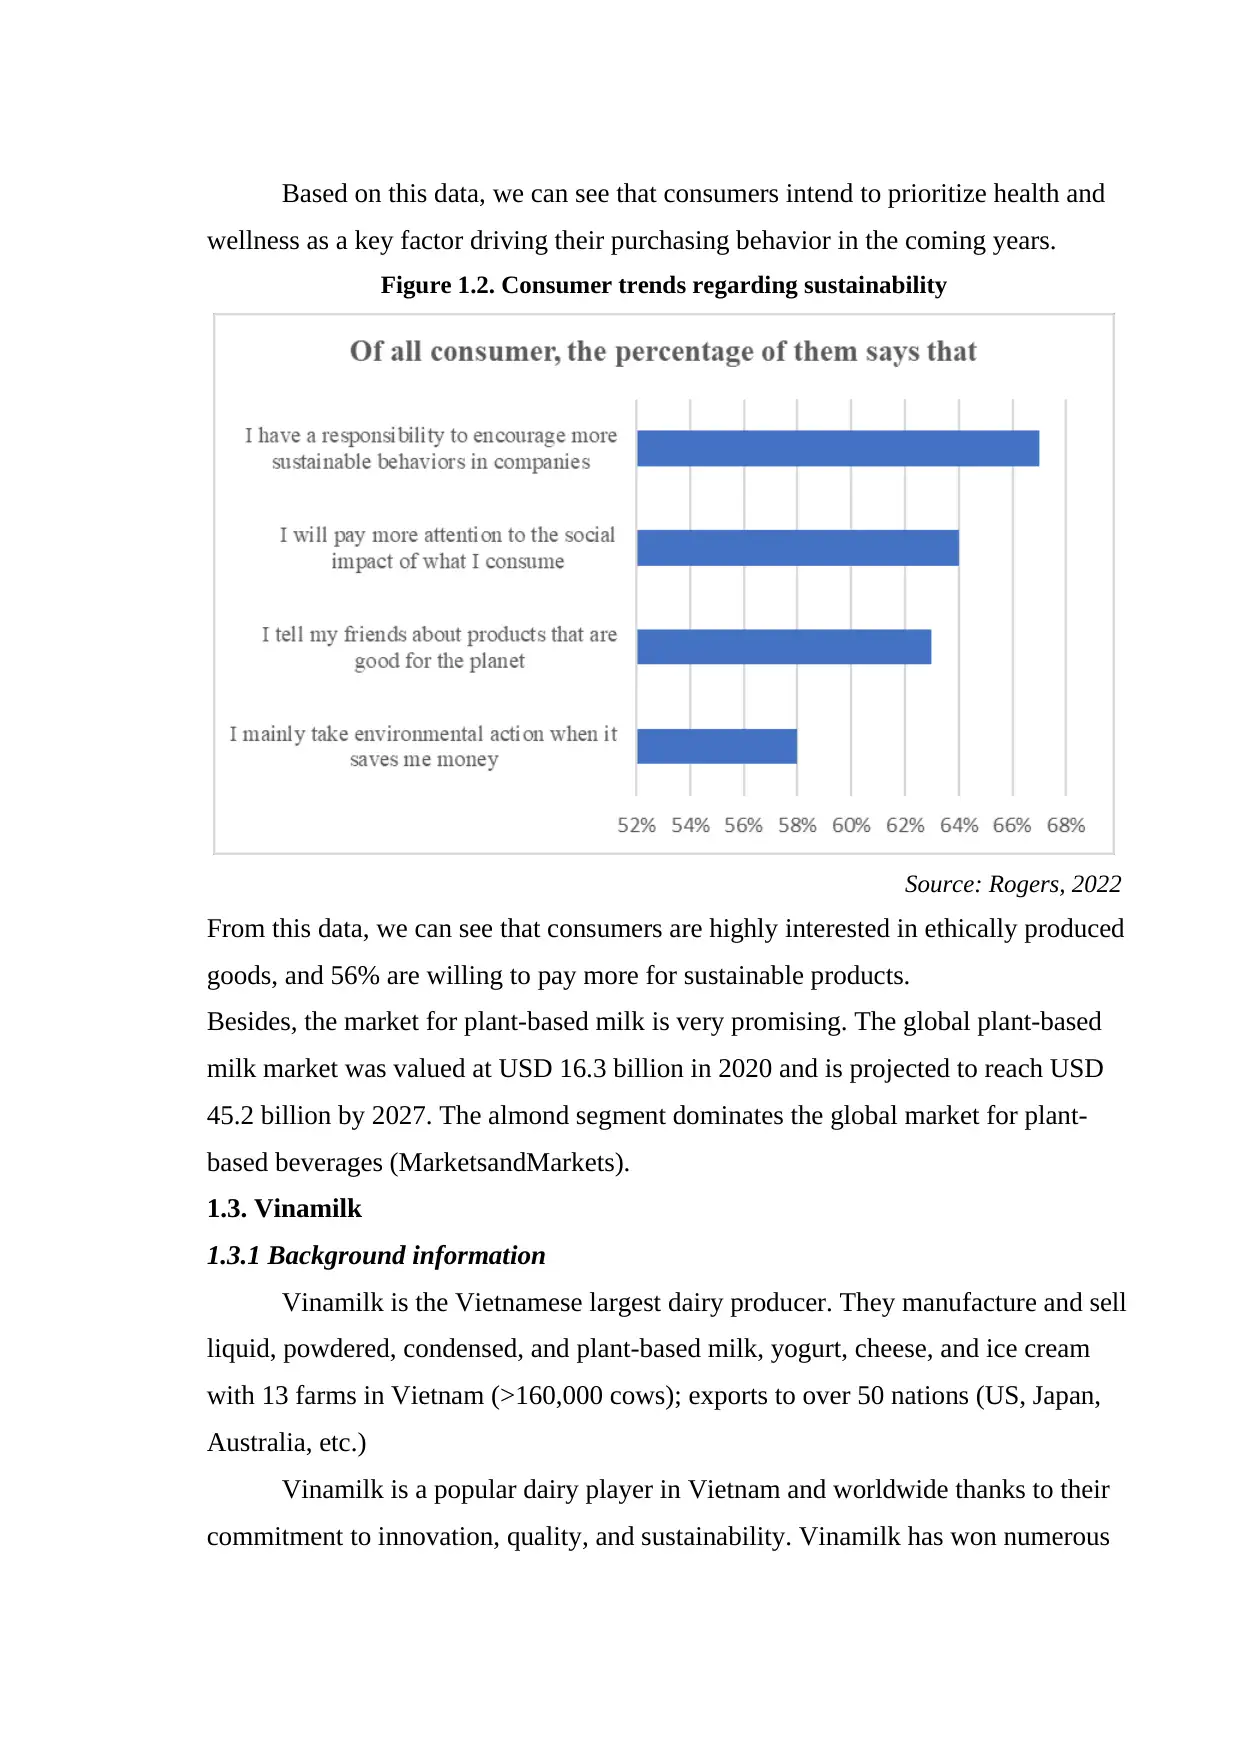
Figure 1.2. Consumer trends regarding sustainability
Source: Rogers, 2022
From this data, we can see that consumers are highly interested in ethically produced
goods, and 56% are willing to pay more for sustainable products.
Besides, the market for plant-based milk is very promising. The global plant-based
milk market was valued at USD 16.3 billion in 2020 and is projected to reach USD
45.2 billion by 2027. The almond segment dominates the global market for plant-
based beverages (MarketsandMarkets).
1.3. Vinamilk
1.3.1 Background information
Vinamilk is the Vietnamese largest dairy producer. They manufacture and sell
liquid, powdered, condensed, and plant-based milk, yogurt, cheese, and ice cream
with 13 farms in Vietnam (>160,000 cows); exports to over 50 nations (US, Japan,
Australia, etc.)
Vinamilk is a popular dairy player in Vietnam and worldwide thanks to their
commitment to innovation, quality, and sustainability. Vinamilk has won numerous
wellness as a key factor driving their purchasing behavior in the coming years.
Figure 1.2. Consumer trends regarding sustainability
Source: Rogers, 2022
From this data, we can see that consumers are highly interested in ethically produced
goods, and 56% are willing to pay more for sustainable products.
Besides, the market for plant-based milk is very promising. The global plant-based
milk market was valued at USD 16.3 billion in 2020 and is projected to reach USD
45.2 billion by 2027. The almond segment dominates the global market for plant-
based beverages (MarketsandMarkets).
1.3. Vinamilk
1.3.1 Background information
Vinamilk is the Vietnamese largest dairy producer. They manufacture and sell
liquid, powdered, condensed, and plant-based milk, yogurt, cheese, and ice cream
with 13 farms in Vietnam (>160,000 cows); exports to over 50 nations (US, Japan,
Australia, etc.)
Vinamilk is a popular dairy player in Vietnam and worldwide thanks to their
commitment to innovation, quality, and sustainability. Vinamilk has won numerous
Paraphrase This Document
Need a fresh take? Get an instant paraphrase of this document with our AI Paraphraser
awards, including Forbes Asia's "Fabulous 50" in 2015, 2016, and 2018; ASEAN
Corporate Sustainability Award, Top 50 Best Listed Companies in Vietnam for
Sustainability Report (2020) and become one of the top five milk brands worldwide
(Global Food and Beverage Industry Report).
1.3.2. Plant-based milk overview
Regarding volume growth, Millennials’ organic interest results in 369
million liters consumption in Q1/2020 (GSO).
Distribution networks, grocery shopping, supermarkets, and health food
stores. During Covid-19, home delivery for busy, high-income young consumers
drove online sales.
Concerning exportation, Vinamilk exported 85 containers to Korea in 2020
and 10 containers of seed milk to China in 2021.
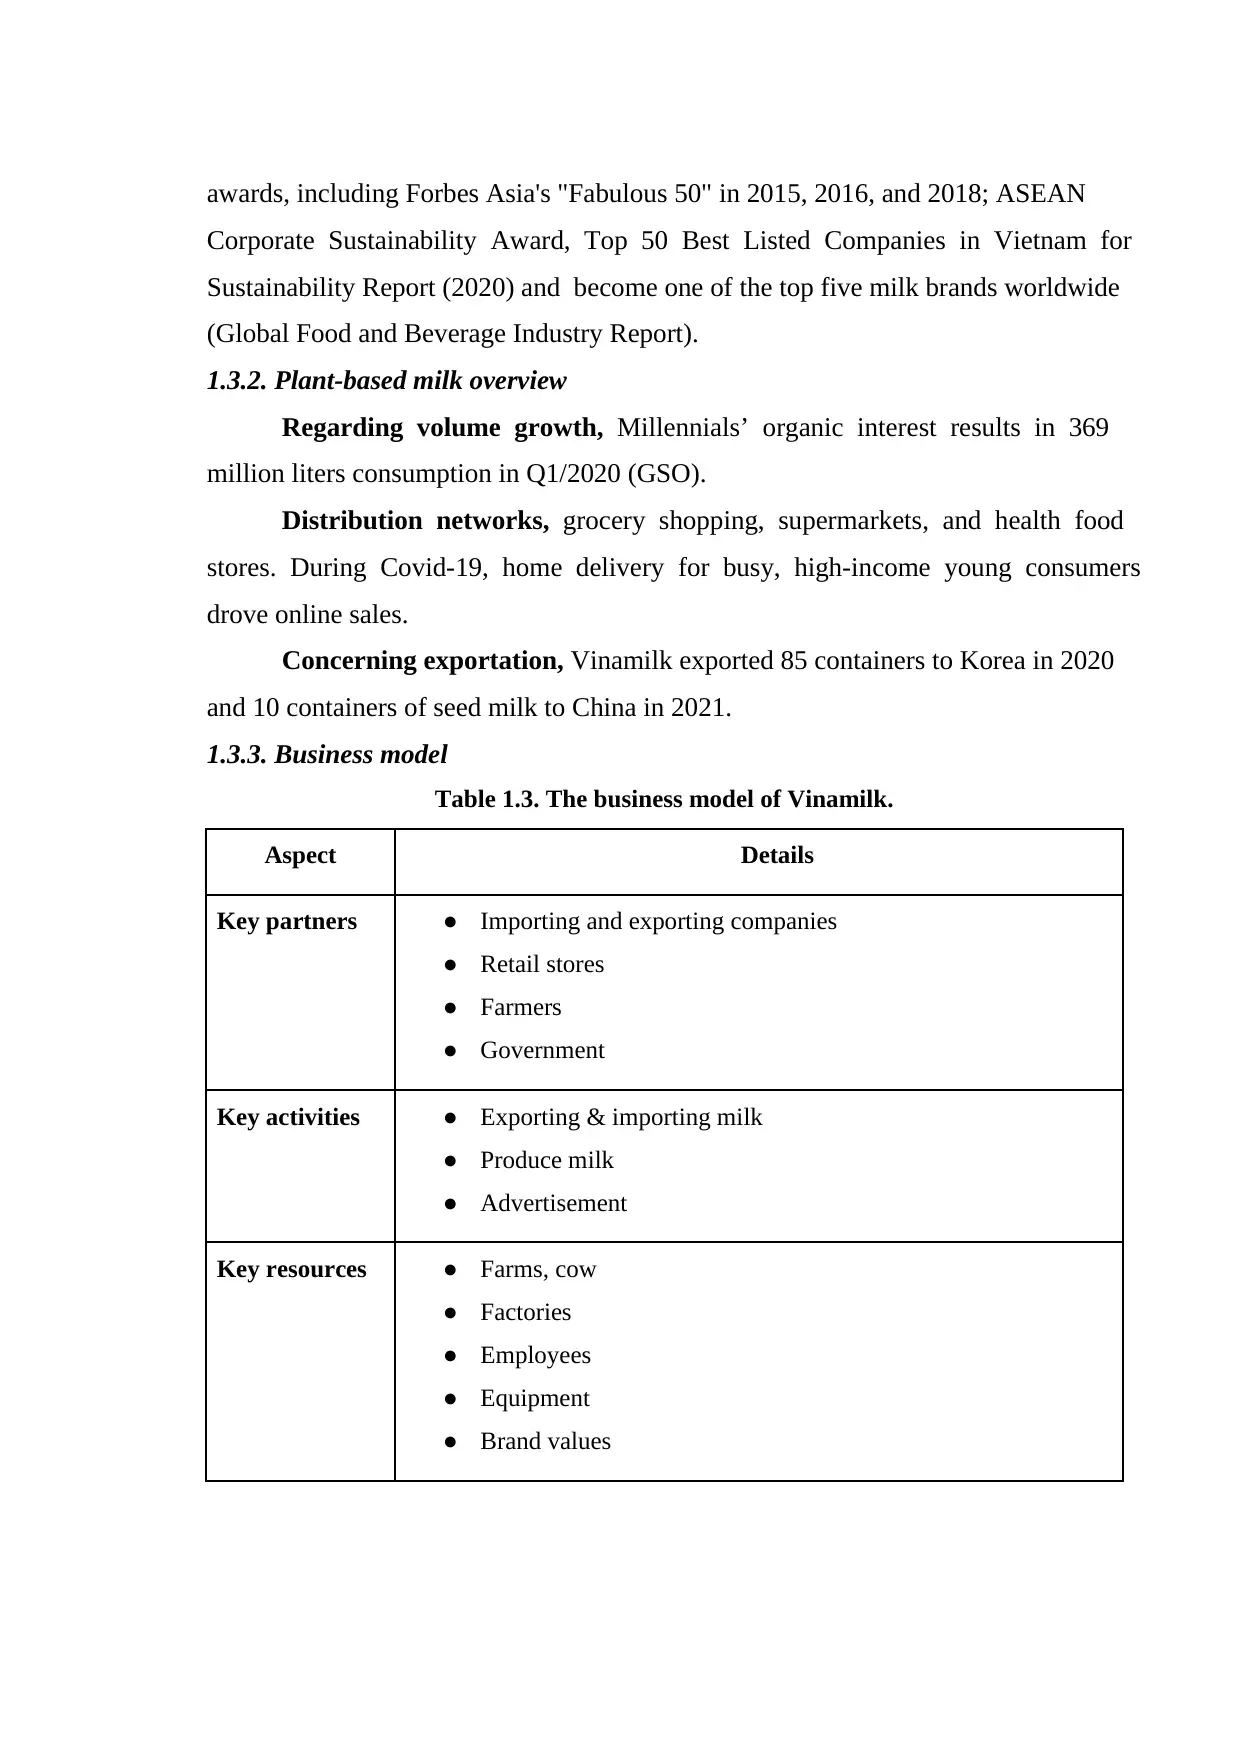
1.3.3. Business model
Table 1.3. The business model of Vinamilk.
Aspect Details
Key partners ● Importing and exporting companies
● Retail stores
● Farmers
● Government
Key activities ● Exporting & importing milk
● Produce milk
● Advertisement
Key resources ● Farms, cow
● Factories
● Employees
● Equipment
● Brand values
Corporate Sustainability Award, Top 50 Best Listed Companies in Vietnam for
Sustainability Report (2020) and become one of the top five milk brands worldwide
(Global Food and Beverage Industry Report).
1.3.2. Plant-based milk overview
Regarding volume growth, Millennials’ organic interest results in 369
million liters consumption in Q1/2020 (GSO).
Distribution networks, grocery shopping, supermarkets, and health food
stores. During Covid-19, home delivery for busy, high-income young consumers
drove online sales.
Concerning exportation, Vinamilk exported 85 containers to Korea in 2020
and 10 containers of seed milk to China in 2021.
1.3.3. Business model
Table 1.3. The business model of Vinamilk.
Aspect Details
Key partners ● Importing and exporting companies
● Retail stores
● Farmers
● Government
Key activities ● Exporting & importing milk
● Produce milk
● Advertisement
Key resources ● Farms, cow
● Factories
● Employees
● Equipment
● Brand values
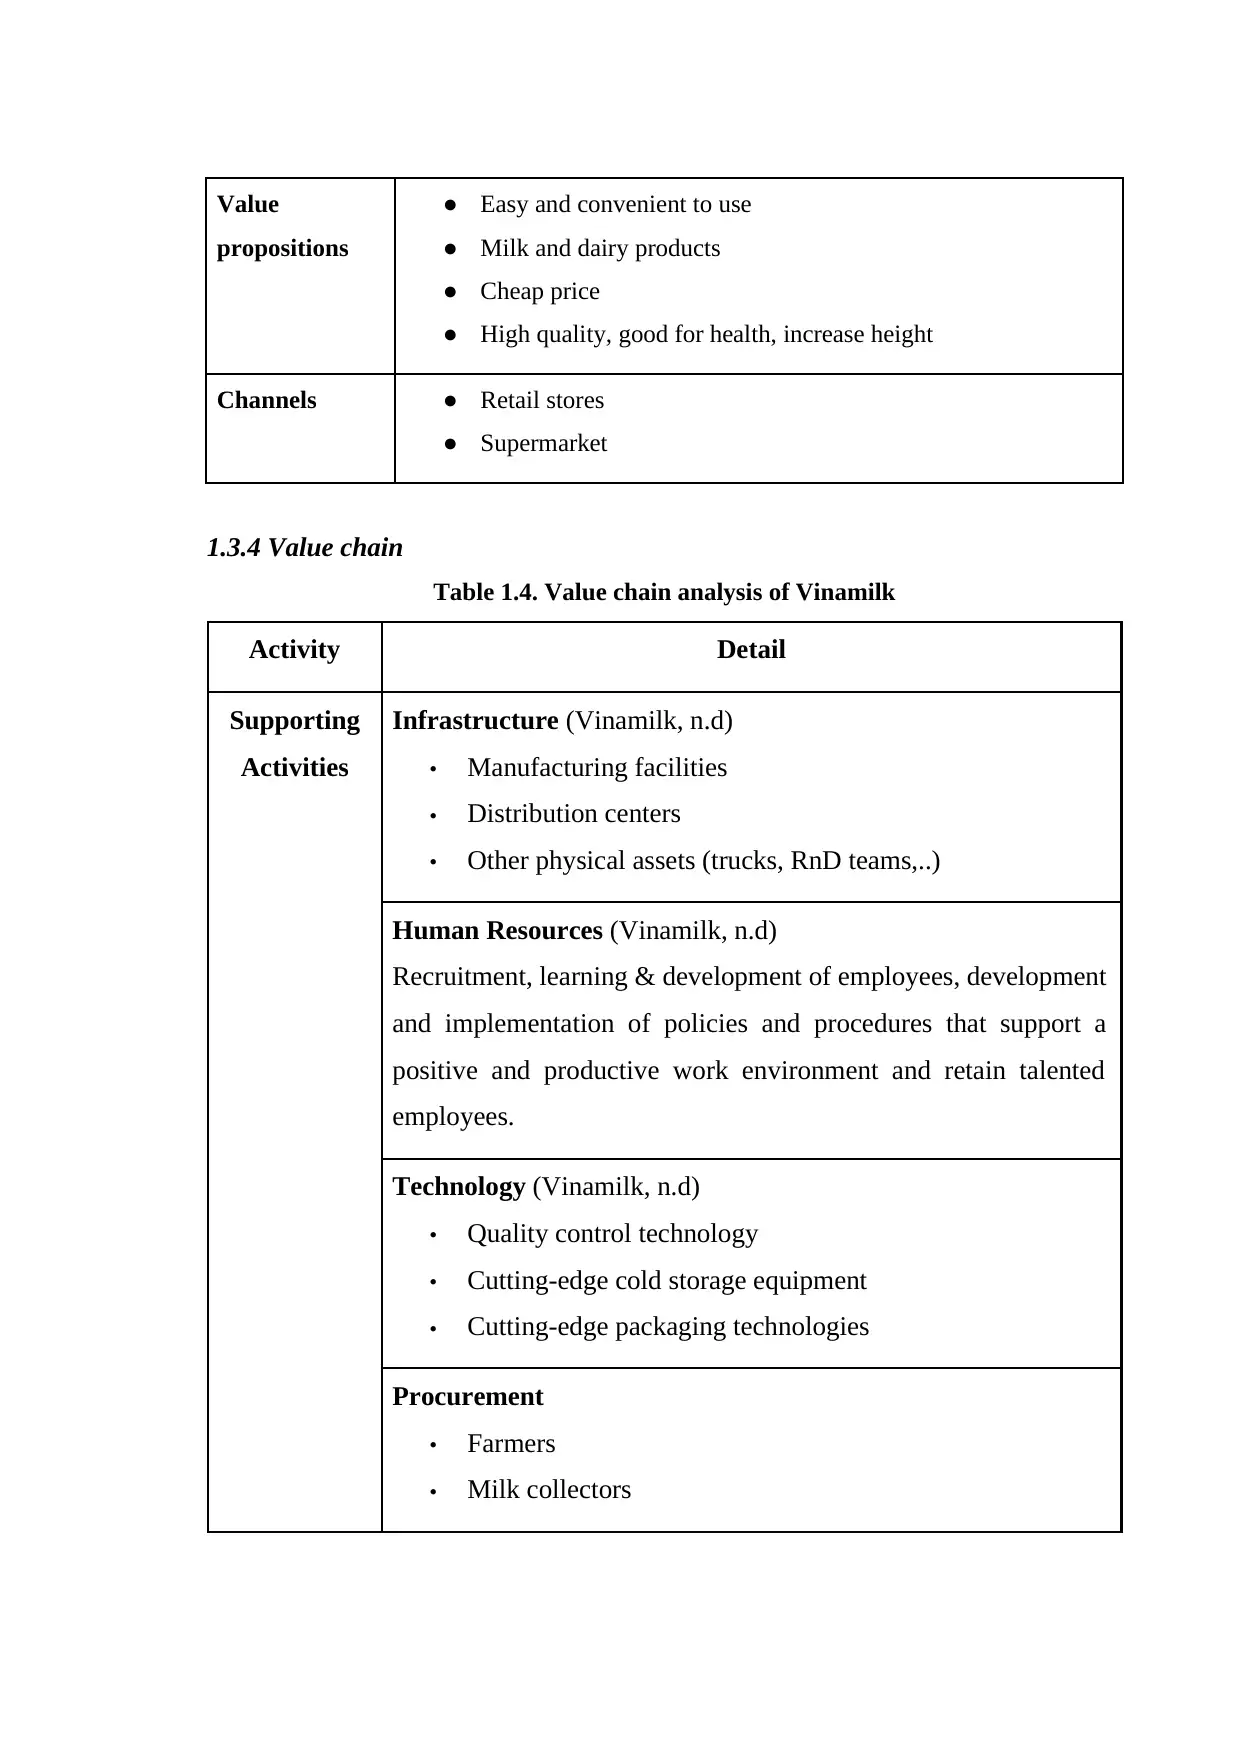
Value
propositions
● Easy and convenient to use
● Milk and dairy products
● Cheap price
● High quality, good for health, increase height
Channels ● Retail stores
● Supermarket
1.3.4 Value chain
Table 1.4. Value chain analysis of Vinamilk
Activity Detail
Supporting
Activities
Infrastructure (Vinamilk, n.d)
• Manufacturing facilities
• Distribution centers
• Other physical assets (trucks, RnD teams,..)
Human Resources (Vinamilk, n.d)
Recruitment, learning & development of employees, development
and implementation of policies and procedures that support a
positive and productive work environment and retain talented
employees.
Technology (Vinamilk, n.d)
• Quality control technology
• Cutting-edge cold storage equipment
• Cutting-edge packaging technologies
Procurement
• Farmers
• Milk collectors
⊘ This is a preview!⊘
Do you want full access?
Subscribe today to unlock all pages.
Trusted by 1+ million students worldwide
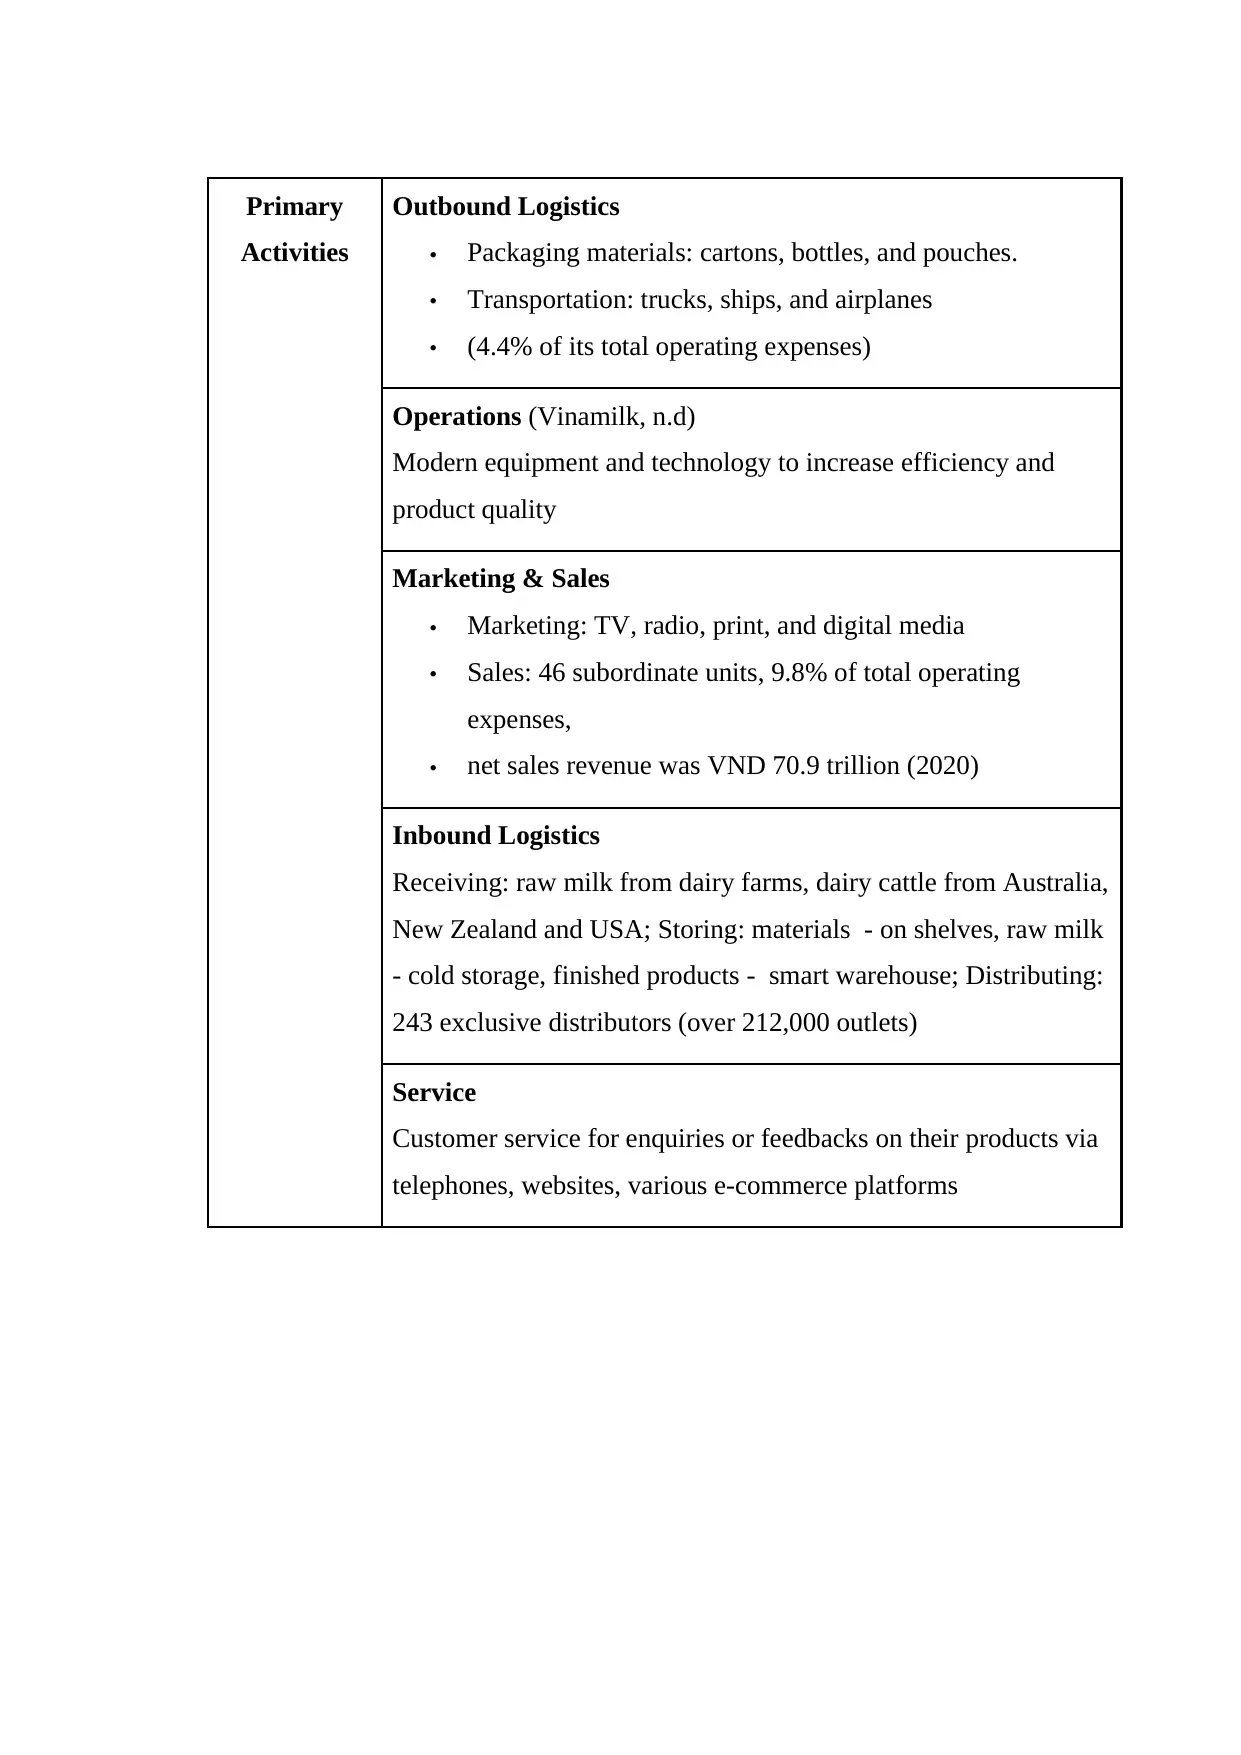
Primary
Activities
Outbound Logistics
• Packaging materials: cartons, bottles, and pouches.
• Transportation: trucks, ships, and airplanes
• (4.4% of its total operating expenses)
Operations (Vinamilk, n.d)
Modern equipment and technology to increase efficiency and
product quality
Marketing & Sales
• Marketing: TV, radio, print, and digital media
• Sales: 46 subordinate units, 9.8% of total operating
expenses,
• net sales revenue was VND 70.9 trillion (2020)
Inbound Logistics
Receiving: raw milk from dairy farms, dairy cattle from Australia,
New Zealand and USA; Storing: materials - on shelves, raw milk
- cold storage, finished products - smart warehouse; Distributing:
243 exclusive distributors (over 212,000 outlets)
Service
Customer service for enquiries or feedbacks on their products via
telephones, websites, various e-commerce platforms
Paraphrase This Document
Need a fresh take? Get an instant paraphrase of this document with our AI Paraphraser
CHAPTER 2. OVERVIEW OF 2 PROMISING COUNTRIES
2.1. Overview of The UK & India
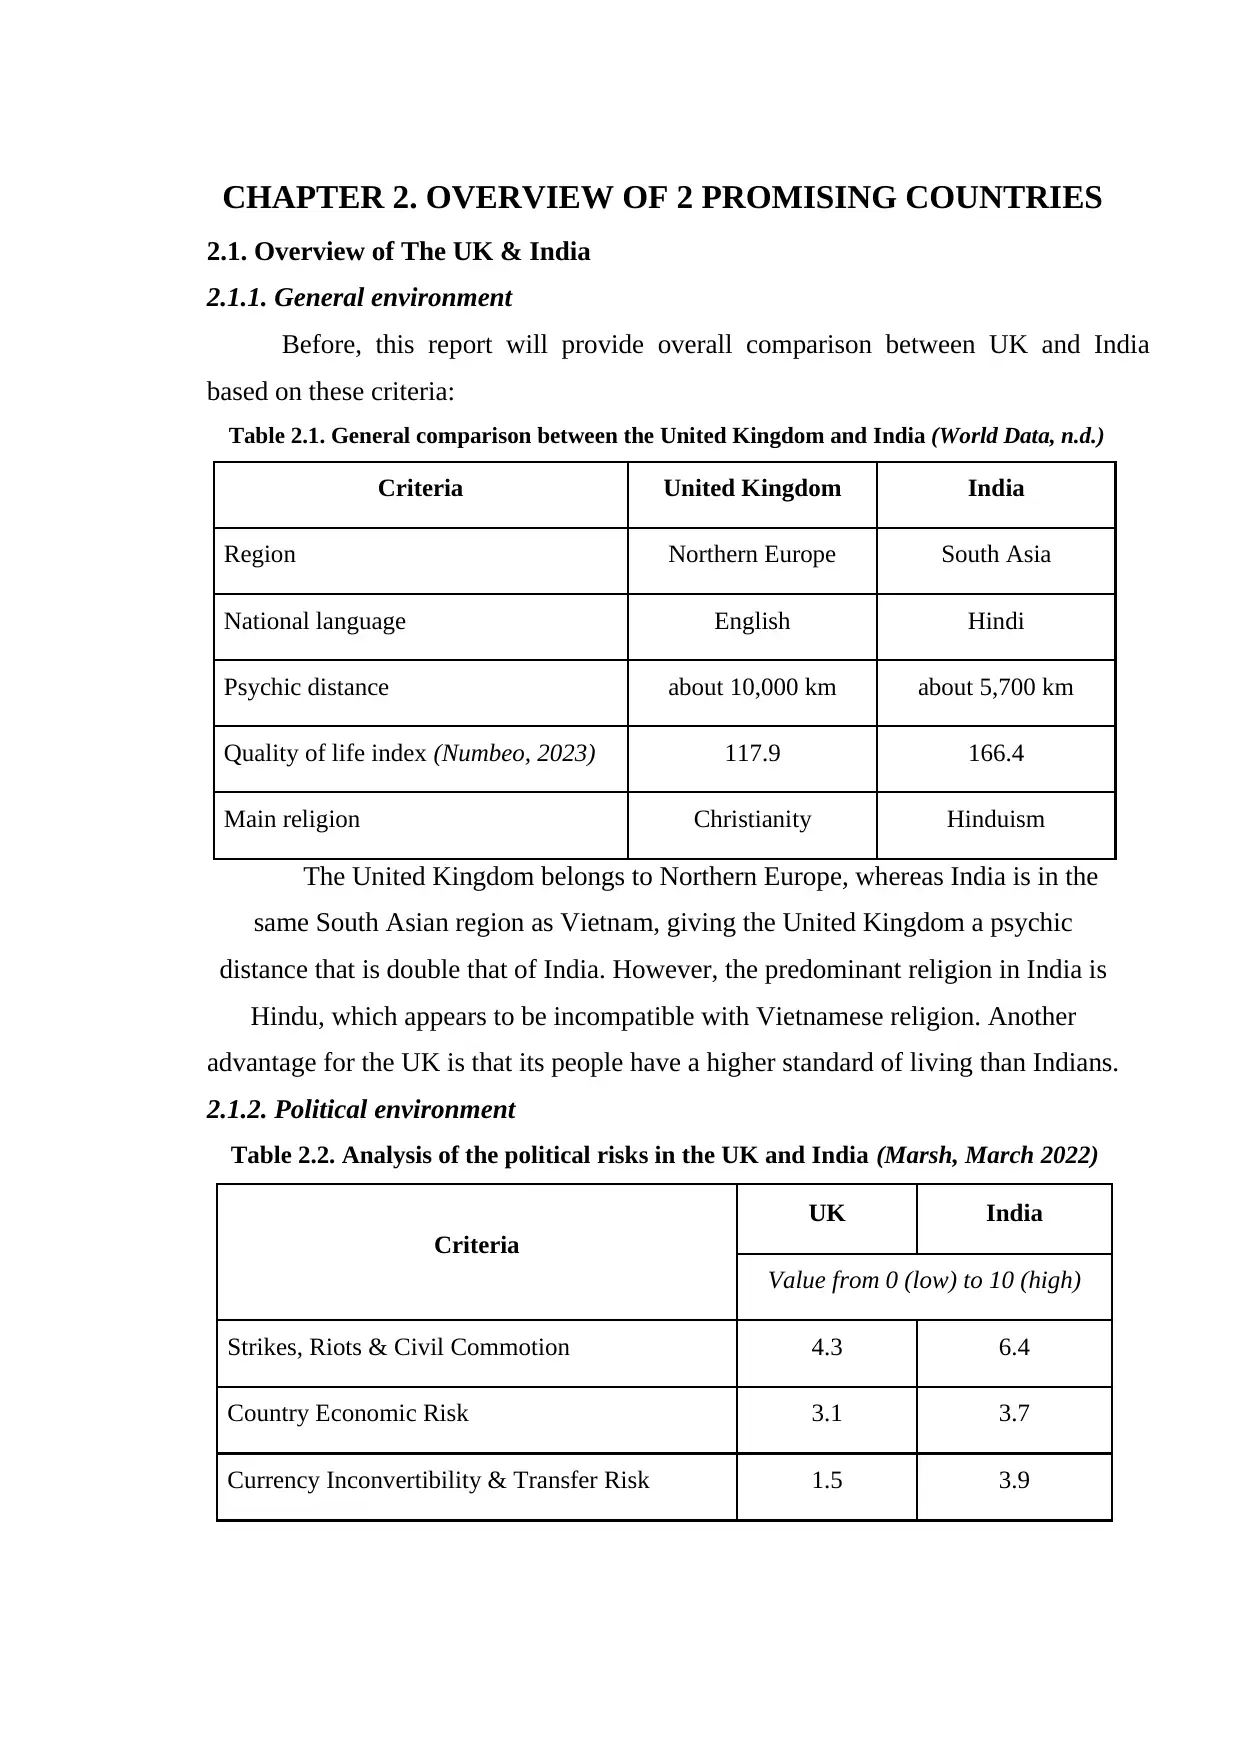
2.1.1. General environment
Before, this report will provide overall comparison between UK and India
based on these criteria:
Table 2.1. General comparison between the United Kingdom and India (World Data, n.d.)
Criteria United Kingdom India
Region Northern Europe South Asia
National language English Hindi
Psychic distance about 10,000 km about 5,700 km
Quality of life index (Numbeo, 2023) 117.9 166.4
Main religion Christianity Hinduism
The United Kingdom belongs to Northern Europe, whereas India is in the
same South Asian region as Vietnam, giving the United Kingdom a psychic
distance that is double that of India. However, the predominant religion in India is
Hindu, which appears to be incompatible with Vietnamese religion. Another
advantage for the UK is that its people have a higher standard of living than Indians.
2.1.2. Political environment
Table 2.2. Analysis of the political risks in the UK and India (Marsh, March 2022)
Criteria
UK India
Value from 0 (low) to 10 (high)
Strikes, Riots & Civil Commotion 4.3 6.4
Country Economic Risk 3.1 3.7
Currency Inconvertibility & Transfer Risk 1.5 3.9
2.1. Overview of The UK & India
2.1.1. General environment
Before, this report will provide overall comparison between UK and India
based on these criteria:
Table 2.1. General comparison between the United Kingdom and India (World Data, n.d.)
Criteria United Kingdom India
Region Northern Europe South Asia
National language English Hindi
Psychic distance about 10,000 km about 5,700 km
Quality of life index (Numbeo, 2023) 117.9 166.4
Main religion Christianity Hinduism
The United Kingdom belongs to Northern Europe, whereas India is in the
same South Asian region as Vietnam, giving the United Kingdom a psychic
distance that is double that of India. However, the predominant religion in India is
Hindu, which appears to be incompatible with Vietnamese religion. Another
advantage for the UK is that its people have a higher standard of living than Indians.
2.1.2. Political environment
Table 2.2. Analysis of the political risks in the UK and India (Marsh, March 2022)
Criteria
UK India
Value from 0 (low) to 10 (high)
Strikes, Riots & Civil Commotion 4.3 6.4
Country Economic Risk 3.1 3.7
Currency Inconvertibility & Transfer Risk 1.5 3.9
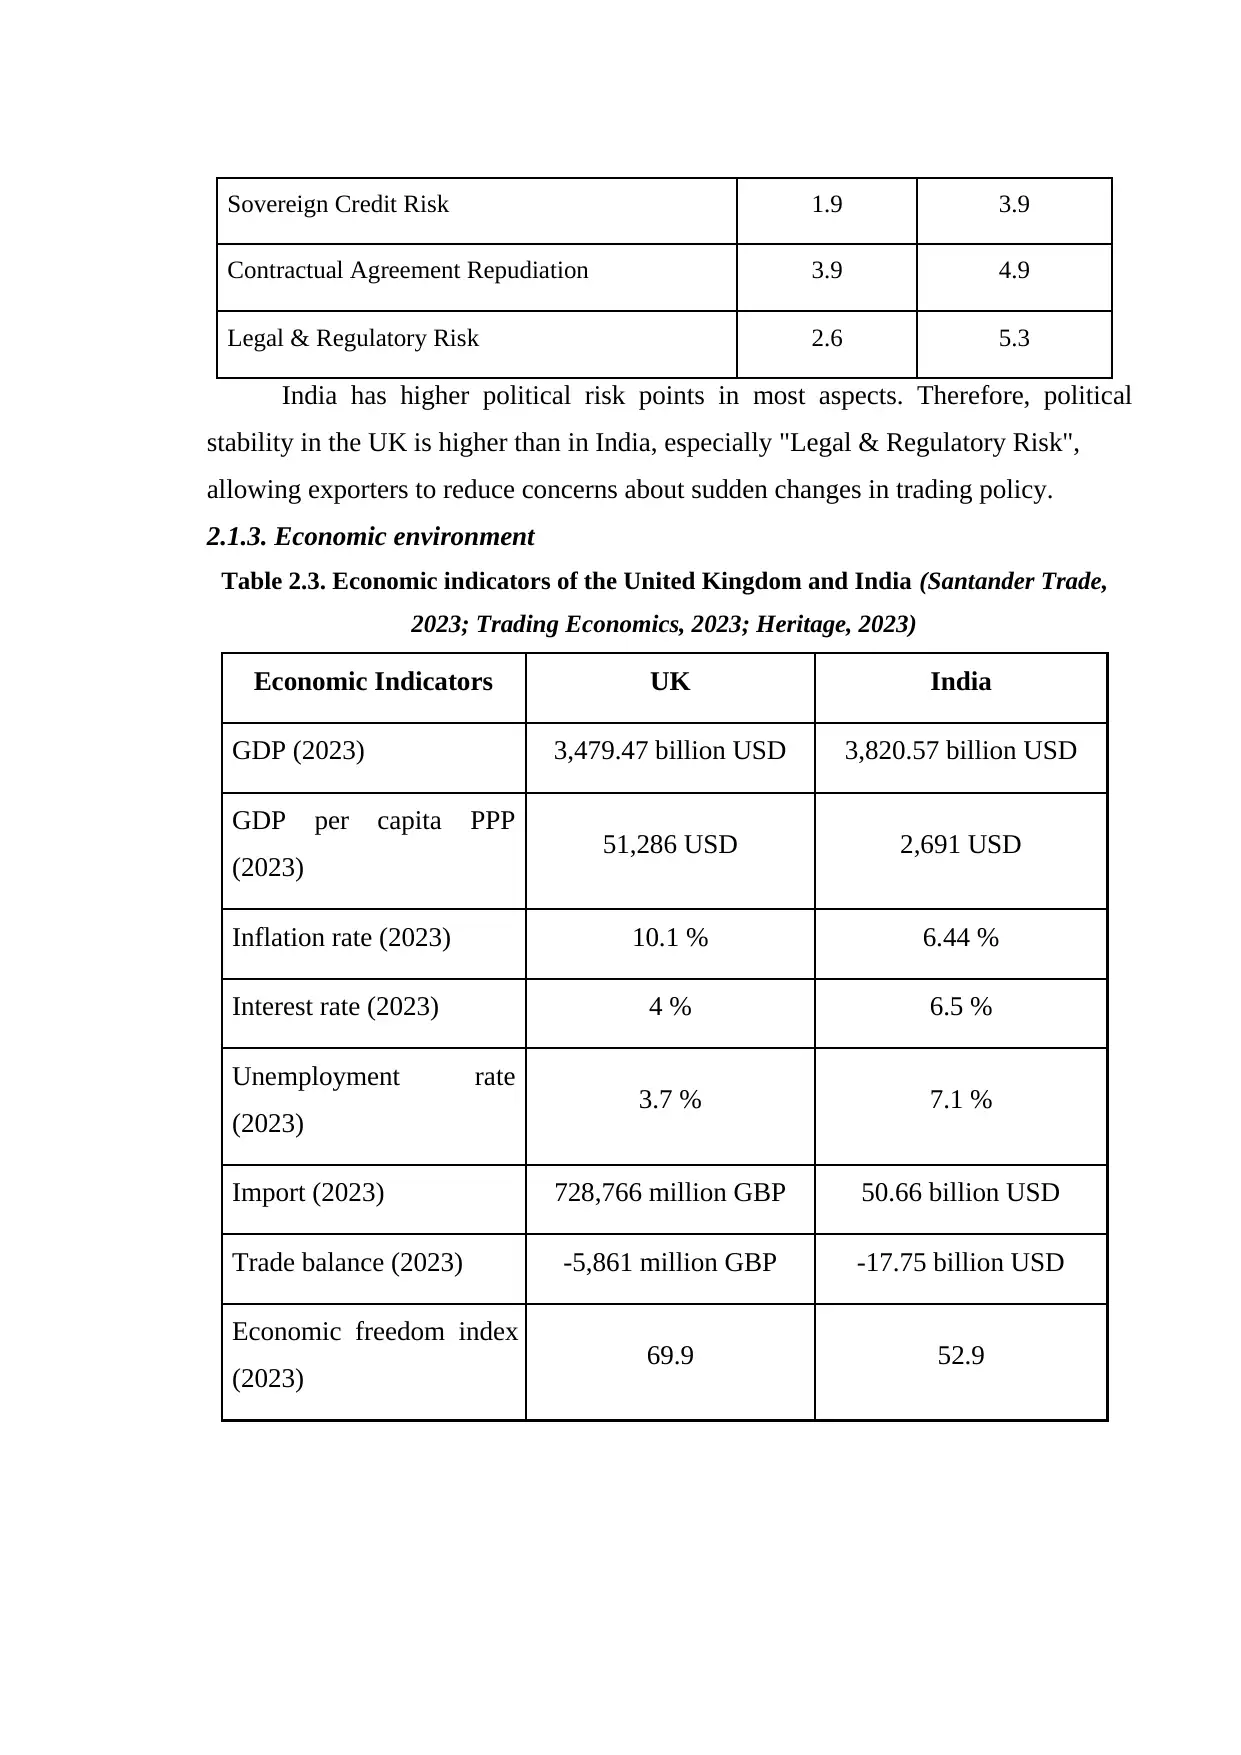
Sovereign Credit Risk 1.9 3.9
Contractual Agreement Repudiation 3.9 4.9
Legal & Regulatory Risk 2.6 5.3
India has higher political risk points in most aspects. Therefore, political
stability in the UK is higher than in India, especially "Legal & Regulatory Risk",
allowing exporters to reduce concerns about sudden changes in trading policy.
2.1.3. Economic environment
Table 2.3. Economic indicators of the United Kingdom and India (Santander Trade,
2023; Trading Economics, 2023; Heritage, 2023)
Economic Indicators UK India
GDP (2023) 3,479.47 billion USD 3,820.57 billion USD
GDP per capita PPP
(2023) 51,286 USD 2,691 USD
Inflation rate (2023) 10.1 % 6.44 %
Interest rate (2023) 4 % 6.5 %
Unemployment rate
(2023) 3.7 % 7.1 %
Import (2023) 728,766 million GBP 50.66 billion USD
Trade balance (2023) -5,861 million GBP -17.75 billion USD
Economic freedom index
(2023) 69.9 52.9
⊘ This is a preview!⊘
Do you want full access?
Subscribe today to unlock all pages.
Trusted by 1+ million students worldwide
1 out of 46
Your All-in-One AI-Powered Toolkit for Academic Success.
+13062052269
info@desklib.com
Available 24*7 on WhatsApp / Email
![[object Object]](/_next/static/media/star-bottom.7253800d.svg)
Unlock your academic potential
Copyright © 2020–2026 A2Z Services. All Rights Reserved. Developed and managed by ZUCOL.