Managerial Accounting Report: Virgin Australia Executive Pay Analysis
VerifiedAdded on 2021/06/18
|19
|4465
|356
Report
AI Summary
This managerial accounting report provides an in-depth analysis of Virgin Australia's remuneration practices. It examines financial and non-financial indicators, goal congruence, and the application of a balanced scorecard to assess executive pay. The report reviews the remuneration committee's details, allocation of executive compensation, and the mix of performance measures used, including STI and LTI. It evaluates the company's performance against executive pay, revealing a concerning trend of increasing executive remuneration despite declining company performance. The analysis also covers the company's adherence to ethical practices. The study concludes with recommendations for improvement based on the evaluation of financial and non-financial indicators, goal congruence, and the balanced scorecard, highlighting areas for potential enhancement in Virgin Australia's remuneration strategies.
Running head: MANAGERIAL ACCOUNTING
Managerial Accounting
Name of Student:
Name of University:
Author’s Note:
Managerial Accounting
Name of Student:
Name of University:
Author’s Note:
Paraphrase This Document
Need a fresh take? Get an instant paraphrase of this document with our AI Paraphraser
1MANAGERIAL ACCOUNTING
1.0 Executive Summary
The depictions of the report aim to address the various areas of the study which are seen to be
associated to the financial and the non-financial indicators, goal congruence and use of balanced
scorecard. The company review has been considered with the discussion on the different types of
the important aspects of the raptor which are seen to be related to the details of the remuneration
committee members, allocation of the executive remuneration and the analysis of the
performance measures of the STI and LTI. The section of the study has also evaluated the
performance of the company in terms of the executive pay. This section is seen to be followed by
the summary of the finds. Some of the latter part of the discussions has focused on the analysis
of the remuneration method are considered as per the previously reviewed topic of financial and
non-financial indicators, goal congruence and preparation of a balanced scorecard. The different
finds of the study have been able to suggest that the company discloses the main form of the
remuneration a per the fixed remuneration, LTI and STI. In addition to this, the company has
been seen to be following unethical approach for the remunerating the executives. This has been
seen to be evident with increasing nature of the executive remuneration despite of the decreasing
performance of the company.
2MANAGERIAL ACCOUNTING
Table of Contents
2. Introduction..................................................................................................................................4
3. Topic and Literature Review.......................................................................................................4
3.1 Financial and Non-Financial Indicator..................................................................................5
3.2 Goal Congruence...................................................................................................................7
3.3 Balanced Score Card..............................................................................................................8
4. Company Review.........................................................................................................................9
4.1 Details of remuneration committee and its membership:..........................................................9
4.2 Allocation of executive remuneration:................................................................................10
4.3 Mix of performance measures used:....................................................................................11
4.4 Company performance versus executive pay:.....................................................................12
6.0 Analysis of the remuneration Methods....................................................................................13
6.1 Financial and Non-Financial Indicator................................................................................13
6.2 Goal Congruence.................................................................................................................16
6.3 Balanced Score Card............................................................................................................16
7.0 Recommendation.....................................................................................................................16
8.0 Conclusion...............................................................................................................................17
9.0 Reference List..........................................................................................................................18
⊘ This is a preview!⊘
Do you want full access?
Subscribe today to unlock all pages.
Trusted by 1+ million students worldwide
3MANAGERIAL ACCOUNTING
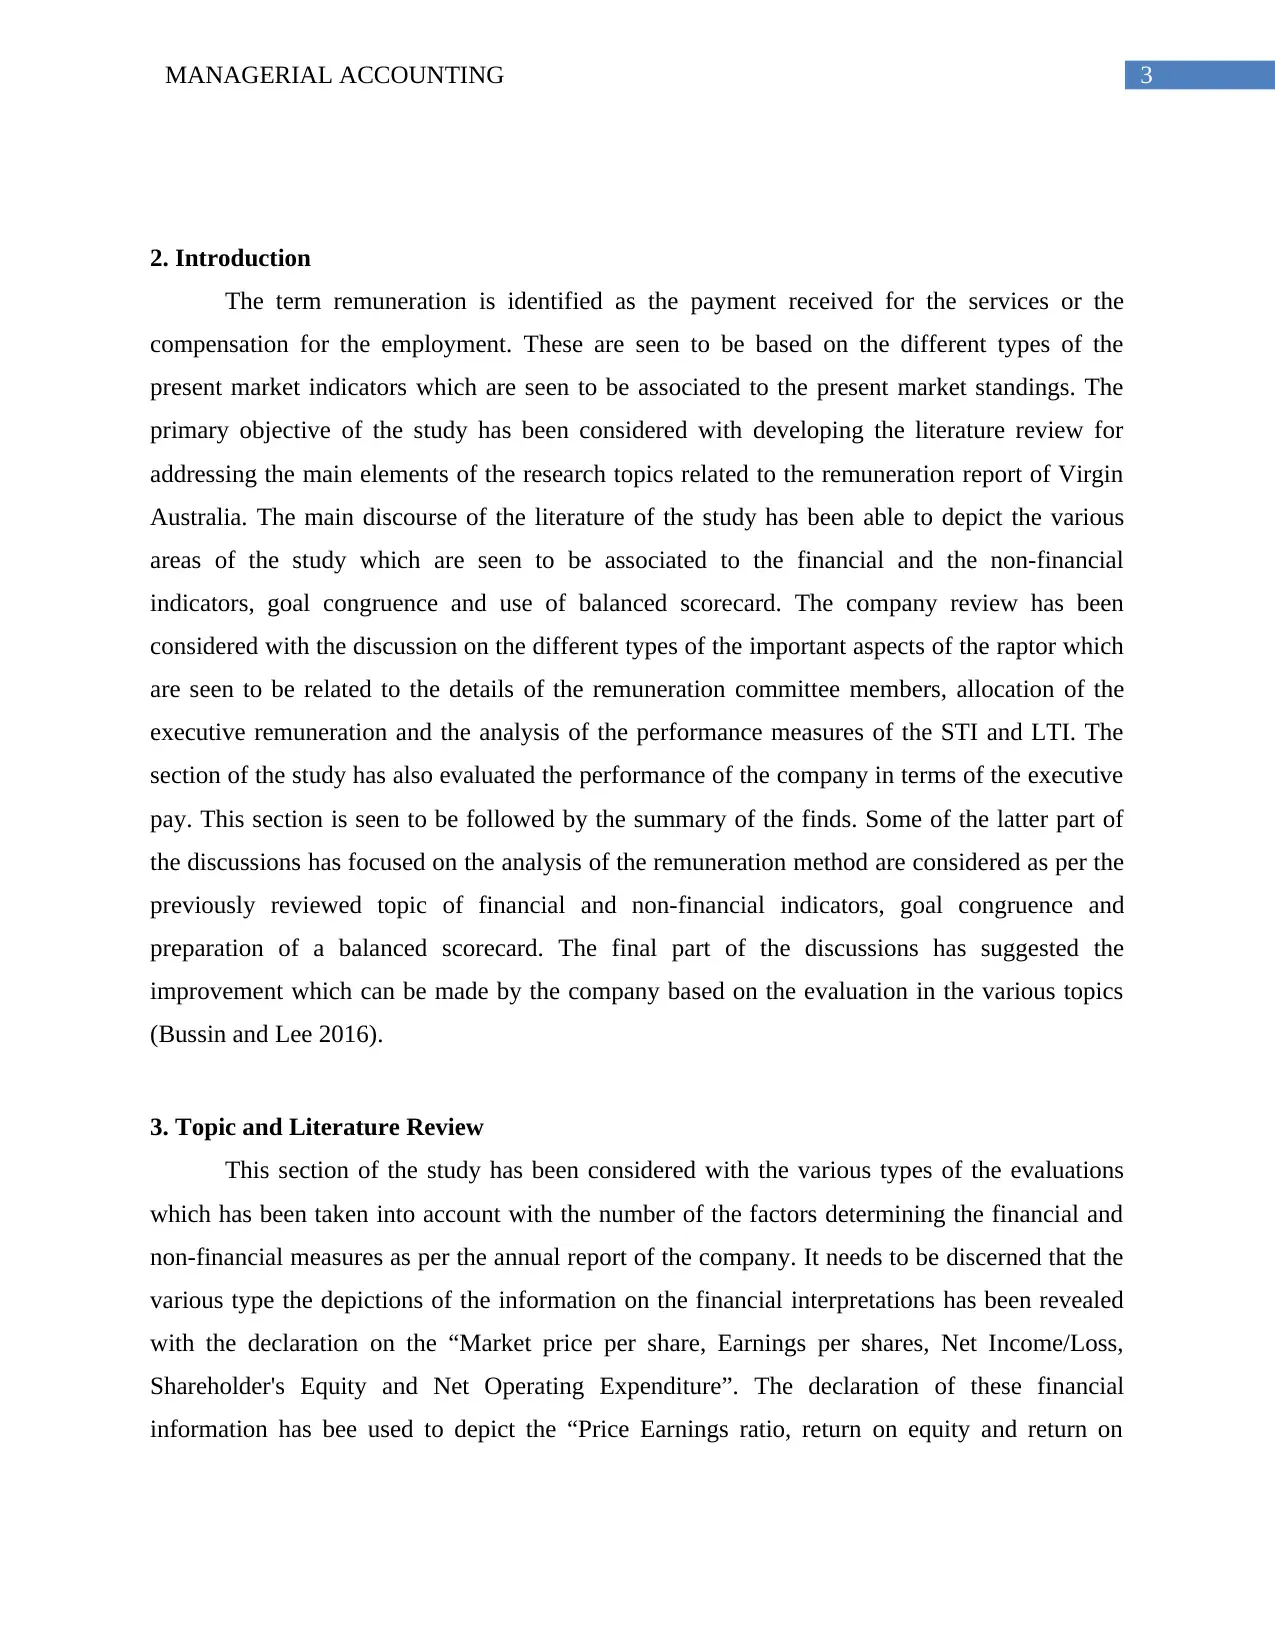
2. Introduction
The term remuneration is identified as the payment received for the services or the
compensation for the employment. These are seen to be based on the different types of the
present market indicators which are seen to be associated to the present market standings. The
primary objective of the study has been considered with developing the literature review for
addressing the main elements of the research topics related to the remuneration report of Virgin
Australia. The main discourse of the literature of the study has been able to depict the various
areas of the study which are seen to be associated to the financial and the non-financial
indicators, goal congruence and use of balanced scorecard. The company review has been
considered with the discussion on the different types of the important aspects of the raptor which
are seen to be related to the details of the remuneration committee members, allocation of the
executive remuneration and the analysis of the performance measures of the STI and LTI. The
section of the study has also evaluated the performance of the company in terms of the executive
pay. This section is seen to be followed by the summary of the finds. Some of the latter part of
the discussions has focused on the analysis of the remuneration method are considered as per the
previously reviewed topic of financial and non-financial indicators, goal congruence and
preparation of a balanced scorecard. The final part of the discussions has suggested the
improvement which can be made by the company based on the evaluation in the various topics
(Bussin and Lee 2016).
3. Topic and Literature Review
This section of the study has been considered with the various types of the evaluations
which has been taken into account with the number of the factors determining the financial and
non-financial measures as per the annual report of the company. It needs to be discerned that the
various type the depictions of the information on the financial interpretations has been revealed
with the declaration on the “Market price per share, Earnings per shares, Net Income/Loss,
Shareholder's Equity and Net Operating Expenditure”. The declaration of these financial
information has bee used to depict the “Price Earnings ratio, return on equity and return on
Paraphrase This Document
Need a fresh take? Get an instant paraphrase of this document with our AI Paraphraser
4MANAGERIAL ACCOUNTING
investment”, which has been duly included under the financial measures valuation of the report
(Dawid, Harting and Van Der Hoog 2018).
3.1 Financial and Non-Financial Indicator
Financial Indicators
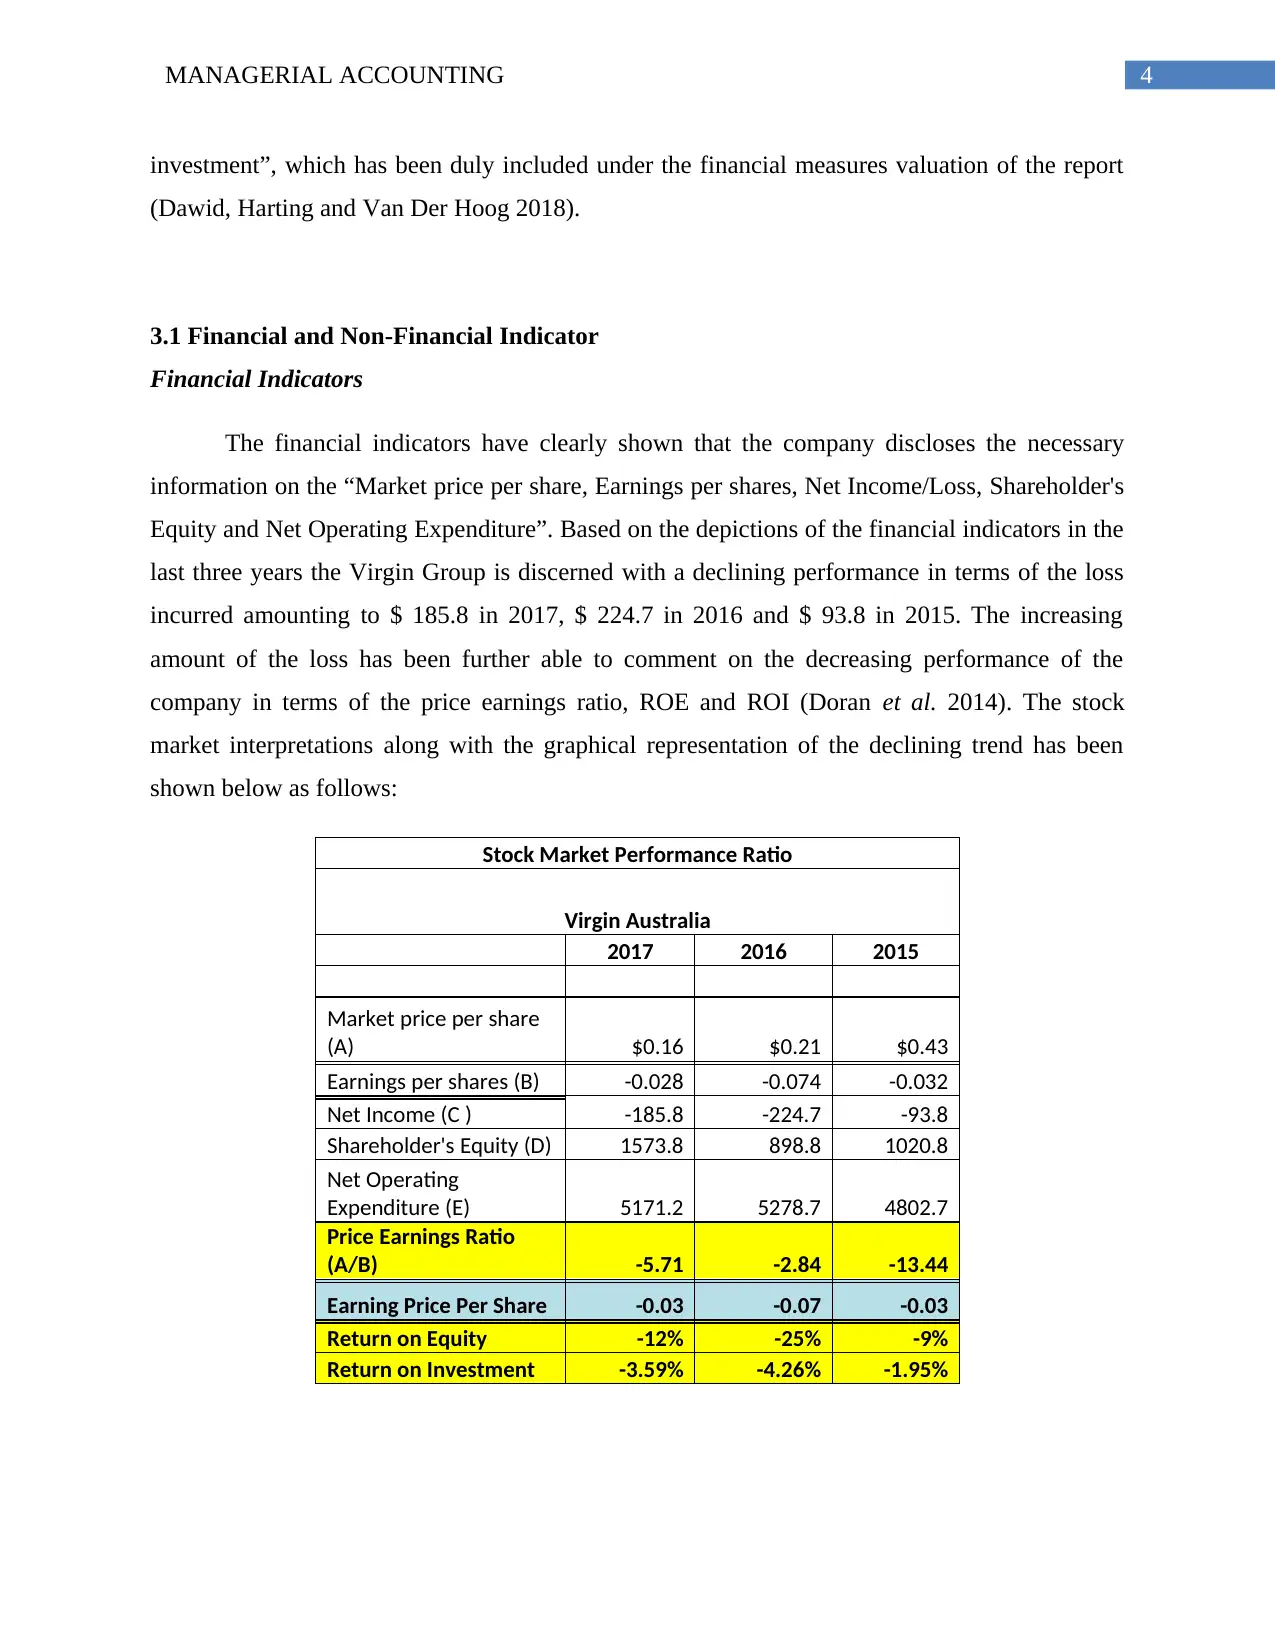
The financial indicators have clearly shown that the company discloses the necessary
information on the “Market price per share, Earnings per shares, Net Income/Loss, Shareholder's
Equity and Net Operating Expenditure”. Based on the depictions of the financial indicators in the
last three years the Virgin Group is discerned with a declining performance in terms of the loss
incurred amounting to $ 185.8 in 2017, $ 224.7 in 2016 and $ 93.8 in 2015. The increasing
amount of the loss has been further able to comment on the decreasing performance of the
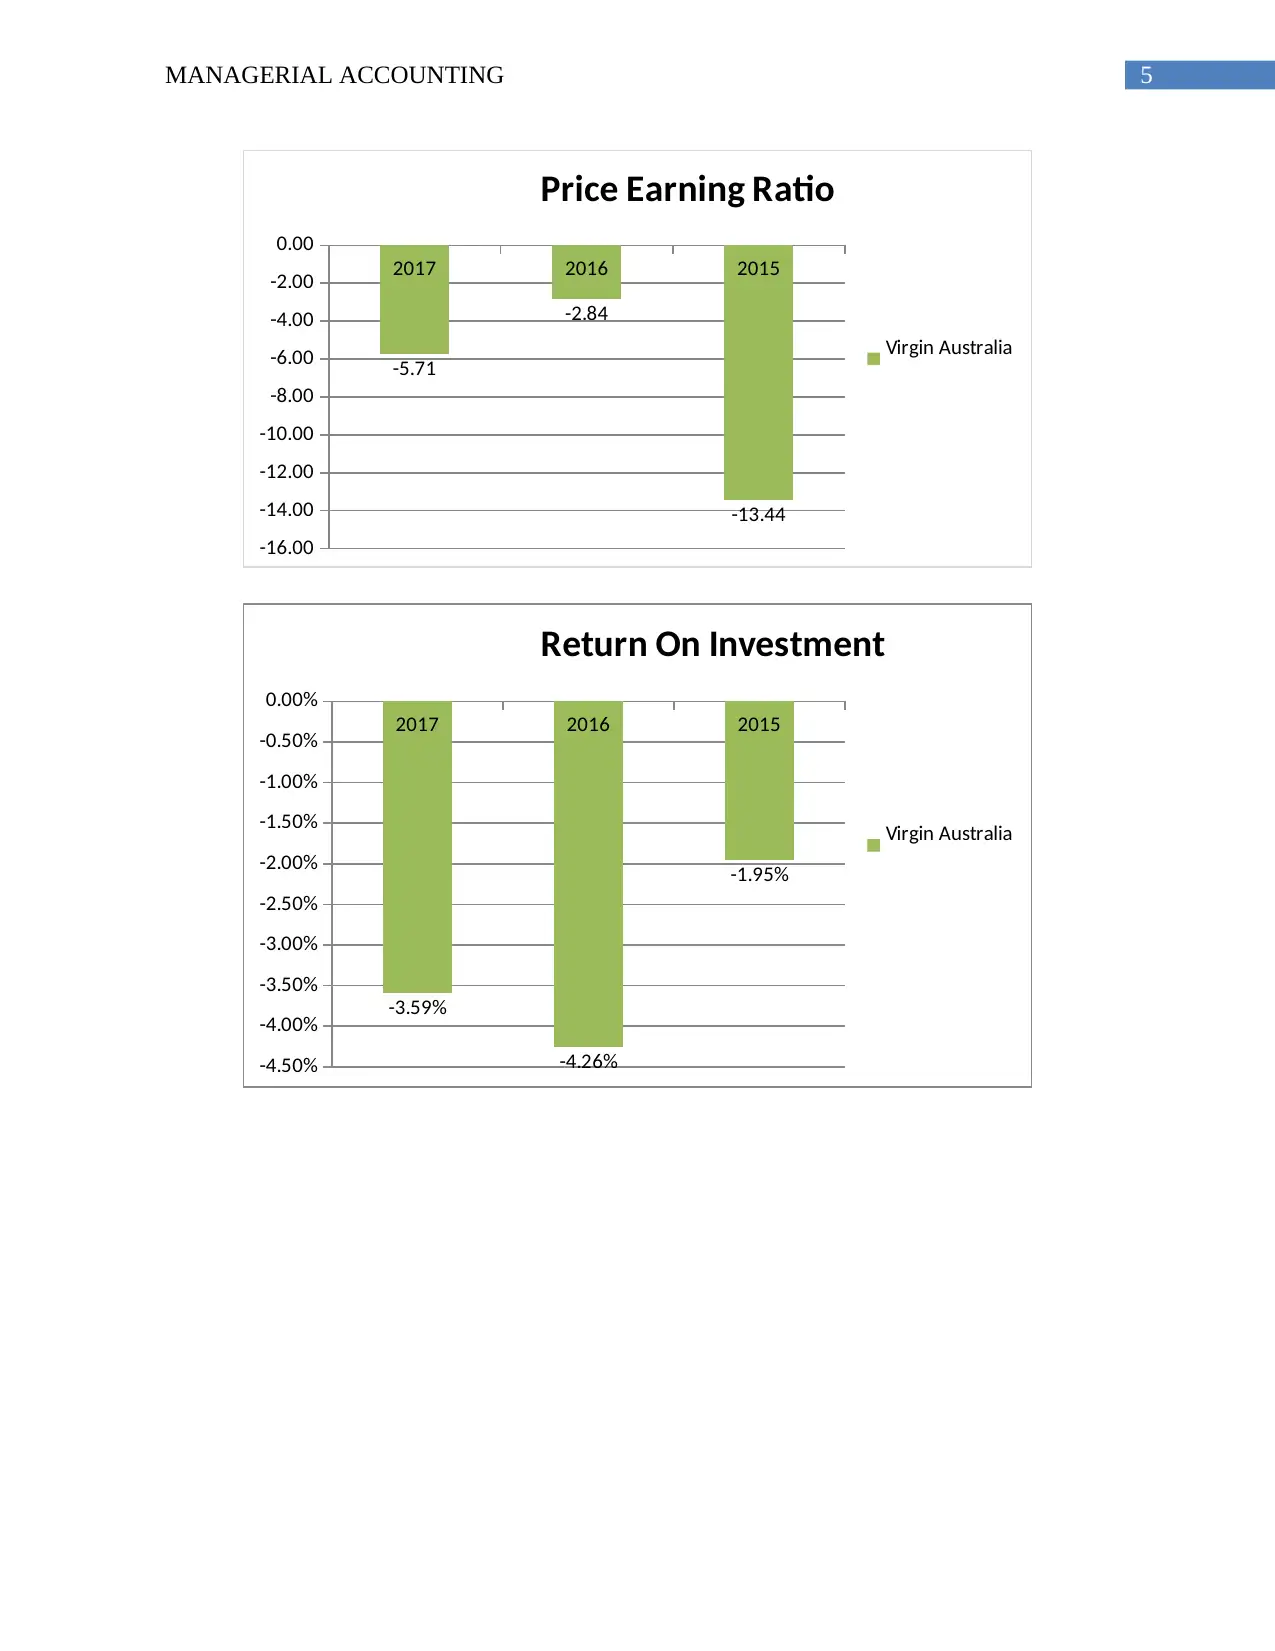
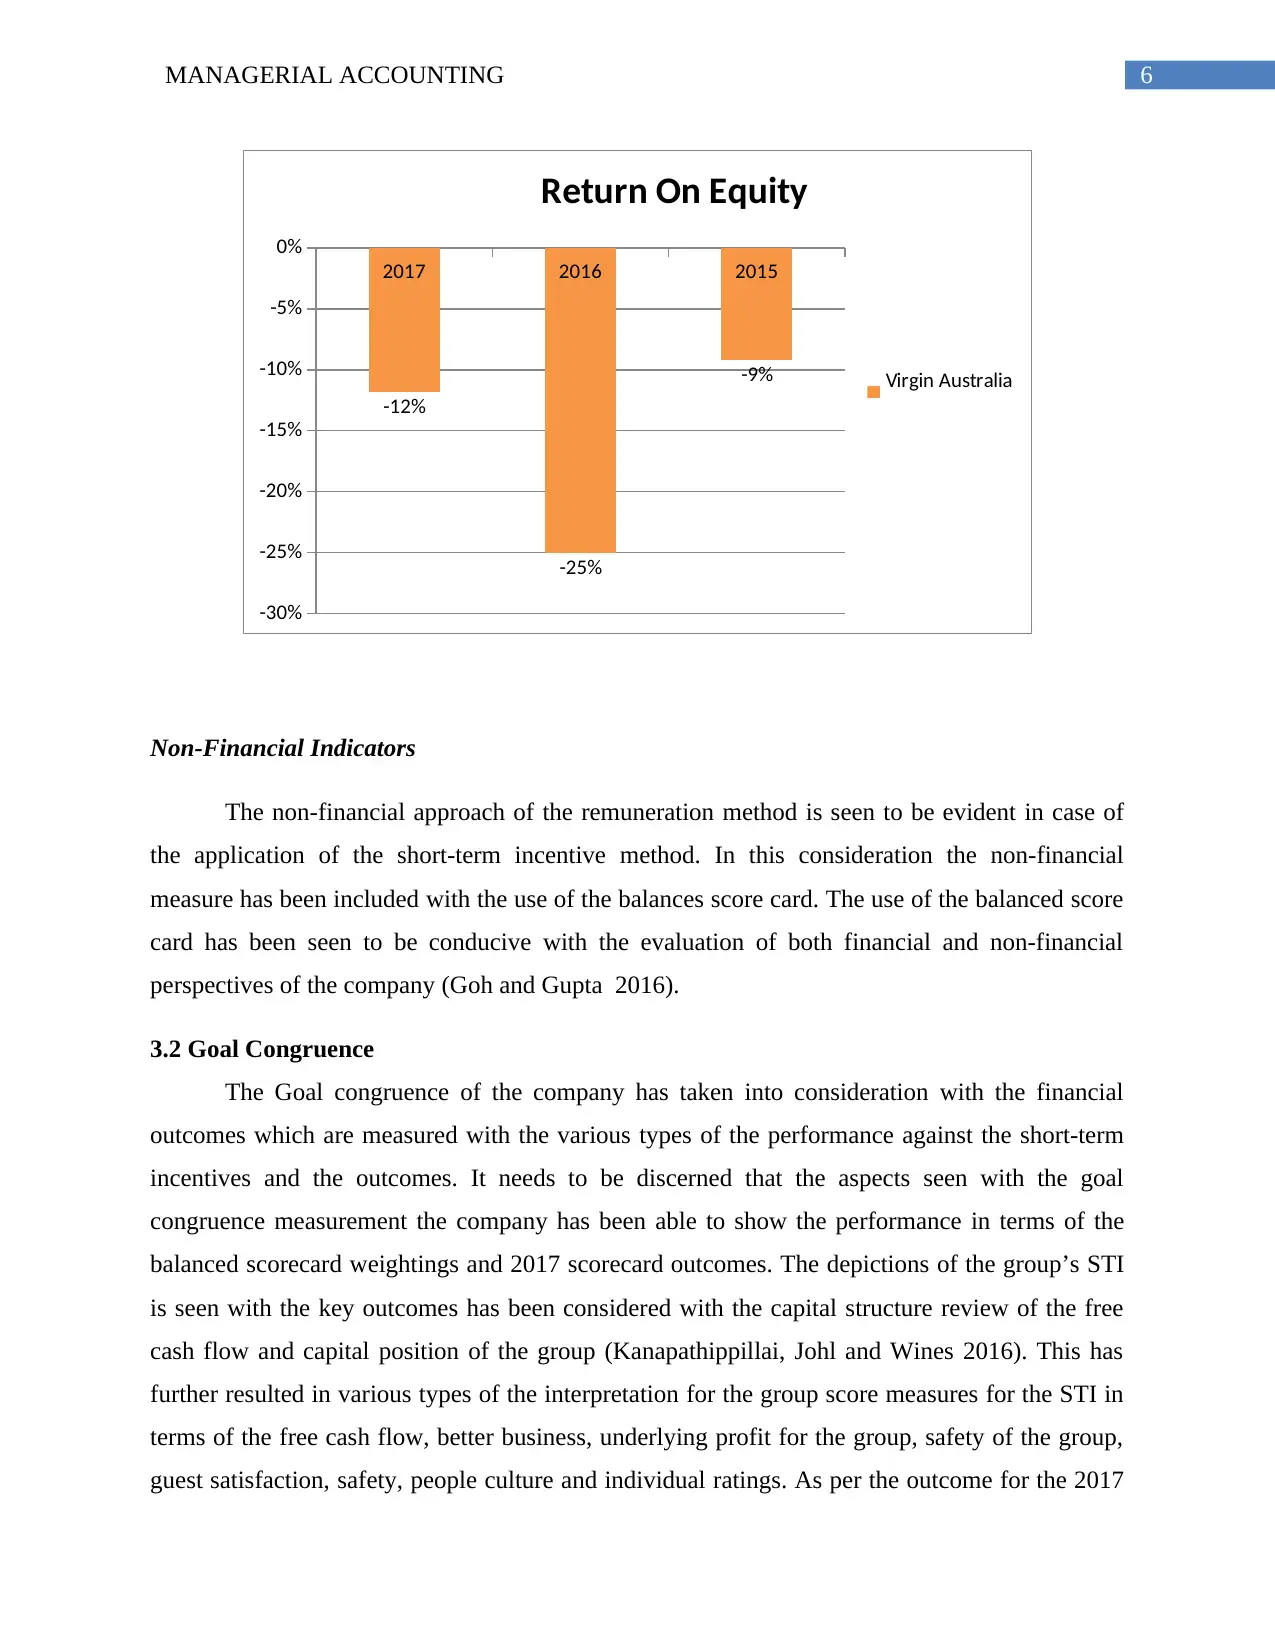
company in terms of the price earnings ratio, ROE and ROI (Doran et al. 2014). The stock
market interpretations along with the graphical representation of the declining trend has been
shown below as follows:
Stock Market Performance Ratio
Virgin Australia
2017 2016 2015
Market price per share
(A) $0.16 $0.21 $0.43
Earnings per shares (B) -0.028 -0.074 -0.032
Net Income (C ) -185.8 -224.7 -93.8
Shareholder's Equity (D) 1573.8 898.8 1020.8
Net Operating
Expenditure (E) 5171.2 5278.7 4802.7
Price Earnings Ratio
(A/B) -5.71 -2.84 -13.44
Earning Price Per Share -0.03 -0.07 -0.03
Return on Equity -12% -25% -9%
Return on Investment -3.59% -4.26% -1.95%
investment”, which has been duly included under the financial measures valuation of the report
(Dawid, Harting and Van Der Hoog 2018).
3.1 Financial and Non-Financial Indicator
Financial Indicators
The financial indicators have clearly shown that the company discloses the necessary
information on the “Market price per share, Earnings per shares, Net Income/Loss, Shareholder's
Equity and Net Operating Expenditure”. Based on the depictions of the financial indicators in the
last three years the Virgin Group is discerned with a declining performance in terms of the loss
incurred amounting to $ 185.8 in 2017, $ 224.7 in 2016 and $ 93.8 in 2015. The increasing
amount of the loss has been further able to comment on the decreasing performance of the
company in terms of the price earnings ratio, ROE and ROI (Doran et al. 2014). The stock
market interpretations along with the graphical representation of the declining trend has been
shown below as follows:
Stock Market Performance Ratio
Virgin Australia
2017 2016 2015
Market price per share
(A) $0.16 $0.21 $0.43
Earnings per shares (B) -0.028 -0.074 -0.032
Net Income (C ) -185.8 -224.7 -93.8
Shareholder's Equity (D) 1573.8 898.8 1020.8
Net Operating
Expenditure (E) 5171.2 5278.7 4802.7
Price Earnings Ratio
(A/B) -5.71 -2.84 -13.44
Earning Price Per Share -0.03 -0.07 -0.03
Return on Equity -12% -25% -9%
Return on Investment -3.59% -4.26% -1.95%
5MANAGERIAL ACCOUNTING
2017 2016 2015
-16.00
-14.00
-12.00
-10.00
-8.00
-6.00
-4.00
-2.00
0.00
-5.71
-2.84
-13.44
Price Earning Ratio
Virgin Australia
2017 2016 2015
-4.50%
-4.00%
-3.50%
-3.00%
-2.50%
-2.00%
-1.50%
-1.00%
-0.50%
0.00%
-3.59%
-4.26%
-1.95%
Return On Investment
Virgin Australia
2017 2016 2015
-16.00
-14.00
-12.00
-10.00
-8.00
-6.00
-4.00
-2.00
0.00
-5.71
-2.84
-13.44
Price Earning Ratio
Virgin Australia
2017 2016 2015
-4.50%
-4.00%
-3.50%
-3.00%
-2.50%
-2.00%
-1.50%
-1.00%
-0.50%
0.00%
-3.59%
-4.26%
-1.95%
Return On Investment
Virgin Australia
⊘ This is a preview!⊘
Do you want full access?
Subscribe today to unlock all pages.
Trusted by 1+ million students worldwide
6MANAGERIAL ACCOUNTING
2017 2016 2015
-30%
-25%
-20%
-15%
-10%
-5%
0%
-12%
-25%
-9%
Return On Equity
Virgin Australia
Non-Financial Indicators
The non-financial approach of the remuneration method is seen to be evident in case of
the application of the short-term incentive method. In this consideration the non-financial
measure has been included with the use of the balances score card. The use of the balanced score
card has been seen to be conducive with the evaluation of both financial and non-financial
perspectives of the company (Goh and Gupta 2016).
3.2 Goal Congruence
The Goal congruence of the company has taken into consideration with the financial
outcomes which are measured with the various types of the performance against the short-term
incentives and the outcomes. It needs to be discerned that the aspects seen with the goal
congruence measurement the company has been able to show the performance in terms of the
balanced scorecard weightings and 2017 scorecard outcomes. The depictions of the group’s STI
is seen with the key outcomes has been considered with the capital structure review of the free
cash flow and capital position of the group (Kanapathippillai, Johl and Wines 2016). This has
further resulted in various types of the interpretation for the group score measures for the STI in
terms of the free cash flow, better business, underlying profit for the group, safety of the group,
guest satisfaction, safety, people culture and individual ratings. As per the outcome for the 2017
Paraphrase This Document
Need a fresh take? Get an instant paraphrase of this document with our AI Paraphraser
7MANAGERIAL ACCOUNTING
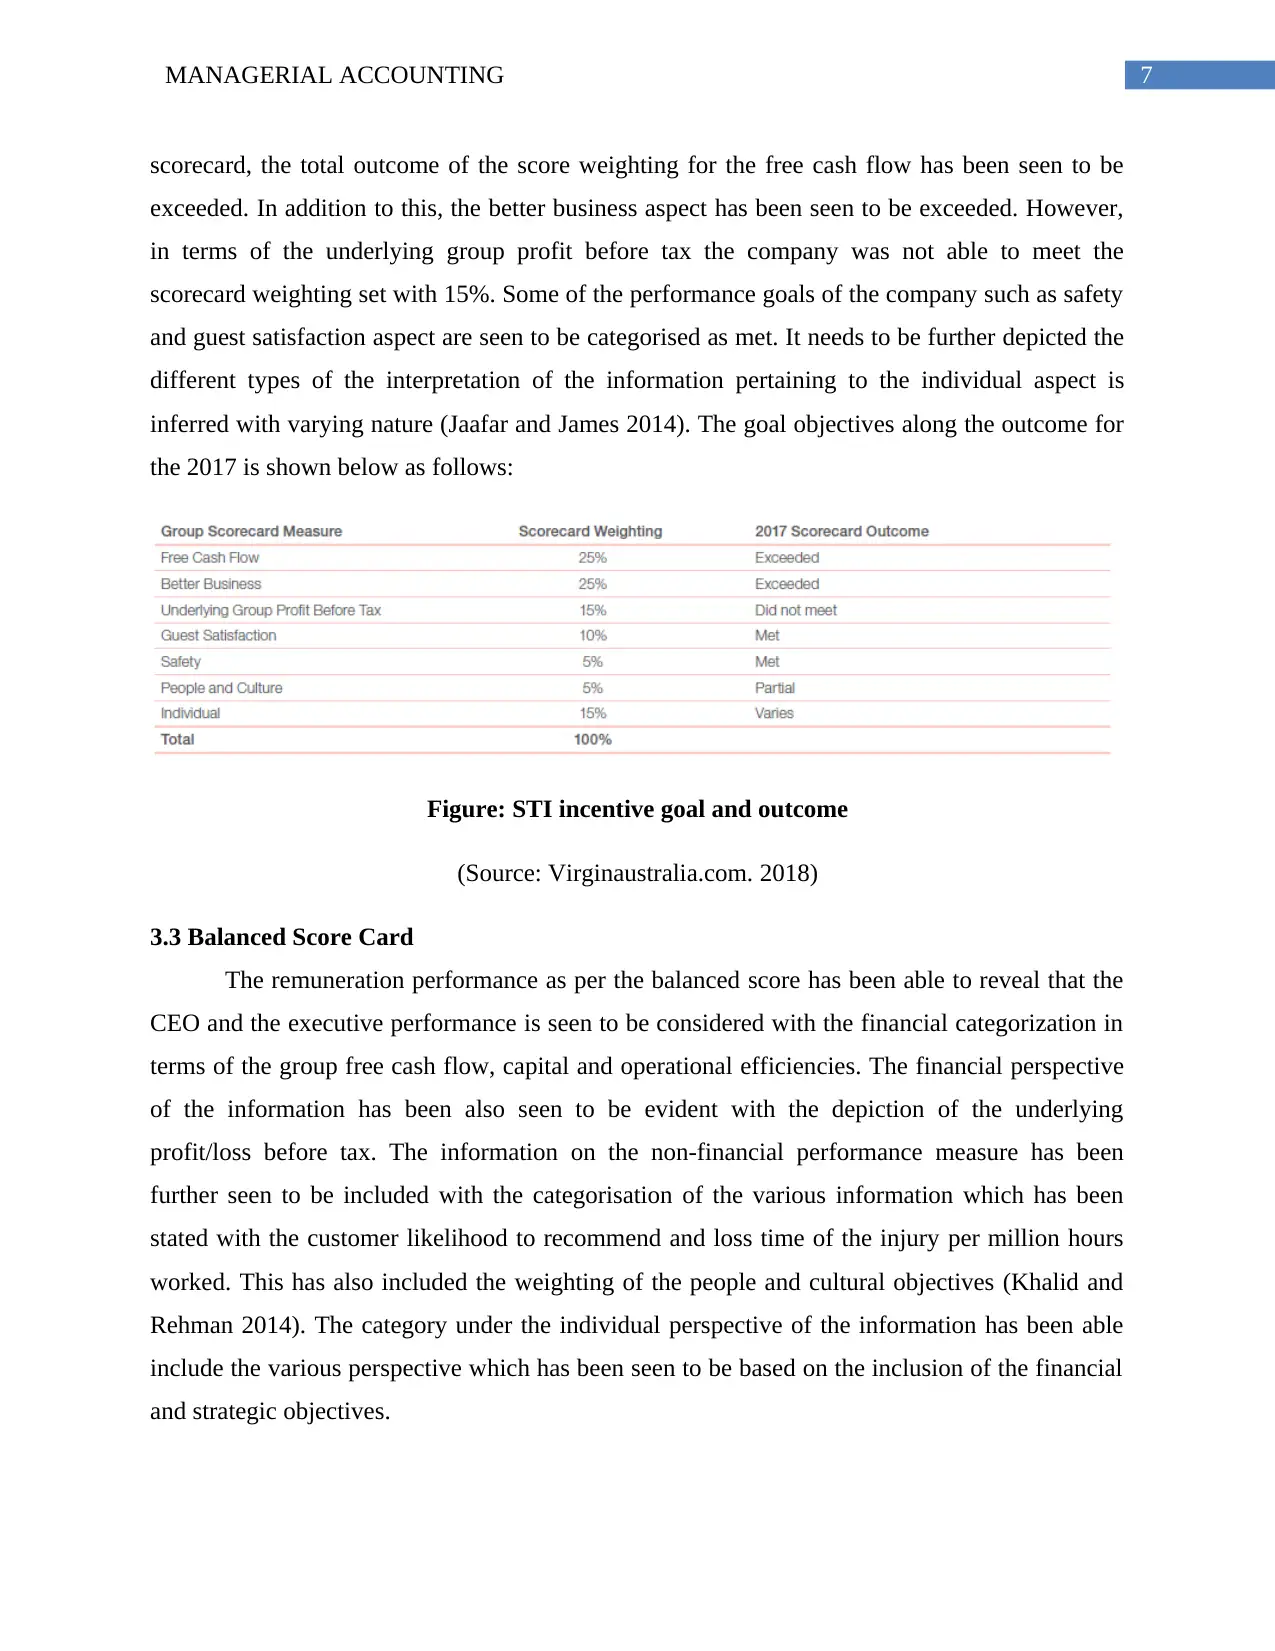
scorecard, the total outcome of the score weighting for the free cash flow has been seen to be
exceeded. In addition to this, the better business aspect has been seen to be exceeded. However,
in terms of the underlying group profit before tax the company was not able to meet the
scorecard weighting set with 15%. Some of the performance goals of the company such as safety
and guest satisfaction aspect are seen to be categorised as met. It needs to be further depicted the
different types of the interpretation of the information pertaining to the individual aspect is
inferred with varying nature (Jaafar and James 2014). The goal objectives along the outcome for
the 2017 is shown below as follows:
Figure: STI incentive goal and outcome
(Source: Virginaustralia.com. 2018)
3.3 Balanced Score Card
The remuneration performance as per the balanced score has been able to reveal that the
CEO and the executive performance is seen to be considered with the financial categorization in
terms of the group free cash flow, capital and operational efficiencies. The financial perspective
of the information has been also seen to be evident with the depiction of the underlying
profit/loss before tax. The information on the non-financial performance measure has been
further seen to be included with the categorisation of the various information which has been
stated with the customer likelihood to recommend and loss time of the injury per million hours
worked. This has also included the weighting of the people and cultural objectives (Khalid and
Rehman 2014). The category under the individual perspective of the information has been able
include the various perspective which has been seen to be based on the inclusion of the financial
and strategic objectives.
scorecard, the total outcome of the score weighting for the free cash flow has been seen to be
exceeded. In addition to this, the better business aspect has been seen to be exceeded. However,
in terms of the underlying group profit before tax the company was not able to meet the
scorecard weighting set with 15%. Some of the performance goals of the company such as safety
and guest satisfaction aspect are seen to be categorised as met. It needs to be further depicted the
different types of the interpretation of the information pertaining to the individual aspect is
inferred with varying nature (Jaafar and James 2014). The goal objectives along the outcome for
the 2017 is shown below as follows:
Figure: STI incentive goal and outcome
(Source: Virginaustralia.com. 2018)
3.3 Balanced Score Card
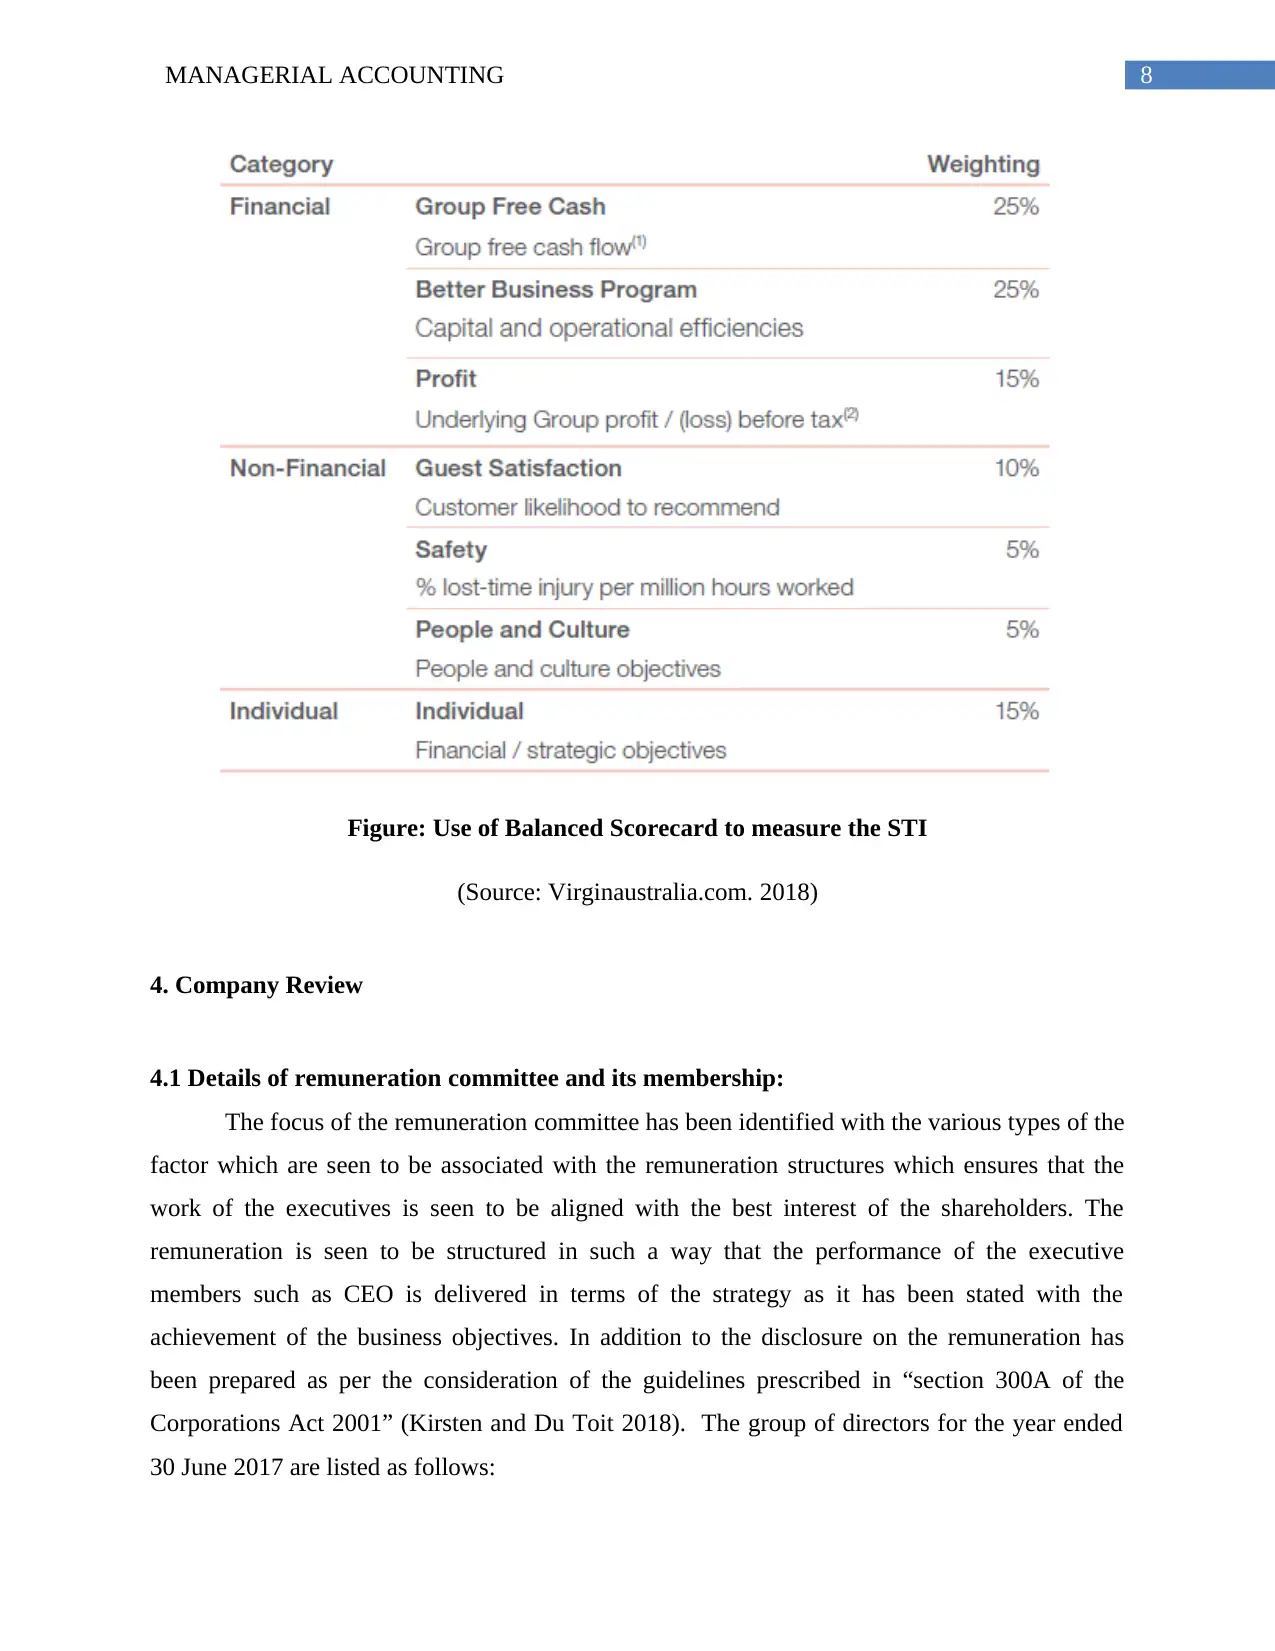
The remuneration performance as per the balanced score has been able to reveal that the
CEO and the executive performance is seen to be considered with the financial categorization in
terms of the group free cash flow, capital and operational efficiencies. The financial perspective
of the information has been also seen to be evident with the depiction of the underlying
profit/loss before tax. The information on the non-financial performance measure has been
further seen to be included with the categorisation of the various information which has been
stated with the customer likelihood to recommend and loss time of the injury per million hours
worked. This has also included the weighting of the people and cultural objectives (Khalid and
Rehman 2014). The category under the individual perspective of the information has been able
include the various perspective which has been seen to be based on the inclusion of the financial
and strategic objectives.
8MANAGERIAL ACCOUNTING
Figure: Use of Balanced Scorecard to measure the STI
(Source: Virginaustralia.com. 2018)
4. Company Review
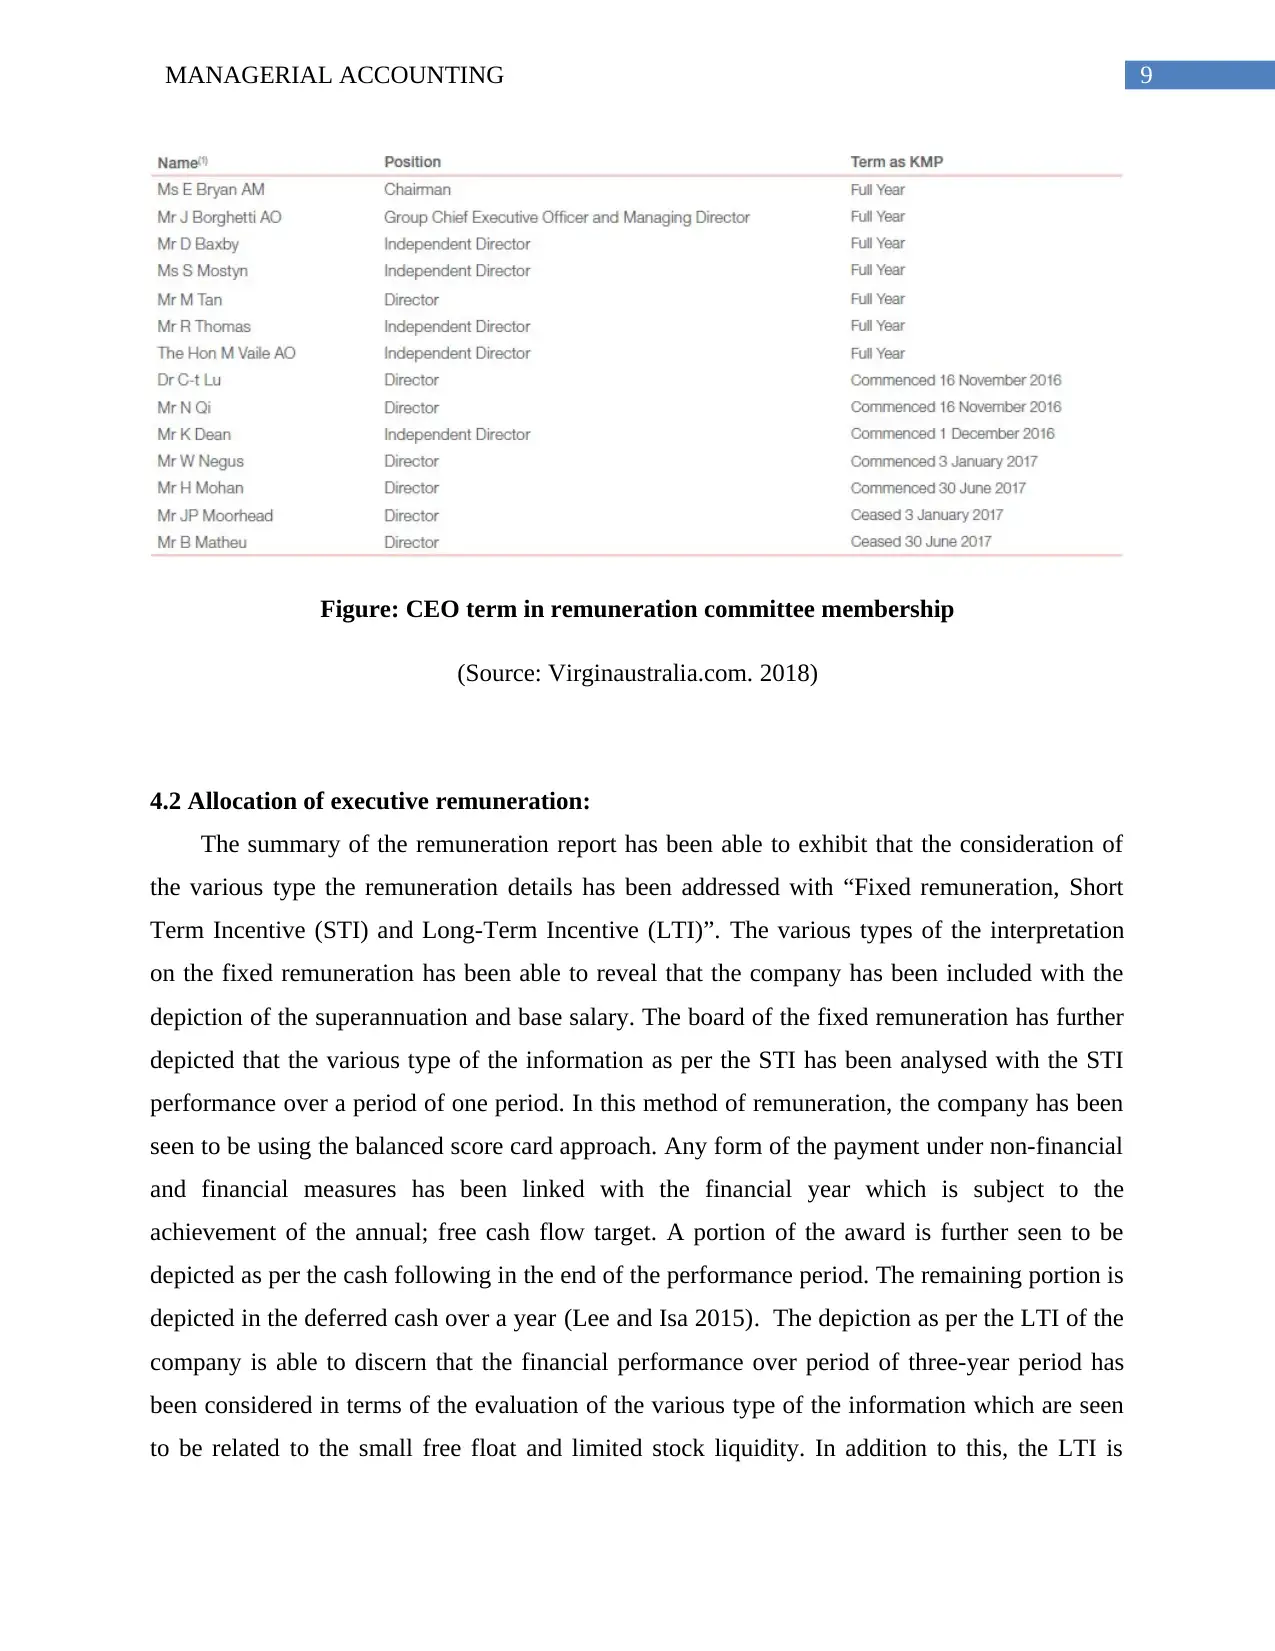
4.1 Details of remuneration committee and its membership:
The focus of the remuneration committee has been identified with the various types of the
factor which are seen to be associated with the remuneration structures which ensures that the
work of the executives is seen to be aligned with the best interest of the shareholders. The
remuneration is seen to be structured in such a way that the performance of the executive
members such as CEO is delivered in terms of the strategy as it has been stated with the
achievement of the business objectives. In addition to the disclosure on the remuneration has
been prepared as per the consideration of the guidelines prescribed in “section 300A of the
Corporations Act 2001” (Kirsten and Du Toit 2018). The group of directors for the year ended
30 June 2017 are listed as follows:
Figure: Use of Balanced Scorecard to measure the STI
(Source: Virginaustralia.com. 2018)
4. Company Review
4.1 Details of remuneration committee and its membership:
The focus of the remuneration committee has been identified with the various types of the
factor which are seen to be associated with the remuneration structures which ensures that the
work of the executives is seen to be aligned with the best interest of the shareholders. The
remuneration is seen to be structured in such a way that the performance of the executive
members such as CEO is delivered in terms of the strategy as it has been stated with the
achievement of the business objectives. In addition to the disclosure on the remuneration has
been prepared as per the consideration of the guidelines prescribed in “section 300A of the
Corporations Act 2001” (Kirsten and Du Toit 2018). The group of directors for the year ended
30 June 2017 are listed as follows:
⊘ This is a preview!⊘
Do you want full access?
Subscribe today to unlock all pages.
Trusted by 1+ million students worldwide
9MANAGERIAL ACCOUNTING
Figure: CEO term in remuneration committee membership
(Source: Virginaustralia.com. 2018)
4.2 Allocation of executive remuneration:
The summary of the remuneration report has been able to exhibit that the consideration of
the various type the remuneration details has been addressed with “Fixed remuneration, Short
Term Incentive (STI) and Long-Term Incentive (LTI)”. The various types of the interpretation
on the fixed remuneration has been able to reveal that the company has been included with the
depiction of the superannuation and base salary. The board of the fixed remuneration has further
depicted that the various type of the information as per the STI has been analysed with the STI
performance over a period of one period. In this method of remuneration, the company has been
seen to be using the balanced score card approach. Any form of the payment under non-financial
and financial measures has been linked with the financial year which is subject to the
achievement of the annual; free cash flow target. A portion of the award is further seen to be
depicted as per the cash following in the end of the performance period. The remaining portion is
depicted in the deferred cash over a year (Lee and Isa 2015). The depiction as per the LTI of the
company is able to discern that the financial performance over period of three-year period has
been considered in terms of the evaluation of the various type of the information which are seen
to be related to the small free float and limited stock liquidity. In addition to this, the LTI is
Paraphrase This Document
Need a fresh take? Get an instant paraphrase of this document with our AI Paraphraser
10MANAGERIAL ACCOUNTING
considered as the cash-based plan upon the significant delivery of financial performance such as
ROIC.
4.3 Mix of performance measures used:
The three important performance measures for the executive remuneration of the
company have been seen to be depicted with the valuation of the fixed remuneration, short term
incentives, long-term incentives and non-executive directors remunerating.
Fixed Remuneration
The fixed remuneration is seen to comprise of the base salary and the superannuation. The takes
the initiative to set the fixed remuneration to ensure the CEO and executives who are fairly
remunerated in terms of the ASX listed companies.
Short Term Incentive (STI)
The different types of the depiction of the short-term incentives of eh company has been
depicted with the various type of measure of linking the STI performance over a period of one
year. The balanced score card interpretation related to the measurement of the incentives as per
the one-year period are depicted with the adoption of the financial and non-financial measures
such as balanced scorecard. Henceforth, any payment under the STI in 2017 financial year is
subject to the achieving of free cash flow target. A portion of the award of the STI is allocated to
the ward which paid in cash following at the end of the performance period (Leong et al. 2015).
Long Term Incentive (LTI)
The LTI of the company has been depicted to be linked with the financial performance
over period of three months. The LTI structure of the company takes into consideration the
nature of the capital structure of the group which is linked with the free float and limited to the
stock liquidity. The LTI issues by the company is further considered to be paid on the delivery of
the significant improvement which is seen to be depicted in terms of the invested capital. The
ROIC is seen to be selected with the various types of the factors which has been seen to be based
on the different types of the discourse which has been seen to be considered as per the
sustainability and profitability of the airline. These are further considered with the several
financial metrices such as invested capital and earnings (Lepper and Greene 2015).
11MANAGERIAL ACCOUNTING
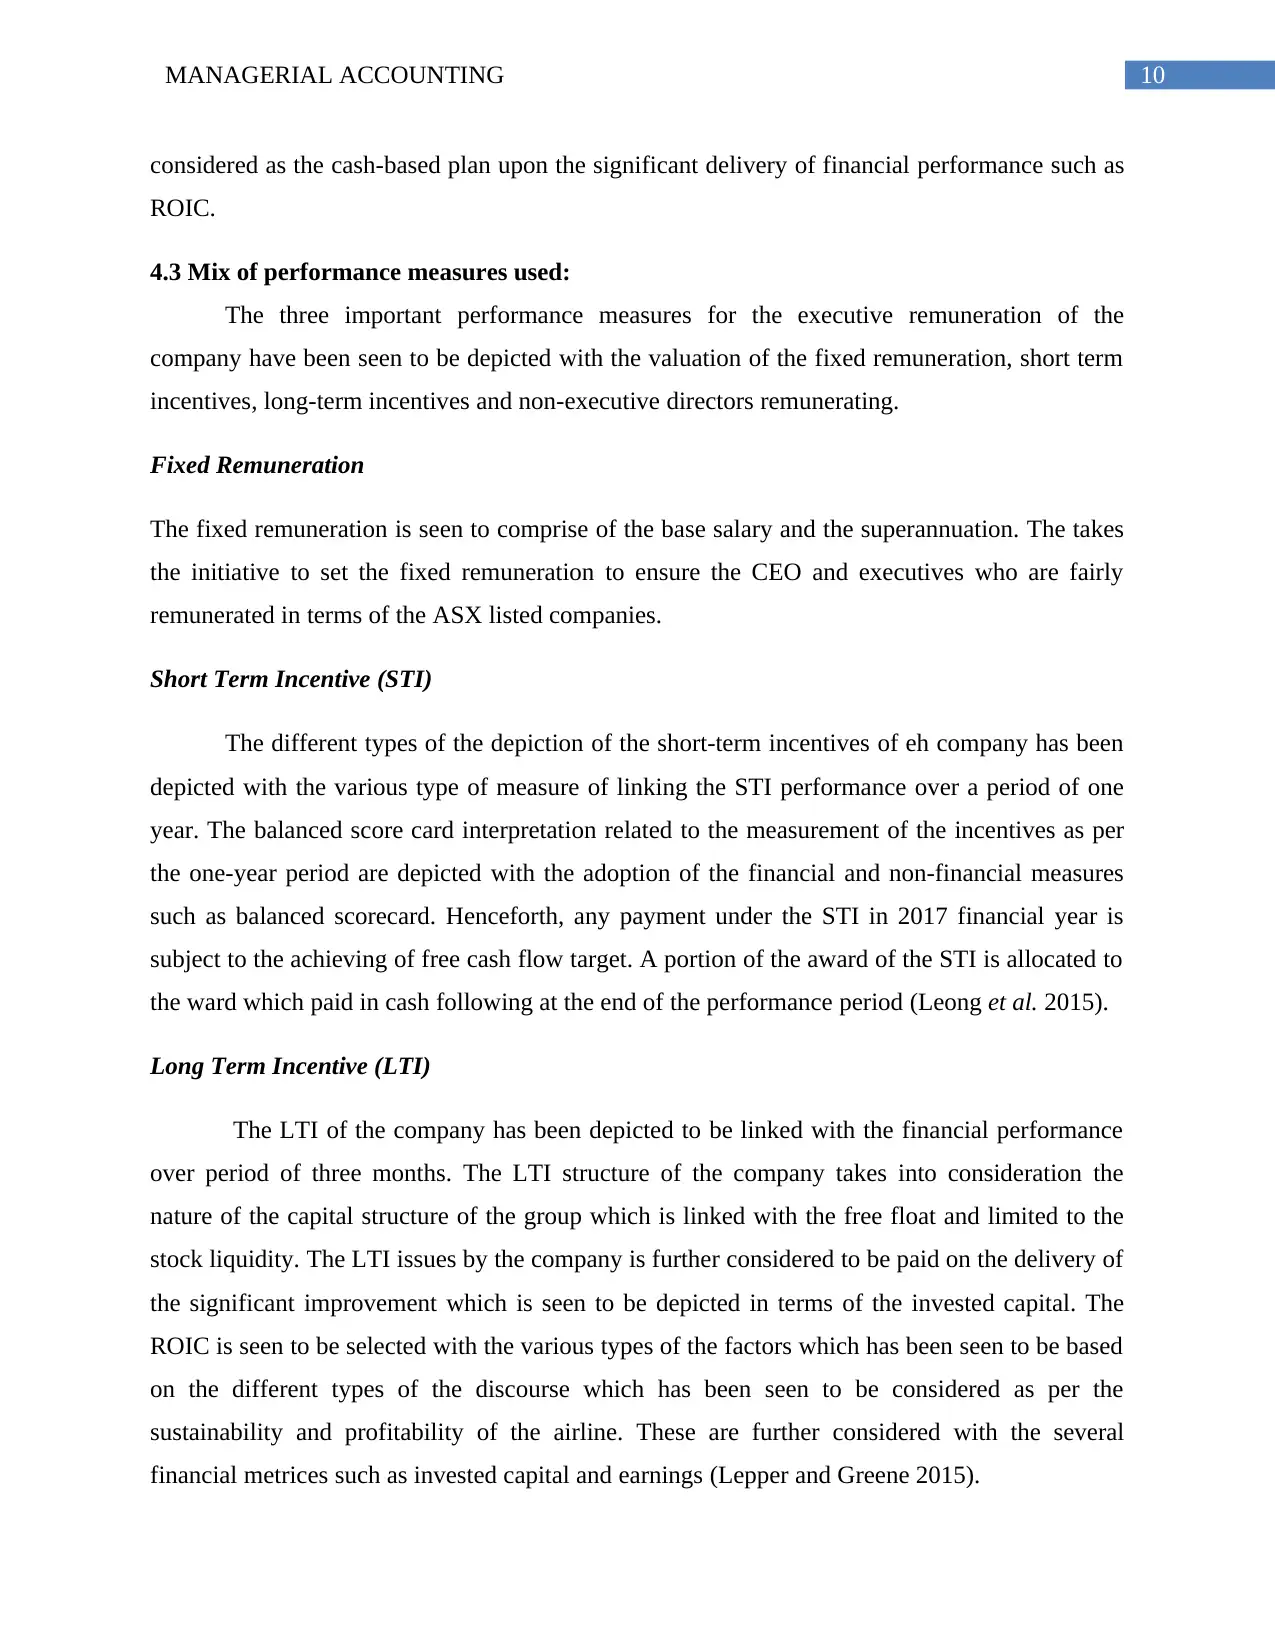
4.4 Company performance versus executive pay:
Virgin Australia has been significantly able to increase the segmental EBIT, from 2014 to
2016. However, in the recent times the segmental EBIT has reduced to $ 164.1 million. In
addition to this the performance of the is declining in nature which has been seen to be evident
with the underlying loss of 3.7 million. In addition to this, the net loss of the company has been
seen to be depicted to be $ 220.3 million. The ROIC is another indicator of the declining
performance for the company. Despite of the degrading financial performance of the company
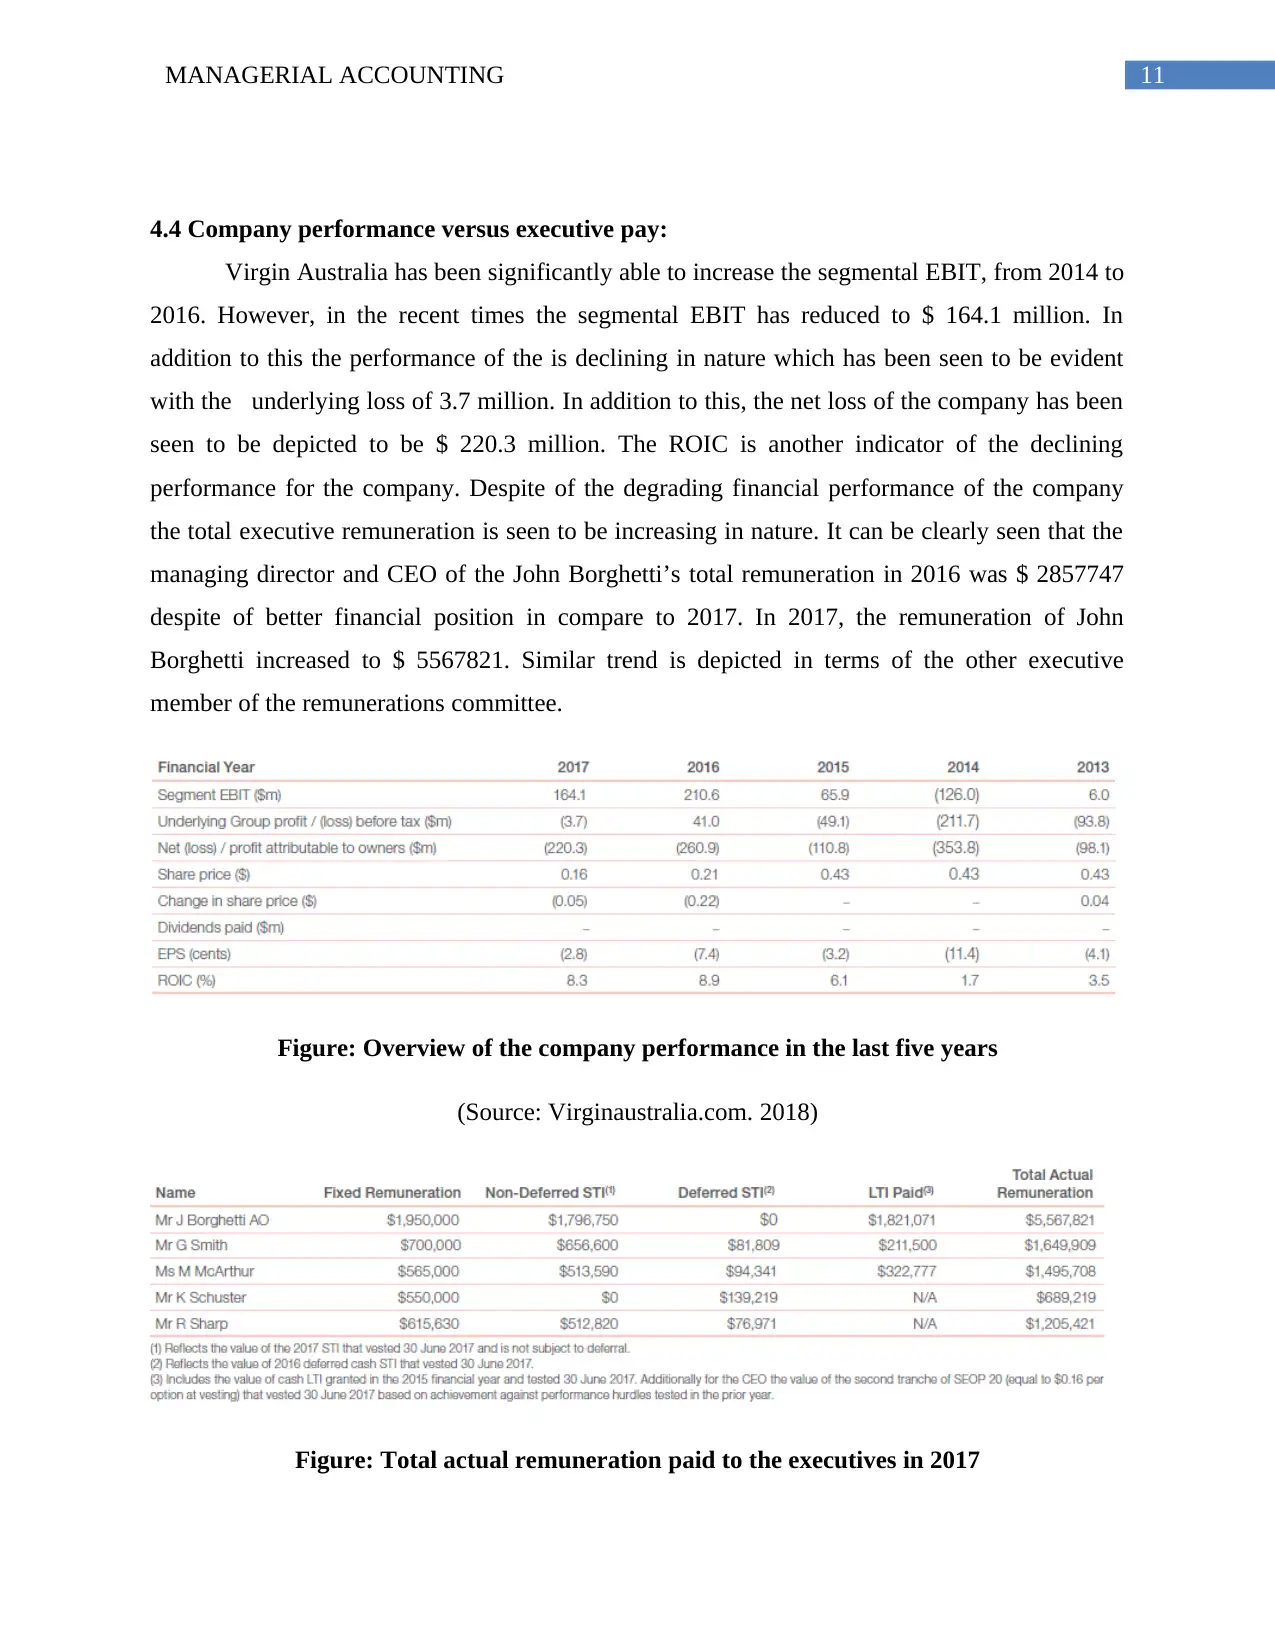
the total executive remuneration is seen to be increasing in nature. It can be clearly seen that the
managing director and CEO of the John Borghetti’s total remuneration in 2016 was $ 2857747
despite of better financial position in compare to 2017. In 2017, the remuneration of John
Borghetti increased to $ 5567821. Similar trend is depicted in terms of the other executive
member of the remunerations committee.
Figure: Overview of the company performance in the last five years
(Source: Virginaustralia.com. 2018)
Figure: Total actual remuneration paid to the executives in 2017
4.4 Company performance versus executive pay:
Virgin Australia has been significantly able to increase the segmental EBIT, from 2014 to
2016. However, in the recent times the segmental EBIT has reduced to $ 164.1 million. In
addition to this the performance of the is declining in nature which has been seen to be evident
with the underlying loss of 3.7 million. In addition to this, the net loss of the company has been
seen to be depicted to be $ 220.3 million. The ROIC is another indicator of the declining
performance for the company. Despite of the degrading financial performance of the company
the total executive remuneration is seen to be increasing in nature. It can be clearly seen that the
managing director and CEO of the John Borghetti’s total remuneration in 2016 was $ 2857747
despite of better financial position in compare to 2017. In 2017, the remuneration of John
Borghetti increased to $ 5567821. Similar trend is depicted in terms of the other executive
member of the remunerations committee.
Figure: Overview of the company performance in the last five years
(Source: Virginaustralia.com. 2018)
Figure: Total actual remuneration paid to the executives in 2017
⊘ This is a preview!⊘
Do you want full access?
Subscribe today to unlock all pages.
Trusted by 1+ million students worldwide
1 out of 19
Related Documents


Your All-in-One AI-Powered Toolkit for Academic Success.
+13062052269
info@desklib.com
Available 24*7 on WhatsApp / Email
![[object Object]](/_next/static/media/star-bottom.7253800d.svg)
Unlock your academic potential
Copyright © 2020–2026 A2Z Services. All Rights Reserved. Developed and managed by ZUCOL.