MBA901 T3 2018: Financial Analysis of Virgin Australia and SME
VerifiedAdded on 2023/06/04
|18
|4943
|331
Report
AI Summary
This report provides a comprehensive financial analysis of two companies: Virgin Australia Holdings Ltd (VAH), a listed airline company, and SME Prosperous Pty Ltd, an unlisted small to medium enterprise. The report begins with an executive summary outlining the objectives and methodology, which involves in-depth study and analysis using various sources, including the ASX and company websites. Part A focuses on VAH, presenting a detailed financial comparison using comparative income statements and balance sheets over four years (2015-2018). It includes an analysis of revenue, operating expenditure, finance costs, and losses, along with a trend analysis. The report also provides ratio analysis, assessing liquidity, debt management, and asset management. Part B presents a financial summary of SME Prosperous Pty Ltd, offering a similar level of financial analysis. The report concludes with a summary of the accounting position and key findings for both companies, drawing conclusions based on the financial data and ratio analysis. The assignment also references the provided assignment brief which outlines the task and the required scope of work.

Paraphrase This Document
Need a fresh take? Get an instant paraphrase of this document with our AI Paraphraser
1
By student name
Professor
University
Date: 25 April 2018.
1 | P a g e
By student name
Professor
University
Date: 25 April 2018.
1 | P a g e
2
Executive Summary
A professional management report has been prepared on the two companies with the objective
of financial analysis and which will serve as the basis for taking investment decisions and other
decisions by stakeholders. For the purpose of the report, in-depth study and analysis of the two
companies has been done using ASX website and the respective company websites as well. The
historic records, primary, secondary and tertiary sources of information has also been used to
prepare the report. The first case study deals with one of the listed Australian companies
named Virgin Australia Holdings Ltd. The financial analysis with respect to all the financial
statements, the trend analysis and the ratio analysis has been done for past years. The
explanatory notes given by the auditor in the Auditor’s report has also been shown. Finally, the
conclusion and recommendation has been given as to what the company might face in the near
future. Part B of the Assignment also deals with the financial summary of one of the small
unlisted companies SME Prosperous Pty Ltd for which too the financial analysis has been done.-
2 | P a g e
⊘ This is a preview!⊘
Do you want full access?
Subscribe today to unlock all pages.
Trusted by 1+ million students worldwide
3
Contents
Part A – Virgin Australia Holdings Ltd (VAH)................................................................................................4
Introduction.............................................................................................................................................4
Financial Comparison for the entity - Internal.........................................................................................4
Purpose of financial audit and audit comments....................................................................................12
Conclusion and Accounting Position of company..................................................................................13
Part B - Prosperous Pty Ltd........................................................................................................................13
Introduction...........................................................................................................................................13
Financial Analysis...................................................................................................................................13
Conclusion and Accounting Position of company..................................................................................16
References.................................................................................................................................................17
3 | P a g e
Paraphrase This Document
Need a fresh take? Get an instant paraphrase of this document with our AI Paraphraser
4
Part A – Virgin Australia Holdings Ltd (VAH)
Introduction
In this section of the report, the financial analysis of one of the companies Virgin Australia
Holdings Ltd has been done. It is listed on the Australian Stock Exchange and represented as
VAH. It is an airline company and operates in Australian as Virgin Australia, Virgin Australia
Regional Airlines, Virgin Australia International Airlines and Tigerair Australia. It was previously
being operated by Pacific Blue Airlines and was absorbed into Virgin Group in the year 2011
(Bromwich & Scapens, 2016). The company’s headquarters are based out of Brisbane and
employs nearly 10000 people. It is one of the largest Airline services company in Australia after
Qantas Group and Airline Group.
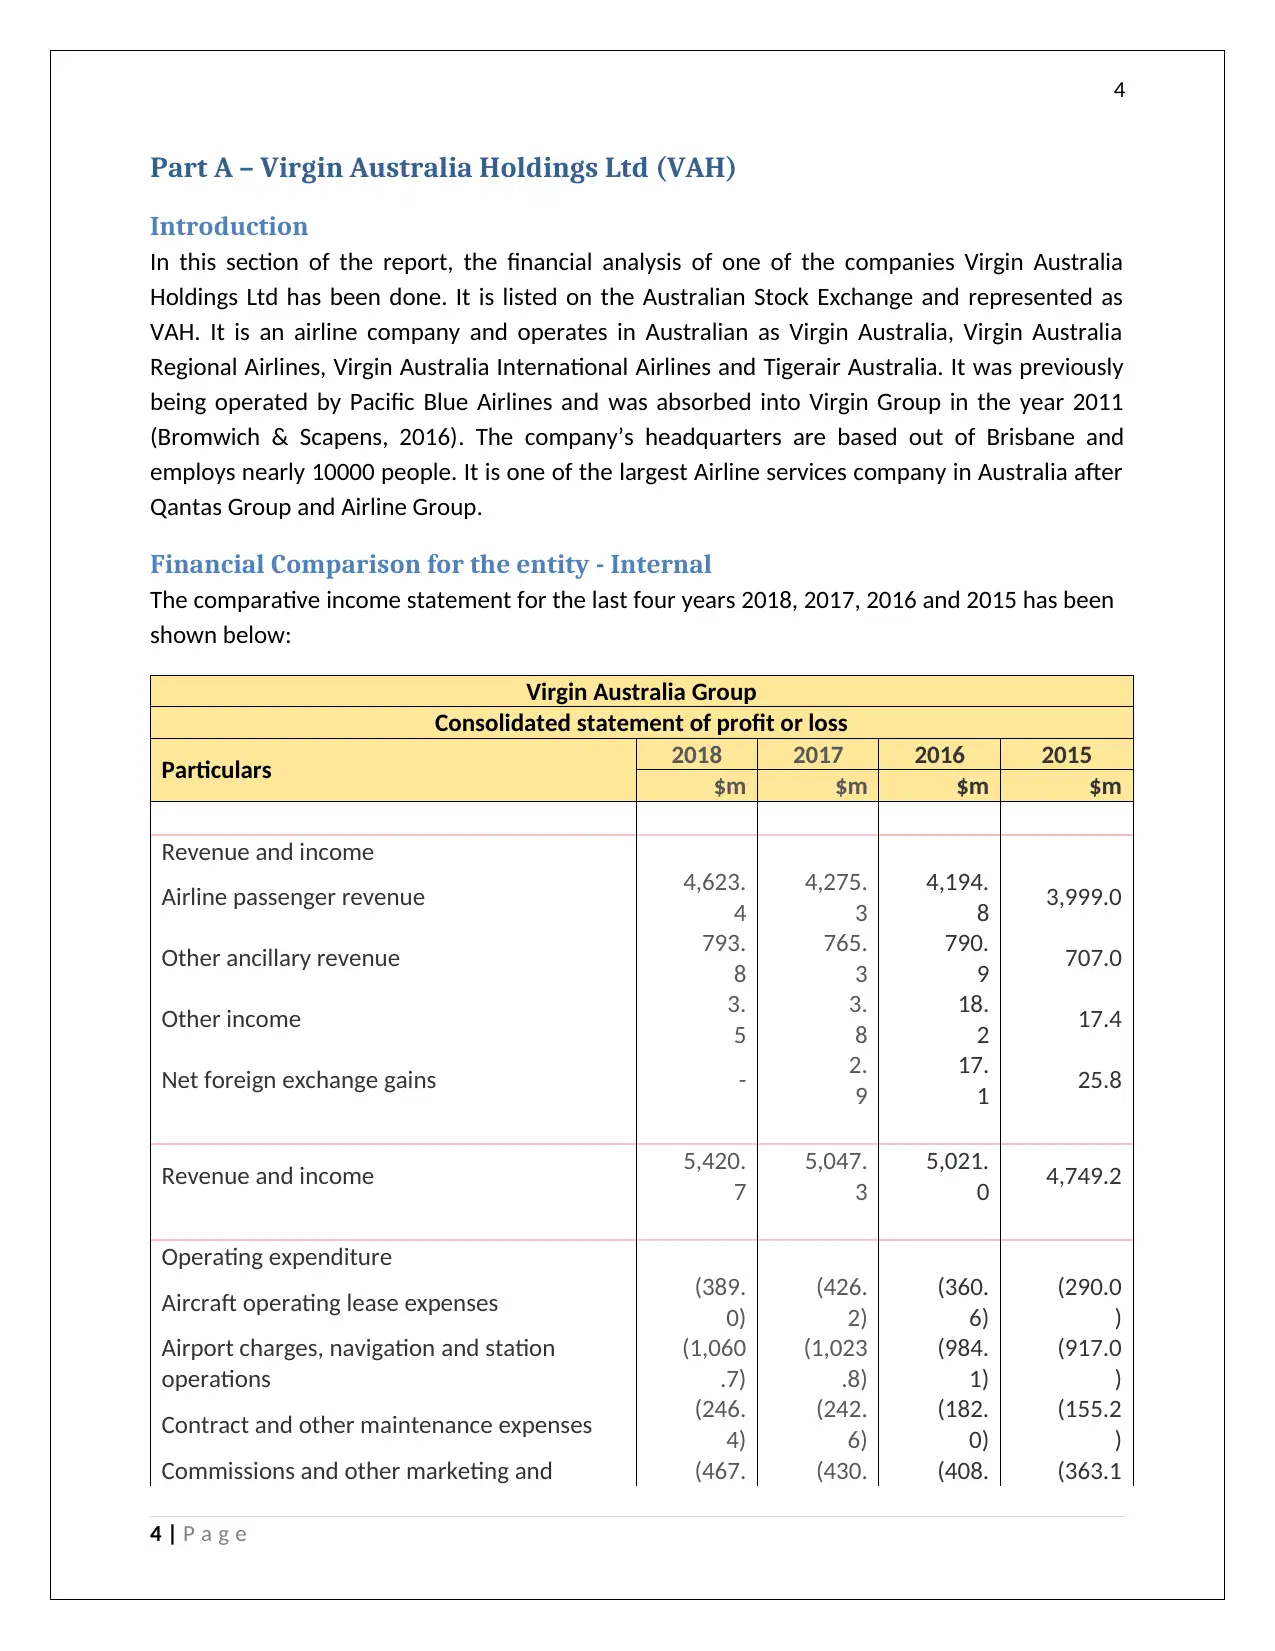
Financial Comparison for the entity - Internal
The comparative income statement for the last four years 2018, 2017, 2016 and 2015 has been
shown below:
Virgin Australia Group
Consolidated statement of profit or loss
Particulars 2018 2017 2016 2015
$m $m $m $m
Revenue and income
Airline passenger revenue 4,623.
4
4,275.
3
4,194.
8 3,999.0
Other ancillary revenue 793.
8
765.
3
790.
9 707.0
Other income 3.
5
3.
8
18.
2 17.4
Net foreign exchange gains - 2.
9
17.
1 25.8
Revenue and income 5,420.
7
5,047.
3
5,021.
0 4,749.2
Operating expenditure
Aircraft operating lease expenses (389.
0)
(426.
2)
(360.
6)
(290.0
)
Airport charges, navigation and station
operations
(1,060
.7)
(1,023
.8)
(984.
1)
(917.0
)
Contract and other maintenance expenses (246.
4)
(242.
6)
(182.
0)
(155.2
)
Commissions and other marketing and (467. (430. (408. (363.1
4 | P a g e
Part A – Virgin Australia Holdings Ltd (VAH)
Introduction
In this section of the report, the financial analysis of one of the companies Virgin Australia
Holdings Ltd has been done. It is listed on the Australian Stock Exchange and represented as
VAH. It is an airline company and operates in Australian as Virgin Australia, Virgin Australia
Regional Airlines, Virgin Australia International Airlines and Tigerair Australia. It was previously
being operated by Pacific Blue Airlines and was absorbed into Virgin Group in the year 2011
(Bromwich & Scapens, 2016). The company’s headquarters are based out of Brisbane and
employs nearly 10000 people. It is one of the largest Airline services company in Australia after
Qantas Group and Airline Group.
Financial Comparison for the entity - Internal
The comparative income statement for the last four years 2018, 2017, 2016 and 2015 has been
shown below:
Virgin Australia Group
Consolidated statement of profit or loss
Particulars 2018 2017 2016 2015
$m $m $m $m
Revenue and income
Airline passenger revenue 4,623.
4
4,275.
3
4,194.
8 3,999.0
Other ancillary revenue 793.
8
765.
3
790.
9 707.0
Other income 3.
5
3.
8
18.
2 17.4
Net foreign exchange gains - 2.
9
17.
1 25.8
Revenue and income 5,420.
7
5,047.
3
5,021.
0 4,749.2
Operating expenditure
Aircraft operating lease expenses (389.
0)
(426.
2)
(360.
6)
(290.0
)
Airport charges, navigation and station
operations
(1,060
.7)
(1,023
.8)
(984.
1)
(917.0
)
Contract and other maintenance expenses (246.
4)
(242.
6)
(182.
0)
(155.2
)
Commissions and other marketing and (467. (430. (408. (363.1
4 | P a g e
5
reservations expenses 4) 0) 2) )
Fuel and oil (985.
5)
(898.
4)
(1,018
.8)
(1,191.
6)
Labour and staff related expenses (1,246
.7)
(1,219
.2)
(1,157
.8)
(1,118.
8)
Impairment losses on assets classified as held
for sale - (7.
8)
(107.
3) –
Impairment losses on cash-generating units (120.
8) -
Impairment losses on other assets (47.
8)
(65.
9)
(118.
1) –
Onerous contract expenses (58.
5)
(29.
6)
(100.
2) –
Other expenses from ordinary activities (512.
9)
(516.
9)
(531.
6)
(464.2
)
Depreciation and amortisation (337.
3)
(309.
7)
(282.
2)
(275.4
)
Ineffective cash flow hedges and non-
designated derivatives losses - 0.
7
(27.
8)
(27.4
)
Net operating expenditure (5,473
.0)
(5,169
.4)
(5,278
.7)
(4,802.
7)
Share of net profits/(losses) of equity-
accounted investees
3.
5
2.
1
0.
7
(16.6
)
Loss before net finance costs and tax (48.
8)
(120.
0)
(257.
0)
(70.1
)
Finance income 19.
2
16.
9
11.
4 39.7
Finance costs (171.
8)
(186.
5)
(181.
0)
(132.9
)
Net finance costs (152.
6)
(169.
6)
(169.
6)
(93.2
)
Loss before tax (201.
4)
(289.
6)
(426.
6)
(163.3
)
Income tax benefit (451.
9)
103.
8
201.
9 69.5
Loss (653. (185. (224. (93.8
5 | P a g e
⊘ This is a preview!⊘
Do you want full access?
Subscribe today to unlock all pages.
Trusted by 1+ million students worldwide
6
3) 8) 7) )
Attributable to:
Owners of the Company (681.
0)
(220.
3)
(260.
9)
(110.8
)
Non-controlling interests 27.
7
34.
5
36.
2 17.0
(653.
3)
(185.
8)
(224.
7)
(93.8
)
Earnings per share Cents Cents Cents Cents
Basic earnings per share (8.
1)
(2.
8)
(7.
4)
(3.2
)
Diluted earnings per share (8.
1)
(2.
8)
(7.
4)
(3.2
)
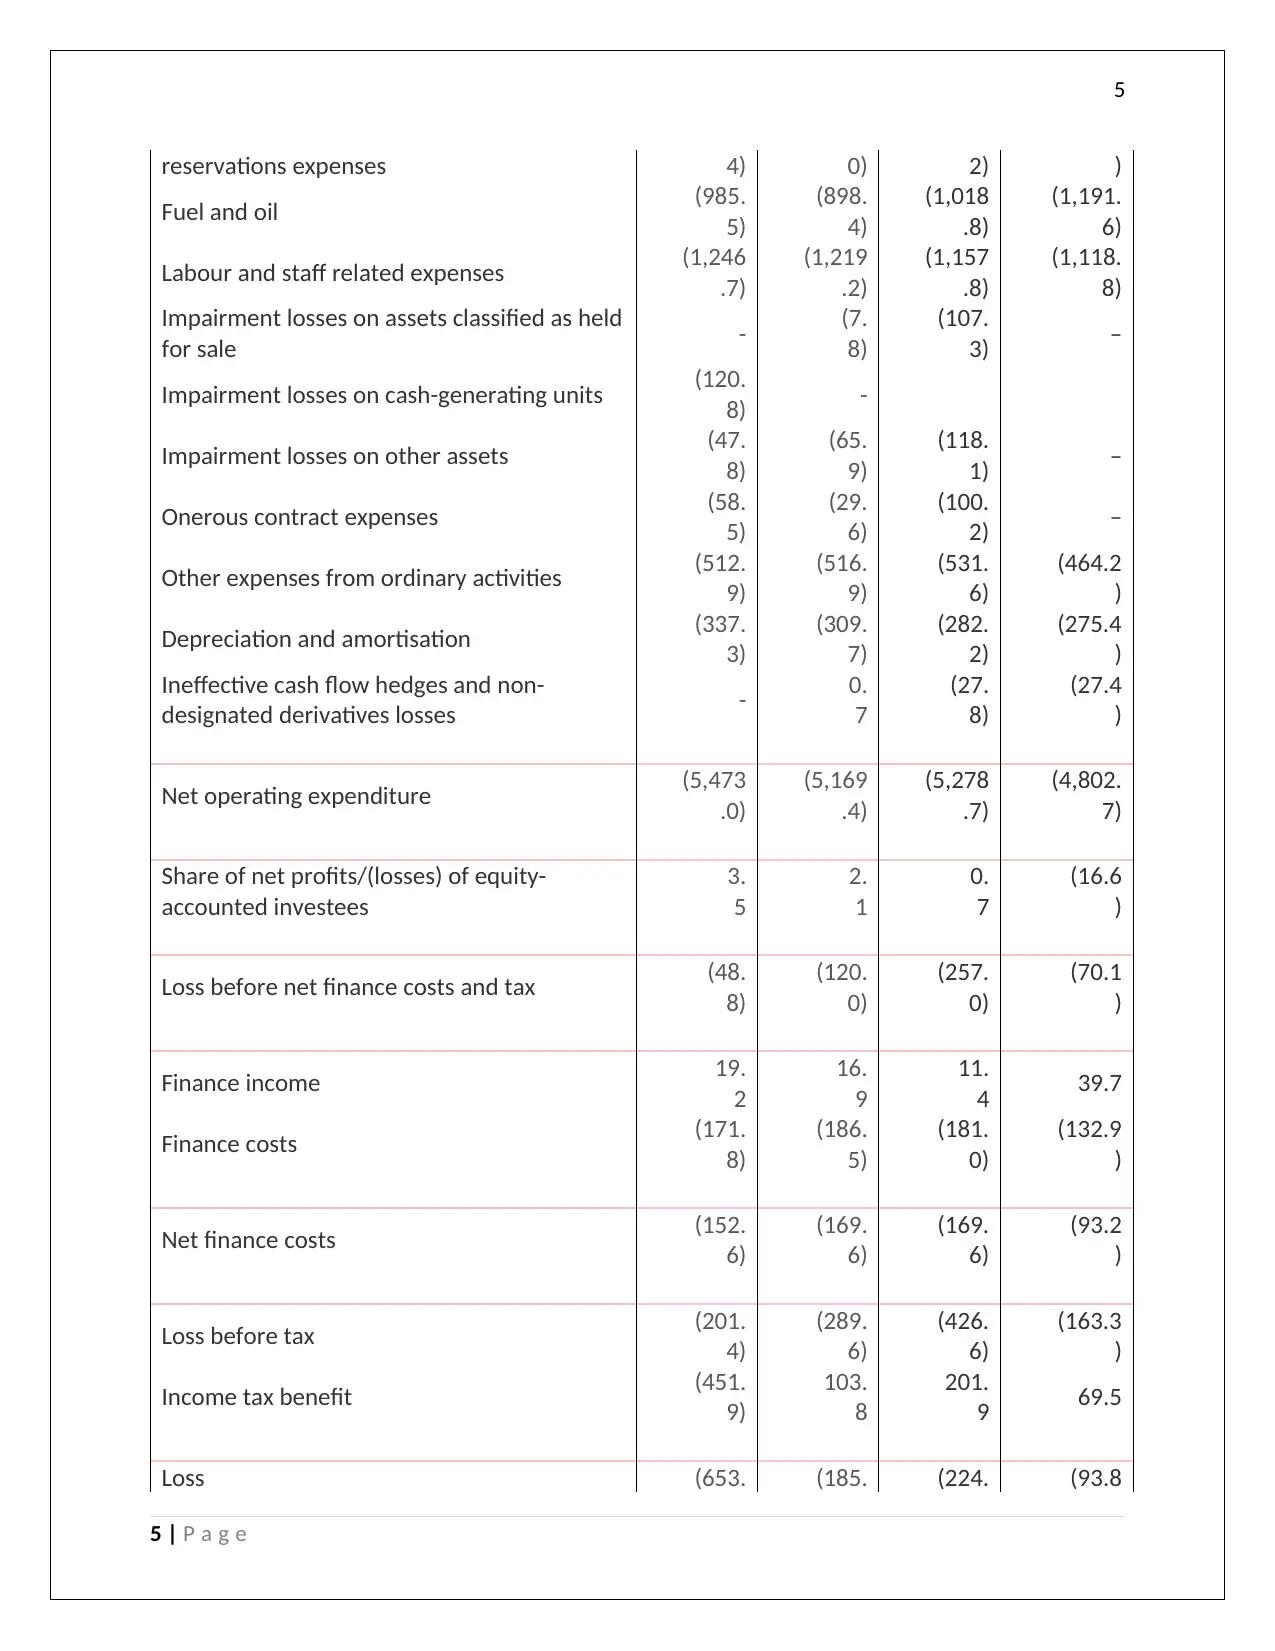
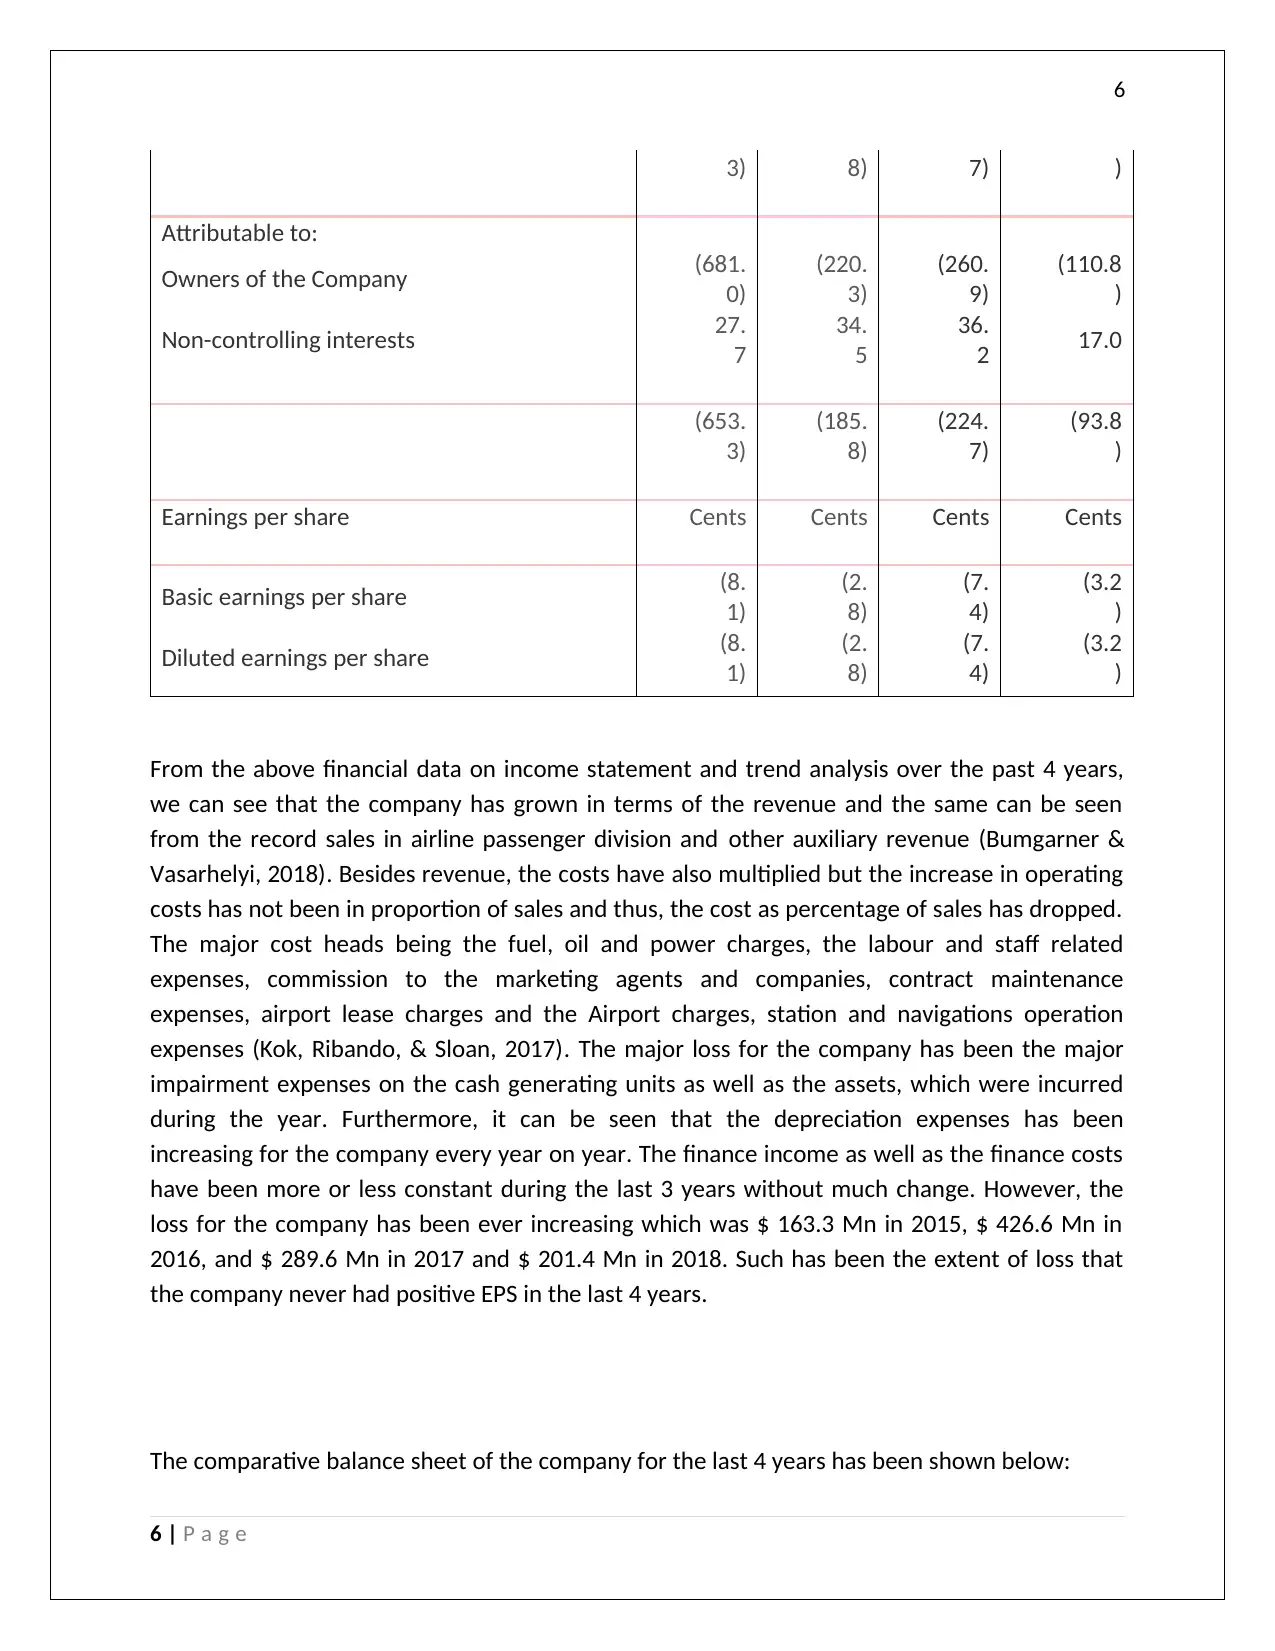
From the above financial data on income statement and trend analysis over the past 4 years,
we can see that the company has grown in terms of the revenue and the same can be seen
from the record sales in airline passenger division and other auxiliary revenue (Bumgarner &
Vasarhelyi, 2018). Besides revenue, the costs have also multiplied but the increase in operating
costs has not been in proportion of sales and thus, the cost as percentage of sales has dropped.
The major cost heads being the fuel, oil and power charges, the labour and staff related
expenses, commission to the marketing agents and companies, contract maintenance
expenses, airport lease charges and the Airport charges, station and navigations operation
expenses (Kok, Ribando, & Sloan, 2017). The major loss for the company has been the major
impairment expenses on the cash generating units as well as the assets, which were incurred
during the year. Furthermore, it can be seen that the depreciation expenses has been
increasing for the company every year on year. The finance income as well as the finance costs
have been more or less constant during the last 3 years without much change. However, the
loss for the company has been ever increasing which was $ 163.3 Mn in 2015, $ 426.6 Mn in
2016, and $ 289.6 Mn in 2017 and $ 201.4 Mn in 2018. Such has been the extent of loss that
the company never had positive EPS in the last 4 years.
The comparative balance sheet of the company for the last 4 years has been shown below:
6 | P a g e
3) 8) 7) )
Attributable to:
Owners of the Company (681.
0)
(220.
3)
(260.
9)
(110.8
)
Non-controlling interests 27.
7
34.
5
36.
2 17.0
(653.
3)
(185.
8)
(224.
7)
(93.8
)
Earnings per share Cents Cents Cents Cents
Basic earnings per share (8.
1)
(2.
8)
(7.
4)
(3.2
)
Diluted earnings per share (8.
1)
(2.
8)
(7.
4)
(3.2
)
From the above financial data on income statement and trend analysis over the past 4 years,
we can see that the company has grown in terms of the revenue and the same can be seen
from the record sales in airline passenger division and other auxiliary revenue (Bumgarner &
Vasarhelyi, 2018). Besides revenue, the costs have also multiplied but the increase in operating
costs has not been in proportion of sales and thus, the cost as percentage of sales has dropped.
The major cost heads being the fuel, oil and power charges, the labour and staff related
expenses, commission to the marketing agents and companies, contract maintenance
expenses, airport lease charges and the Airport charges, station and navigations operation
expenses (Kok, Ribando, & Sloan, 2017). The major loss for the company has been the major
impairment expenses on the cash generating units as well as the assets, which were incurred
during the year. Furthermore, it can be seen that the depreciation expenses has been
increasing for the company every year on year. The finance income as well as the finance costs
have been more or less constant during the last 3 years without much change. However, the
loss for the company has been ever increasing which was $ 163.3 Mn in 2015, $ 426.6 Mn in
2016, and $ 289.6 Mn in 2017 and $ 201.4 Mn in 2018. Such has been the extent of loss that
the company never had positive EPS in the last 4 years.
The comparative balance sheet of the company for the last 4 years has been shown below:
6 | P a g e
Paraphrase This Document
Need a fresh take? Get an instant paraphrase of this document with our AI Paraphraser
7
Virgin Australia Group
Consolidated statement of financial position
Particulars 2018 2017 2016 2015
$m $m $m $m
Current assets
Cash and cash equivalents 1,415.5 1,396.1 1,123.8 1,028.5
Receivables 281.6 308.9 313.2 312.2
Inventories 47.6 46.3 42.3 41.1
Derivative financial instruments 220.0 2.4 26.3 43.6
Other financial assets 12.1 25.2 32.2 60.3
Current tax assets – 0.2
Assets classified as held for sale - 4.3 171.6 95.4
Other 2.7 4.3 4.3 4.7
Total current assets 1,979.5 1,787.5 1,713.7 1,586.0
Non-current assets
Receivables 191.6 162.4 129.0 56.6
Derivative financial instruments 64.0 6.6 23.2 6.9
Other financial assets 284.2 292.5 265.0 234.7
Investment accounted for using the
equity method 8.2 4.6 4.0 6.6
Deferred tax assets - 554.2 423.5 216.6
Property, plant and equipment 3,031.0 2,916.6 2,872.8 3,081.9
Intangible assets 617.0 617.2 590.7 564.3
Other 12.9 14.2 18.9 26.0
Total non-current assets 4,208.9 4,568.3 4,327.1 4,193.6
Total assets 6,188.4 6,355.8 6,040.8 5,779.6
Current liabilities
Payables 807.5 679.9 708.9 701.5
Interest-bearing liabilities 295.1 280.9 875.8 440.3
Derivative financial instruments 6.6 57.1 33.4 45.6
Provisions 269.0 234.2 170.9 172.8
Unearned revenue 1,142.1 1,074.2 990.4 939.3
Other 3.6 22.0 0.4 0.3
Total current liabilities 2,523.9 2,348.3 2,779.8 2,299.8
Non-current liabilities
7 | P a g e
8
Payables 5.6 6.3 9.3 6.3
Interest-bearing liabilities 2,273.0 2,152.4 2,124.2 2,321.9
Derivative financial instruments 0.2 6.4 8.0 –
Provisions 277.6 263.5 214.6 122.4
Unearned revenue – 2.0
Other 13.1 5.1 6.1 6.4
Total non-current liabilities 2,569.5 2,433.7 2,362.2 2,459.0
Total liabilities 5,093.4 4,782.0 5,142.0 4,758.8
Net assets 1,095.0 1,573.8 898.8 1,020.8
Equity
Share capital 2,238.9 2,243.7 1,309.0 1,152.9
Reserves 268.3 58.8 117.2 177.3
Retained earnings (1,415.8) (734.8) (514.5) (253.6)
Equity attributable to the owners of the
Company 1,091.4 1,567.7 911.7 1,076.6
Non-controlling interests 3.6 6.1 (12.9) (55.8)
Total equity 1,095.0 1,573.8 898.8 1,020.8
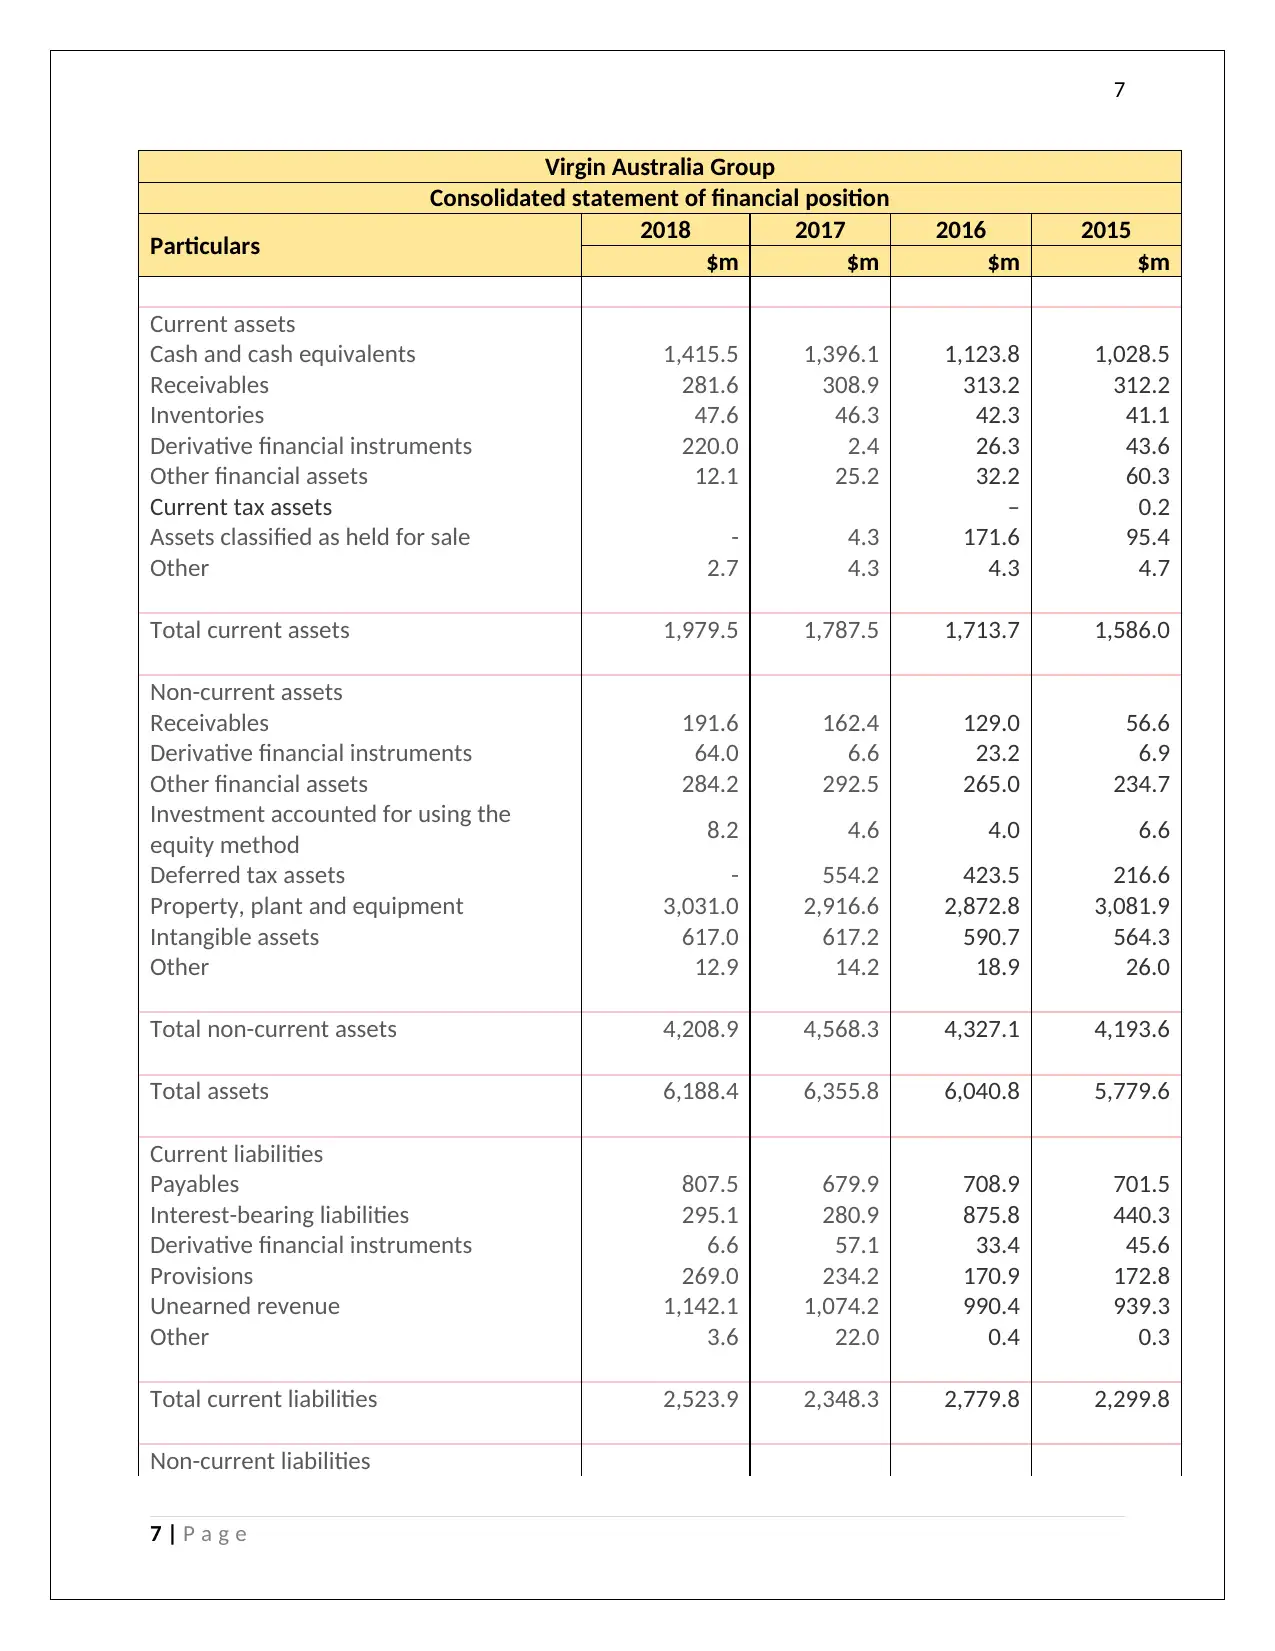
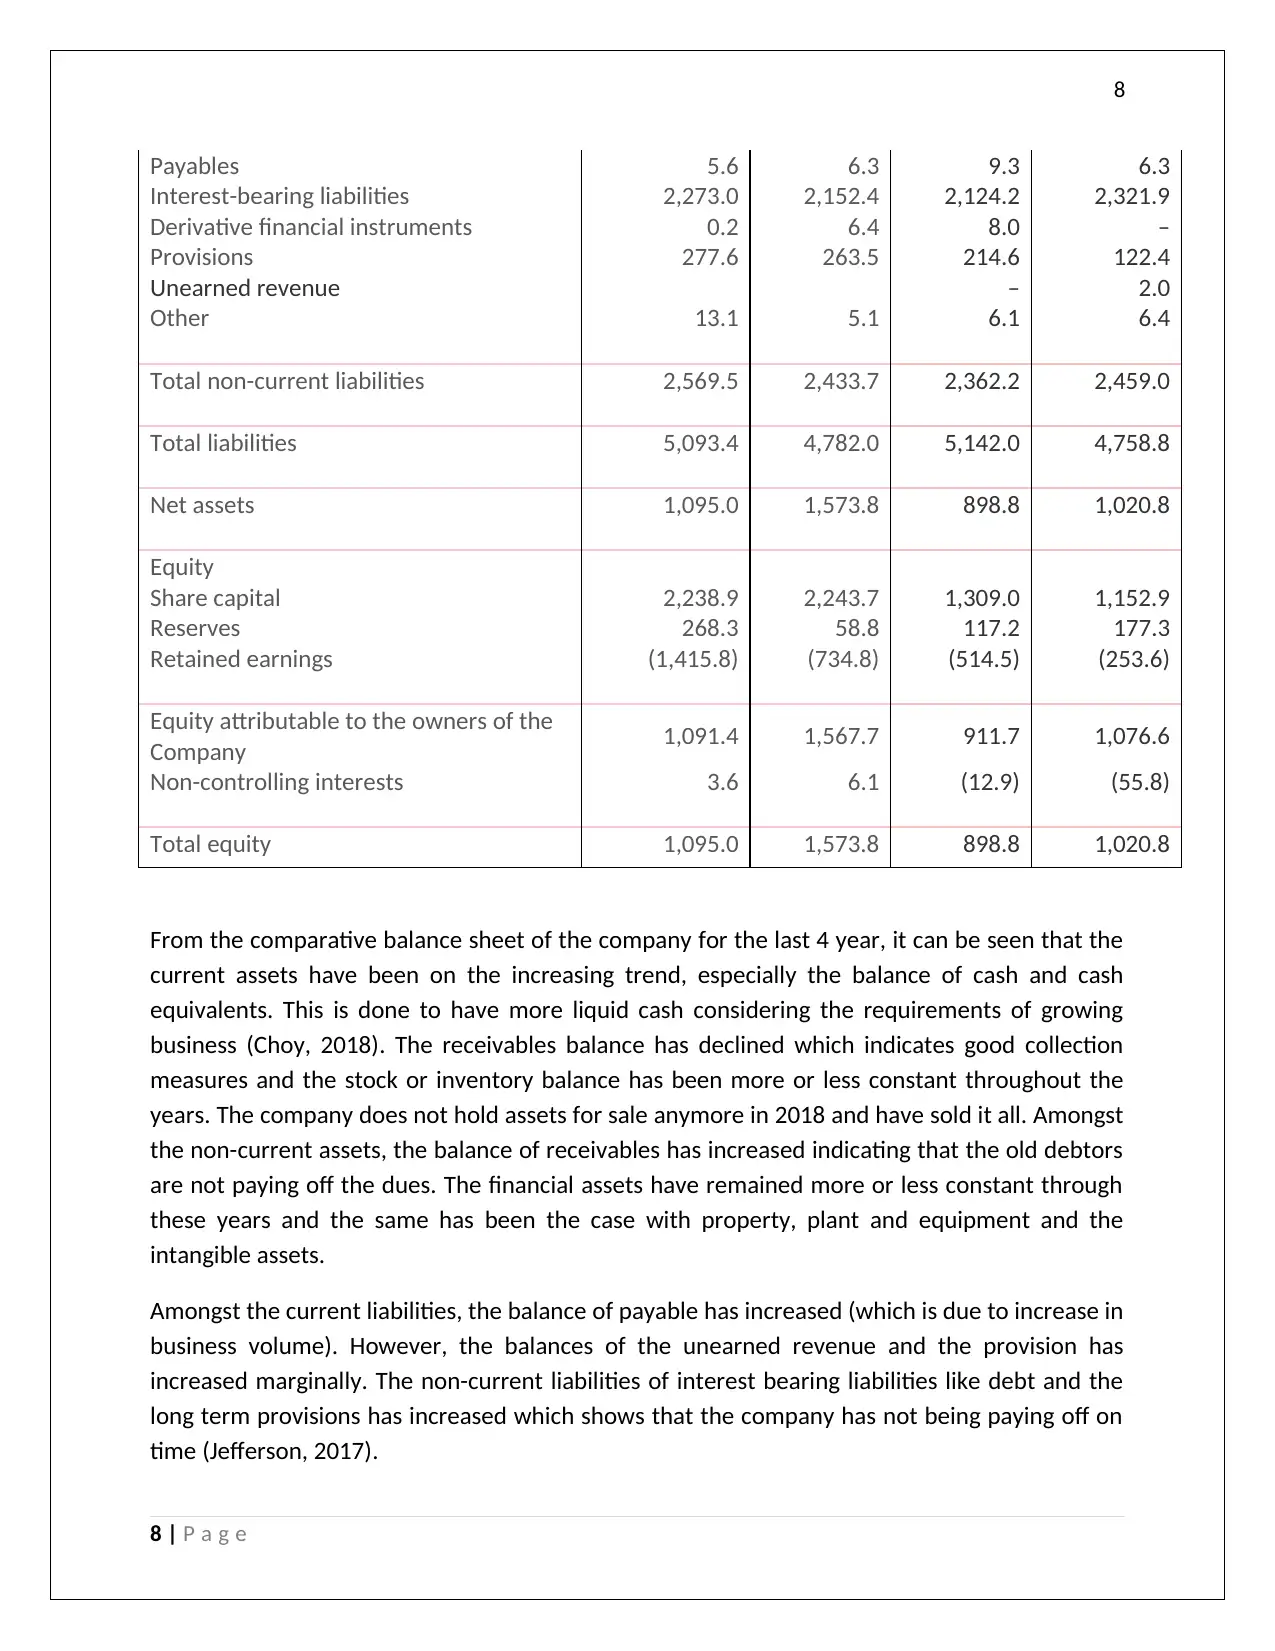
From the comparative balance sheet of the company for the last 4 year, it can be seen that the
current assets have been on the increasing trend, especially the balance of cash and cash
equivalents. This is done to have more liquid cash considering the requirements of growing
business (Choy, 2018). The receivables balance has declined which indicates good collection
measures and the stock or inventory balance has been more or less constant throughout the
years. The company does not hold assets for sale anymore in 2018 and have sold it all. Amongst
the non-current assets, the balance of receivables has increased indicating that the old debtors
are not paying off the dues. The financial assets have remained more or less constant through
these years and the same has been the case with property, plant and equipment and the
intangible assets.
Amongst the current liabilities, the balance of payable has increased (which is due to increase in
business volume). However, the balances of the unearned revenue and the provision has
increased marginally. The non-current liabilities of interest bearing liabilities like debt and the
long term provisions has increased which shows that the company has not being paying off on
time (Jefferson, 2017).
8 | P a g e
Payables 5.6 6.3 9.3 6.3
Interest-bearing liabilities 2,273.0 2,152.4 2,124.2 2,321.9
Derivative financial instruments 0.2 6.4 8.0 –
Provisions 277.6 263.5 214.6 122.4
Unearned revenue – 2.0
Other 13.1 5.1 6.1 6.4
Total non-current liabilities 2,569.5 2,433.7 2,362.2 2,459.0
Total liabilities 5,093.4 4,782.0 5,142.0 4,758.8
Net assets 1,095.0 1,573.8 898.8 1,020.8
Equity
Share capital 2,238.9 2,243.7 1,309.0 1,152.9
Reserves 268.3 58.8 117.2 177.3
Retained earnings (1,415.8) (734.8) (514.5) (253.6)
Equity attributable to the owners of the
Company 1,091.4 1,567.7 911.7 1,076.6
Non-controlling interests 3.6 6.1 (12.9) (55.8)
Total equity 1,095.0 1,573.8 898.8 1,020.8
From the comparative balance sheet of the company for the last 4 year, it can be seen that the
current assets have been on the increasing trend, especially the balance of cash and cash
equivalents. This is done to have more liquid cash considering the requirements of growing
business (Choy, 2018). The receivables balance has declined which indicates good collection
measures and the stock or inventory balance has been more or less constant throughout the
years. The company does not hold assets for sale anymore in 2018 and have sold it all. Amongst
the non-current assets, the balance of receivables has increased indicating that the old debtors
are not paying off the dues. The financial assets have remained more or less constant through
these years and the same has been the case with property, plant and equipment and the
intangible assets.
Amongst the current liabilities, the balance of payable has increased (which is due to increase in
business volume). However, the balances of the unearned revenue and the provision has
increased marginally. The non-current liabilities of interest bearing liabilities like debt and the
long term provisions has increased which shows that the company has not being paying off on
time (Jefferson, 2017).
8 | P a g e
⊘ This is a preview!⊘
Do you want full access?
Subscribe today to unlock all pages.
Trusted by 1+ million students worldwide
9
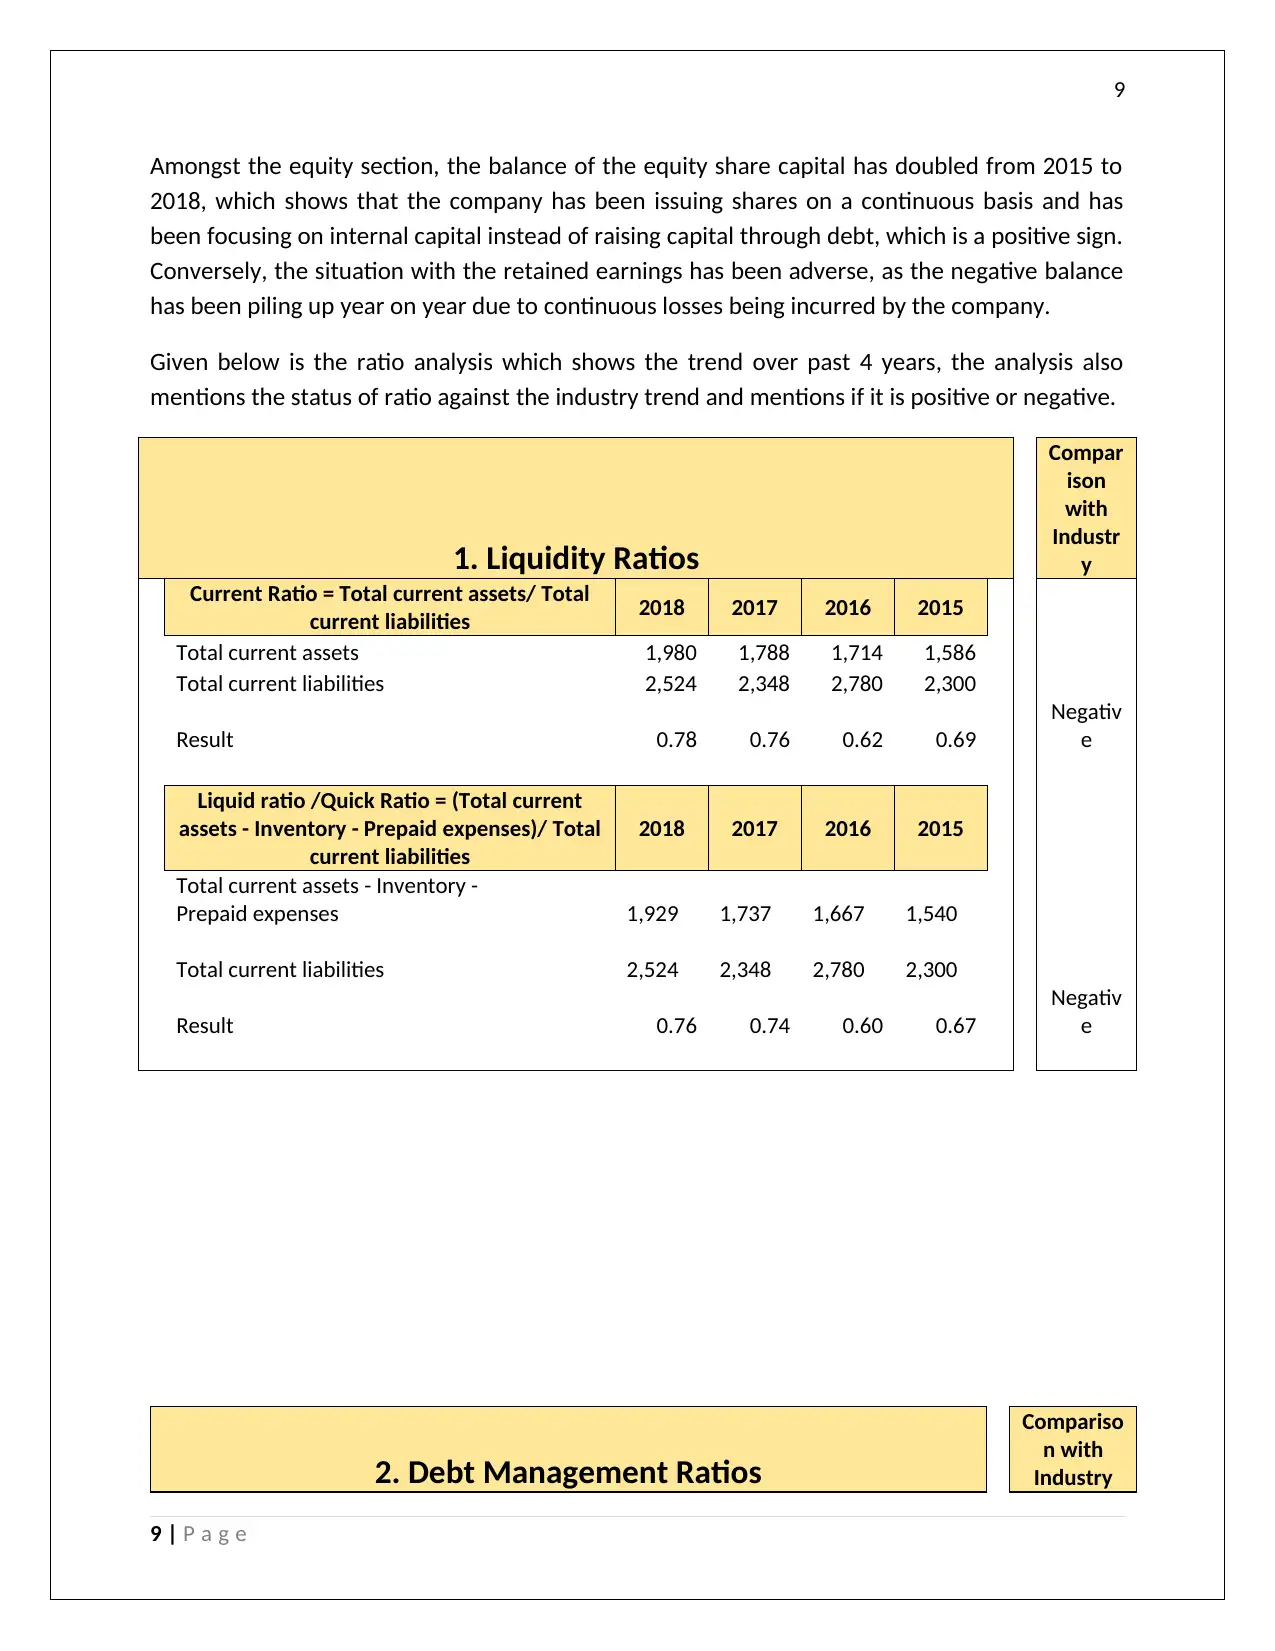
Amongst the equity section, the balance of the equity share capital has doubled from 2015 to
2018, which shows that the company has been issuing shares on a continuous basis and has
been focusing on internal capital instead of raising capital through debt, which is a positive sign.
Conversely, the situation with the retained earnings has been adverse, as the negative balance
has been piling up year on year due to continuous losses being incurred by the company.
Given below is the ratio analysis which shows the trend over past 4 years, the analysis also
mentions the status of ratio against the industry trend and mentions if it is positive or negative.
1. Liquidity Ratios
Compar
ison
with
Industr
y
Current Ratio = Total current assets/ Total
current liabilities 2018 2017 2016 2015
Total current assets 1,980 1,788 1,714 1,586
Total current liabilities 2,524 2,348 2,780 2,300
Result 0.78 0.76 0.62 0.69
Negativ
e
Liquid ratio /Quick Ratio = (Total current
assets - Inventory - Prepaid expenses)/ Total
current liabilities
2018 2017 2016 2015
Total current assets - Inventory -
Prepaid expenses 1,929 1,737 1,667 1,540
Total current liabilities 2,524 2,348 2,780 2,300
Result 0.76 0.74 0.60 0.67
Negativ
e
2. Debt Management Ratios
Compariso
n with
Industry
9 | P a g e
Paraphrase This Document
Need a fresh take? Get an instant paraphrase of this document with our AI Paraphraser
10
Debt ratio = (Total Debts /
Total Assets) or ((Total assets-
total owners' equity)/total
assets)
2018 2017 2016 2015
Total Debts
2,27
9
2,15
9
2,13
4
2,32
8
Total Assets
6,18
8
6,35
6
6,04
1
5,78
0
Result 37% 34% 35% 40% Positive
Debt to Equity Ratio = (Total
Debt/Total owners' equity) or
((Total assets- total owners'
equity)/total owners' equity)
2018 2017 2016 2015
Total Debts
2,27
9
2,15
9
2,13
4
2,32
8
Total owners'
equity
1,09
5
1,57
4
89
9
1,02
1
Result 208% 137% 237% 228% Negative
3. Asset management Ratios
Compar
ison
with
Industr
y
Receivables Turnover Ratio =
Sales/Accounts Receivable 2018 2017 2016 2015
Sales
5,
421
5,
047
5,
021
4,
749
Accounts Receivable 473 471 442 369
Result 11.46 10.71 11.35 12.88 Positive
Days Receivable = 365/Receivable
turnover 2018 2017 2016 2015
No. of days 365 365 365 365
Receivable turnover 11.46 10.71 11.35 12.88
Result 31.86 34.08 32.15 28.34 Positive
Inventory Turnover = COGS/Inventory 2018 2017 2016 2015
COGS
4,
396
4,
240
4,
112
4,
036
Inventory 48 46 42 41
10 | P a g e
11
Result 92.35 91.58 97.20 98.19
Negativ
e
Days' Inventory = 365/Inventory Turnover 2018 2017 2016 2015
No. of days 365 365 365 365
Inventory turnover 92.35 91.58 97.20 98.19
Result 3.95 3.99 3.76 3.72
Negativ
e
4. Profitability ratios
Compari
son
with
Industry
Profit Margin / Net Profit ratio = Net
income / Sales 2018 2017 2016 2015
Net income
(2
01)
(
290)
(4
27)
(1
63)
Sales
5,
421
5,
047
5,
021
4,
749
Result -3.72% -5.74% -8.50% -3.44%
Negativ
e
Operating Margin ratio = Operating
Profit/Sales 2018 2017 2016 2015
Operating Profit (49)
(
120)
(2
57) (70)
Sales
5,
421
5,
047
5,
021
4,
749
Result -0.90% -2.38% -5.12% -1.48%
Negativ
e
Return on Equity = Net income/total
owners' equity 2018 2017 2016 2015
Net income
(2
01)
(
290)
(4
27)
(1
63)
Total owners' equity
1,
095
1,
574 899
1,
021
Result -18.39%
-
18.40% -47.46% -16.00%
Negativ
e
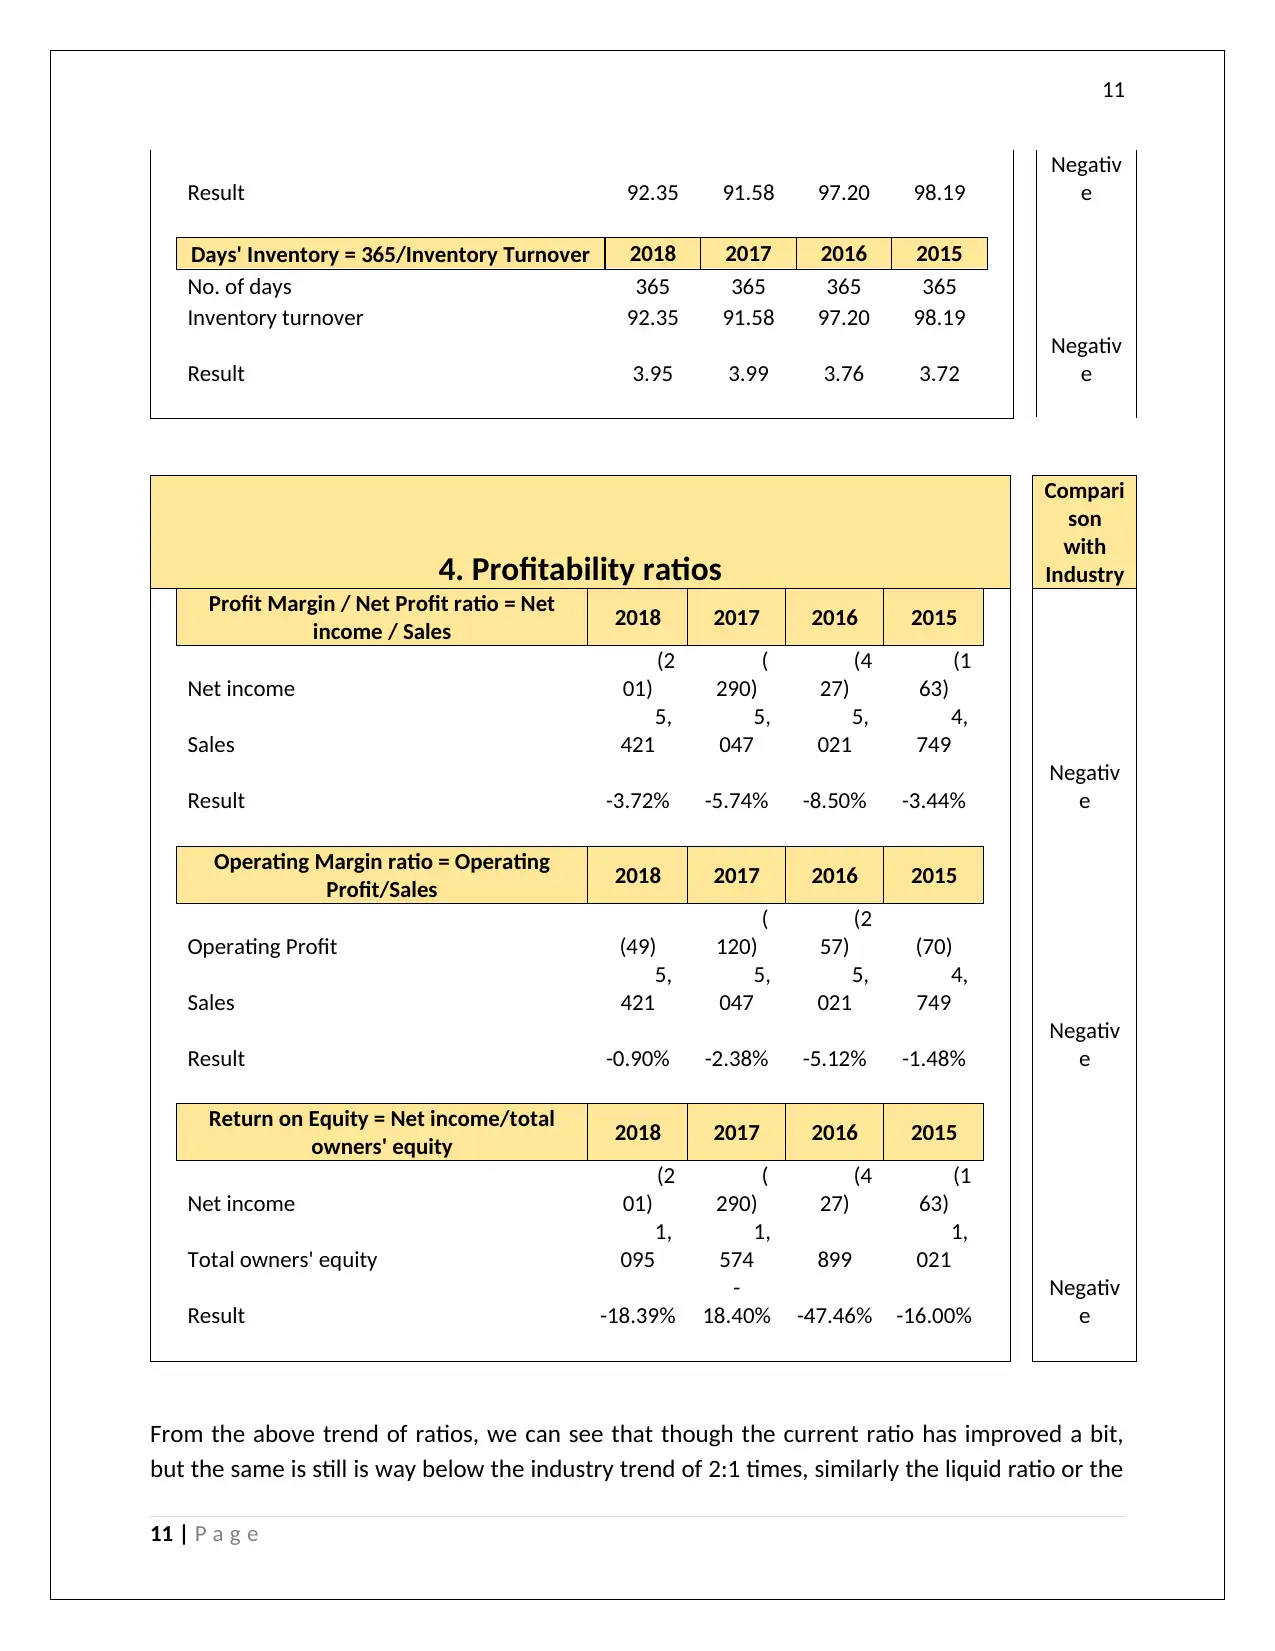
From the above trend of ratios, we can see that though the current ratio has improved a bit,
but the same is still is way below the industry trend of 2:1 times, similarly the liquid ratio or the
11 | P a g e
Result 92.35 91.58 97.20 98.19
Negativ
e
Days' Inventory = 365/Inventory Turnover 2018 2017 2016 2015
No. of days 365 365 365 365
Inventory turnover 92.35 91.58 97.20 98.19
Result 3.95 3.99 3.76 3.72
Negativ
e
4. Profitability ratios
Compari
son
with
Industry
Profit Margin / Net Profit ratio = Net
income / Sales 2018 2017 2016 2015
Net income
(2
01)
(
290)
(4
27)
(1
63)
Sales
5,
421
5,
047
5,
021
4,
749
Result -3.72% -5.74% -8.50% -3.44%
Negativ
e
Operating Margin ratio = Operating
Profit/Sales 2018 2017 2016 2015
Operating Profit (49)
(
120)
(2
57) (70)
Sales
5,
421
5,
047
5,
021
4,
749
Result -0.90% -2.38% -5.12% -1.48%
Negativ
e
Return on Equity = Net income/total
owners' equity 2018 2017 2016 2015
Net income
(2
01)
(
290)
(4
27)
(1
63)
Total owners' equity
1,
095
1,
574 899
1,
021
Result -18.39%
-
18.40% -47.46% -16.00%
Negativ
e
From the above trend of ratios, we can see that though the current ratio has improved a bit,
but the same is still is way below the industry trend of 2:1 times, similarly the liquid ratio or the
11 | P a g e
⊘ This is a preview!⊘
Do you want full access?
Subscribe today to unlock all pages.
Trusted by 1+ million students worldwide
1 out of 18
Related Documents


Your All-in-One AI-Powered Toolkit for Academic Success.
+13062052269
info@desklib.com
Available 24*7 on WhatsApp / Email
![[object Object]](/_next/static/media/star-bottom.7253800d.svg)
Unlock your academic potential
Copyright © 2020–2026 A2Z Services. All Rights Reserved. Developed and managed by ZUCOL.