Analyzing Virgin Mobile USA's Pricing Strategy: A Finance Case
VerifiedAdded on 2023/04/24
|10
|3259
|424
Case Study
AI Summary
This case study provides a detailed financial analysis of Virgin Mobile USA's pricing strategy as it enters the competitive US wireless market. It examines different customer acquisition and retention approaches, including contract-based and prepaid models, and their impact on customer lifetime value (CLTV) and break-even points. The analysis includes calculations for churn rates, retention rates, average monthly margin per customer, cost of acquisition, and per-unit pricing. It explores the profitability of different strategies and the factors influencing Virgin Mobile's pricing decisions, offering insights into the challenges and opportunities faced by the company. The document provides comprehensive calculations and assumptions, offering a framework for understanding the financial implications of Virgin Mobile's strategic choices. Desklib provides a platform for students to access this document and other solved assignments.
Finance- Pricing
Introduction
The case study deals with entry of a new competitor in America’s wireless market space and
discussions regarding the present status of telecom market and possible strategies that can be
adopted by Virgin Mobile USA under the able guidance of Dan Schulman to enter the highly
competitive market of USA.
The case study also discusses the two methods of charging customers under a fixed contract
system based on credit rating of customer which accounts for more than 90% of telecom
market business while the left out portion comes from the variable prepaid system.
Answers
Answer 1(i)
Part A
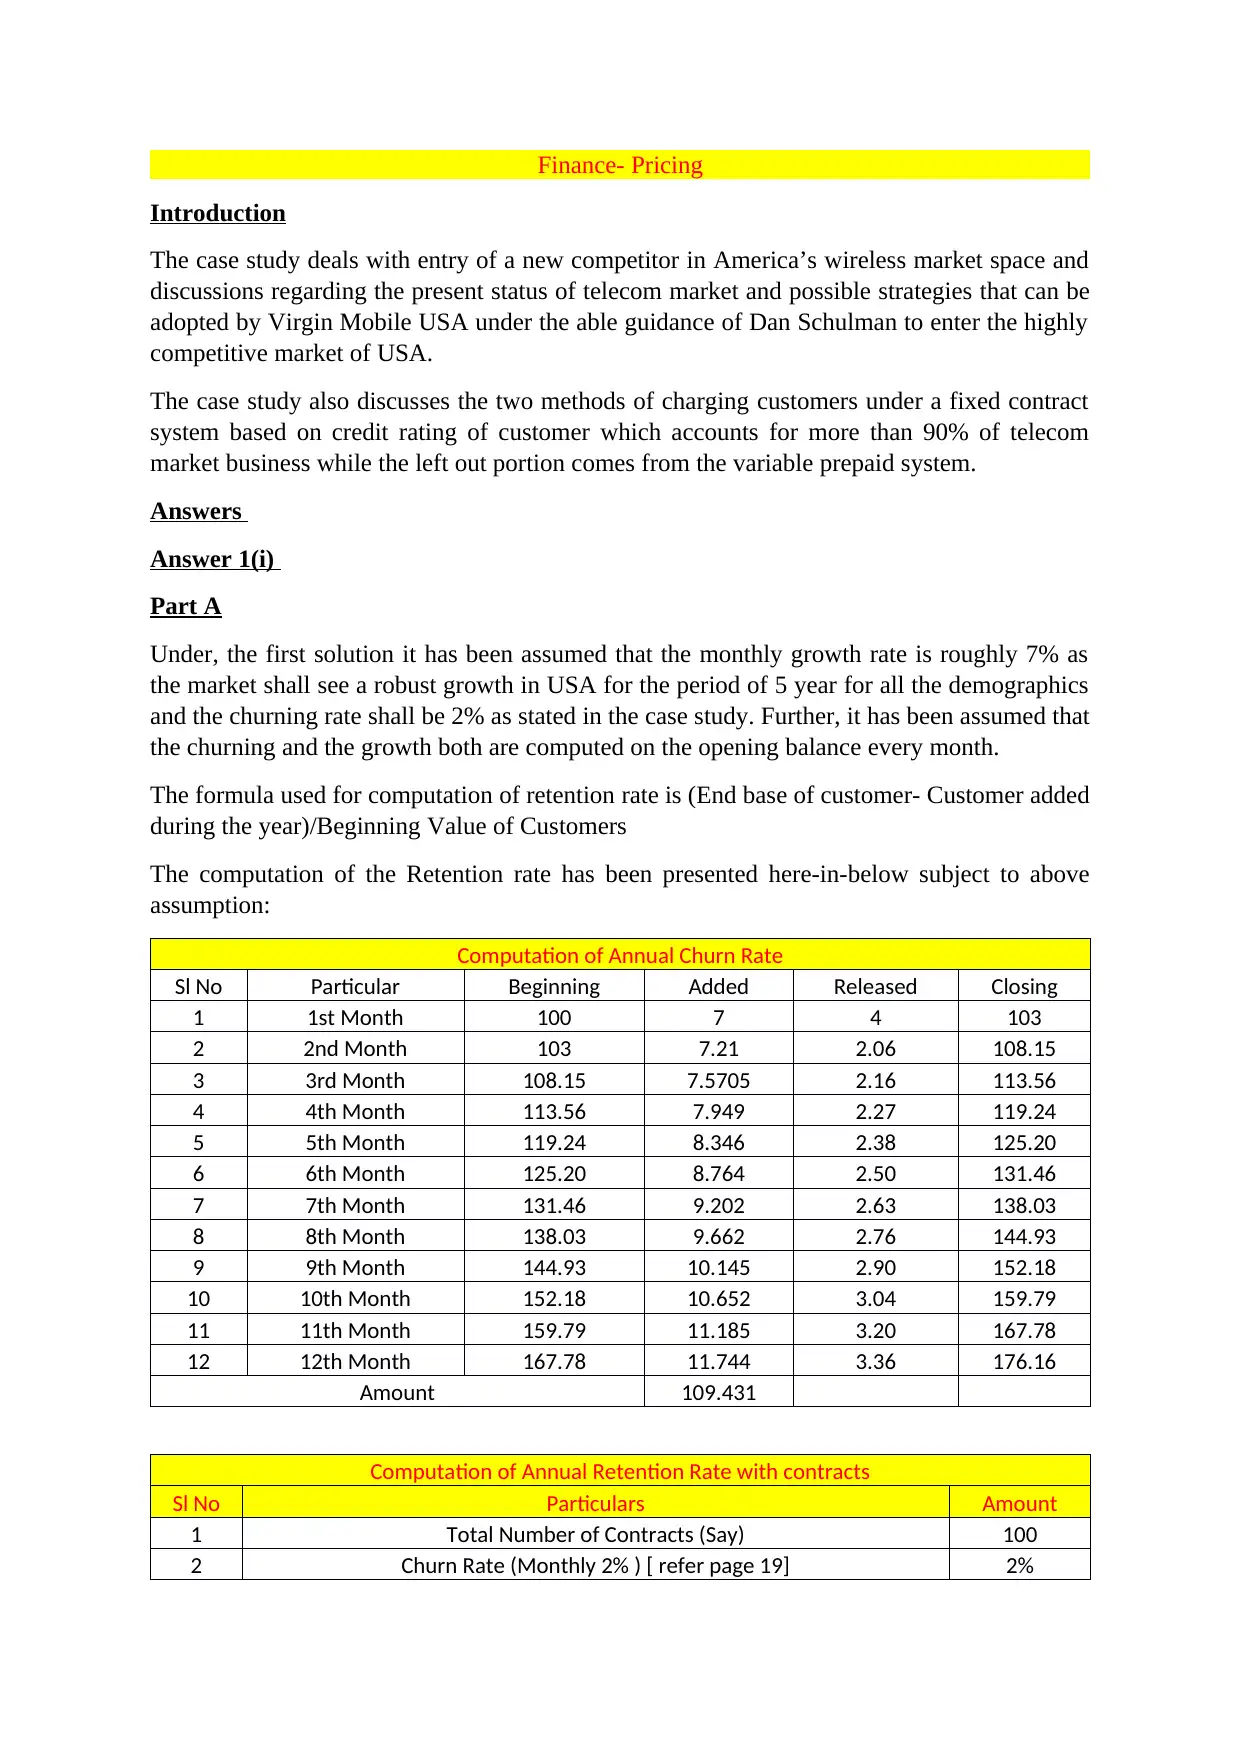
Under, the first solution it has been assumed that the monthly growth rate is roughly 7% as
the market shall see a robust growth in USA for the period of 5 year for all the demographics
and the churning rate shall be 2% as stated in the case study. Further, it has been assumed that
the churning and the growth both are computed on the opening balance every month.
The formula used for computation of retention rate is (End base of customer- Customer added
during the year)/Beginning Value of Customers
The computation of the Retention rate has been presented here-in-below subject to above
assumption:
Computation of Annual Churn Rate
Sl No Particular Beginning Added Released Closing
1 1st Month 100 7 4 103
2 2nd Month 103 7.21 2.06 108.15
3 3rd Month 108.15 7.5705 2.16 113.56
4 4th Month 113.56 7.949 2.27 119.24
5 5th Month 119.24 8.346 2.38 125.20
6 6th Month 125.20 8.764 2.50 131.46
7 7th Month 131.46 9.202 2.63 138.03
8 8th Month 138.03 9.662 2.76 144.93
9 9th Month 144.93 10.145 2.90 152.18
10 10th Month 152.18 10.652 3.04 159.79
11 11th Month 159.79 11.185 3.20 167.78
12 12th Month 167.78 11.744 3.36 176.16
Amount 109.431
Computation of Annual Retention Rate with contracts
Sl No Particulars Amount
1 Total Number of Contracts (Say) 100
2 Churn Rate (Monthly 2% ) [ refer page 19] 2%
Introduction
The case study deals with entry of a new competitor in America’s wireless market space and
discussions regarding the present status of telecom market and possible strategies that can be
adopted by Virgin Mobile USA under the able guidance of Dan Schulman to enter the highly
competitive market of USA.
The case study also discusses the two methods of charging customers under a fixed contract
system based on credit rating of customer which accounts for more than 90% of telecom
market business while the left out portion comes from the variable prepaid system.
Answers
Answer 1(i)
Part A
Under, the first solution it has been assumed that the monthly growth rate is roughly 7% as
the market shall see a robust growth in USA for the period of 5 year for all the demographics
and the churning rate shall be 2% as stated in the case study. Further, it has been assumed that
the churning and the growth both are computed on the opening balance every month.
The formula used for computation of retention rate is (End base of customer- Customer added
during the year)/Beginning Value of Customers
The computation of the Retention rate has been presented here-in-below subject to above
assumption:
Computation of Annual Churn Rate
Sl No Particular Beginning Added Released Closing
1 1st Month 100 7 4 103
2 2nd Month 103 7.21 2.06 108.15
3 3rd Month 108.15 7.5705 2.16 113.56
4 4th Month 113.56 7.949 2.27 119.24
5 5th Month 119.24 8.346 2.38 125.20
6 6th Month 125.20 8.764 2.50 131.46
7 7th Month 131.46 9.202 2.63 138.03
8 8th Month 138.03 9.662 2.76 144.93
9 9th Month 144.93 10.145 2.90 152.18
10 10th Month 152.18 10.652 3.04 159.79
11 11th Month 159.79 11.185 3.20 167.78
12 12th Month 167.78 11.744 3.36 176.16
Amount 109.431
Computation of Annual Retention Rate with contracts
Sl No Particulars Amount
1 Total Number of Contracts (Say) 100
2 Churn Rate (Monthly 2% ) [ refer page 19] 2%
Paraphrase This Document
Need a fresh take? Get an instant paraphrase of this document with our AI Paraphraser
Computation of Annual Retention Rate with contracts
Sl No Particulars Amount
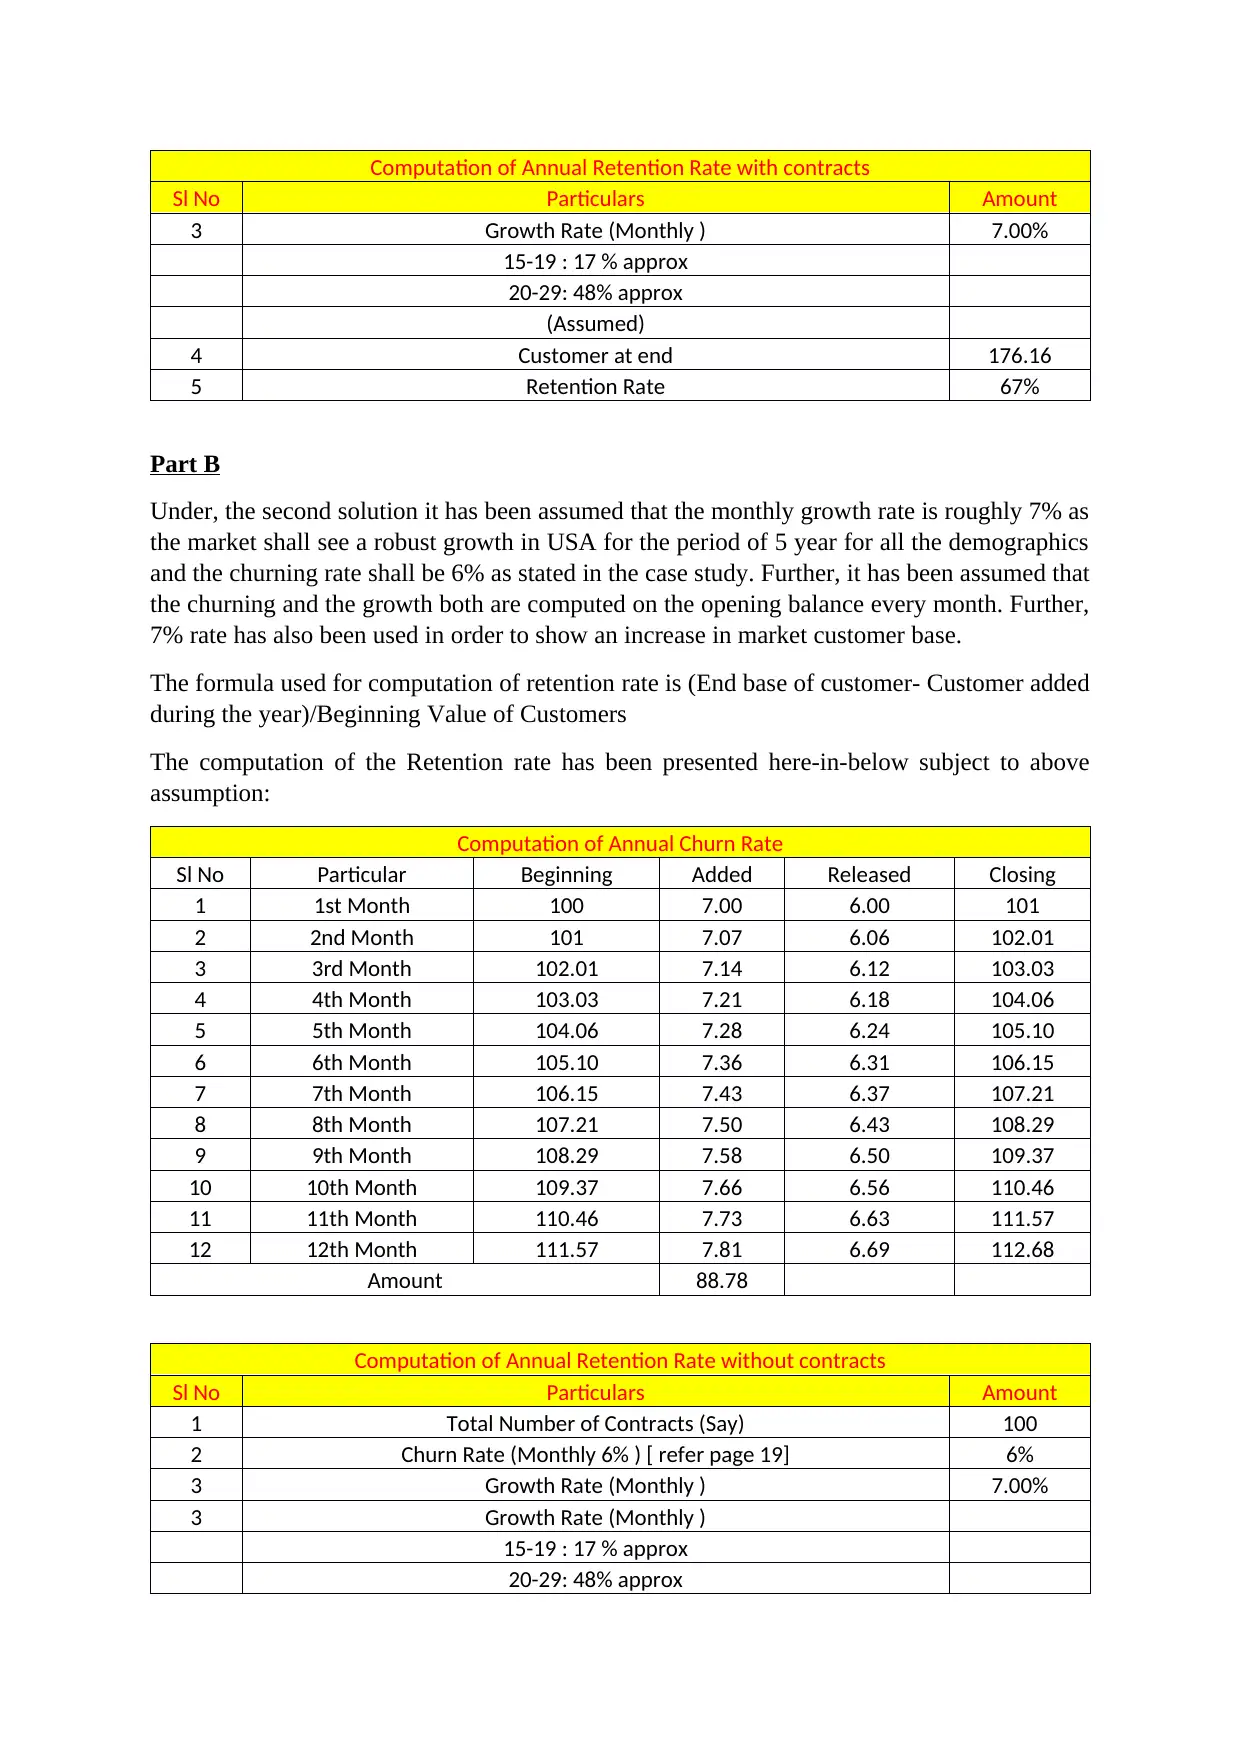
3 Growth Rate (Monthly ) 7.00%
15-19 : 17 % approx
20-29: 48% approx
(Assumed)
4 Customer at end 176.16
5 Retention Rate 67%
Part B
Under, the second solution it has been assumed that the monthly growth rate is roughly 7% as
the market shall see a robust growth in USA for the period of 5 year for all the demographics
and the churning rate shall be 6% as stated in the case study. Further, it has been assumed that
the churning and the growth both are computed on the opening balance every month. Further,
7% rate has also been used in order to show an increase in market customer base.
The formula used for computation of retention rate is (End base of customer- Customer added
during the year)/Beginning Value of Customers
The computation of the Retention rate has been presented here-in-below subject to above
assumption:
Computation of Annual Churn Rate
Sl No Particular Beginning Added Released Closing
1 1st Month 100 7.00 6.00 101
2 2nd Month 101 7.07 6.06 102.01
3 3rd Month 102.01 7.14 6.12 103.03
4 4th Month 103.03 7.21 6.18 104.06
5 5th Month 104.06 7.28 6.24 105.10
6 6th Month 105.10 7.36 6.31 106.15
7 7th Month 106.15 7.43 6.37 107.21
8 8th Month 107.21 7.50 6.43 108.29
9 9th Month 108.29 7.58 6.50 109.37
10 10th Month 109.37 7.66 6.56 110.46
11 11th Month 110.46 7.73 6.63 111.57
12 12th Month 111.57 7.81 6.69 112.68
Amount 88.78
Computation of Annual Retention Rate without contracts
Sl No Particulars Amount
1 Total Number of Contracts (Say) 100
2 Churn Rate (Monthly 6% ) [ refer page 19] 6%
3 Growth Rate (Monthly ) 7.00%
3 Growth Rate (Monthly )
15-19 : 17 % approx
20-29: 48% approx
Sl No Particulars Amount
3 Growth Rate (Monthly ) 7.00%
15-19 : 17 % approx
20-29: 48% approx
(Assumed)
4 Customer at end 176.16
5 Retention Rate 67%
Part B
Under, the second solution it has been assumed that the monthly growth rate is roughly 7% as
the market shall see a robust growth in USA for the period of 5 year for all the demographics
and the churning rate shall be 6% as stated in the case study. Further, it has been assumed that
the churning and the growth both are computed on the opening balance every month. Further,
7% rate has also been used in order to show an increase in market customer base.
The formula used for computation of retention rate is (End base of customer- Customer added
during the year)/Beginning Value of Customers
The computation of the Retention rate has been presented here-in-below subject to above
assumption:
Computation of Annual Churn Rate
Sl No Particular Beginning Added Released Closing
1 1st Month 100 7.00 6.00 101
2 2nd Month 101 7.07 6.06 102.01
3 3rd Month 102.01 7.14 6.12 103.03
4 4th Month 103.03 7.21 6.18 104.06
5 5th Month 104.06 7.28 6.24 105.10
6 6th Month 105.10 7.36 6.31 106.15
7 7th Month 106.15 7.43 6.37 107.21
8 8th Month 107.21 7.50 6.43 108.29
9 9th Month 108.29 7.58 6.50 109.37
10 10th Month 109.37 7.66 6.56 110.46
11 11th Month 110.46 7.73 6.63 111.57
12 12th Month 111.57 7.81 6.69 112.68
Amount 88.78
Computation of Annual Retention Rate without contracts
Sl No Particulars Amount
1 Total Number of Contracts (Say) 100
2 Churn Rate (Monthly 6% ) [ refer page 19] 6%
3 Growth Rate (Monthly ) 7.00%
3 Growth Rate (Monthly )
15-19 : 17 % approx
20-29: 48% approx
Computation of Annual Retention Rate without contracts
Sl No Particulars Amount
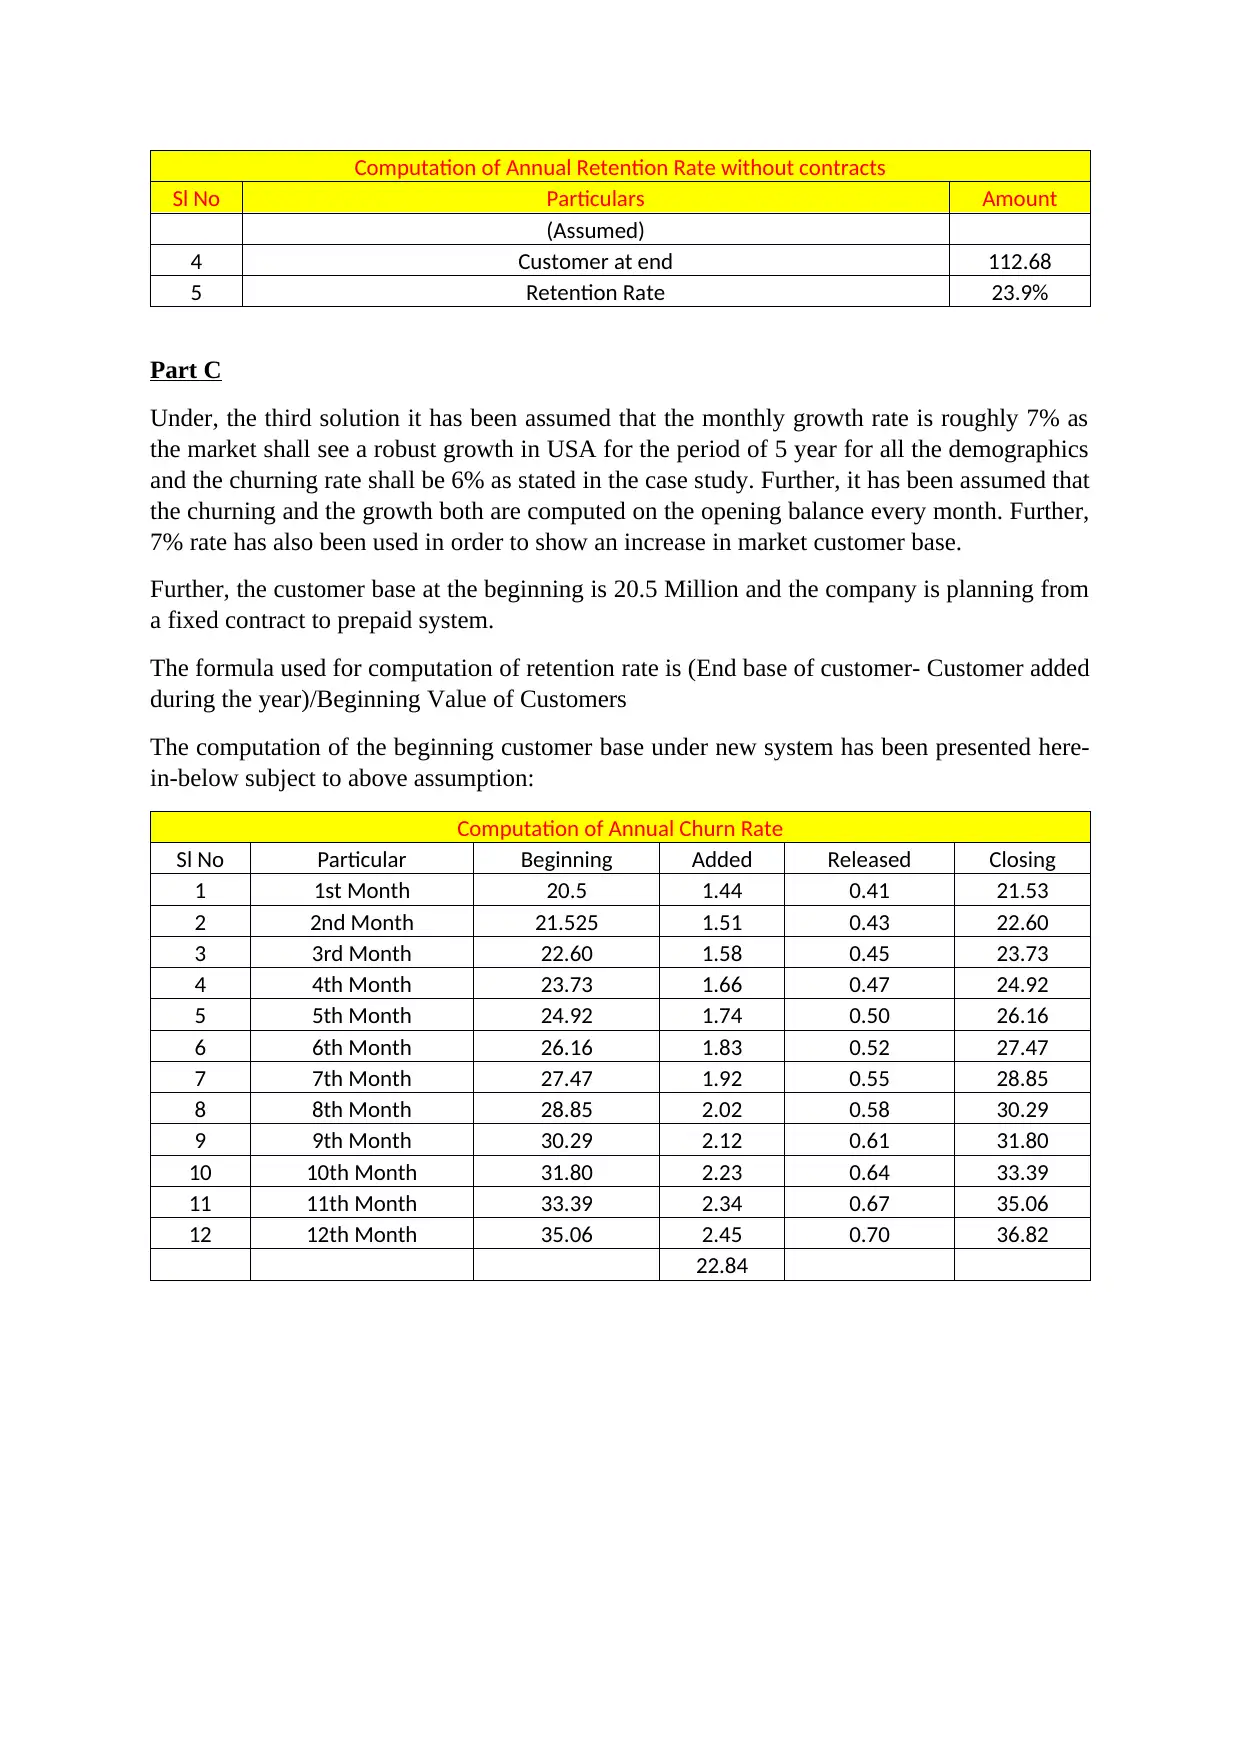
(Assumed)
4 Customer at end 112.68
5 Retention Rate 23.9%
Part C
Under, the third solution it has been assumed that the monthly growth rate is roughly 7% as
the market shall see a robust growth in USA for the period of 5 year for all the demographics
and the churning rate shall be 6% as stated in the case study. Further, it has been assumed that
the churning and the growth both are computed on the opening balance every month. Further,
7% rate has also been used in order to show an increase in market customer base.
Further, the customer base at the beginning is 20.5 Million and the company is planning from
a fixed contract to prepaid system.
The formula used for computation of retention rate is (End base of customer- Customer added
during the year)/Beginning Value of Customers
The computation of the beginning customer base under new system has been presented here-
in-below subject to above assumption:
Computation of Annual Churn Rate
Sl No Particular Beginning Added Released Closing
1 1st Month 20.5 1.44 0.41 21.53
2 2nd Month 21.525 1.51 0.43 22.60
3 3rd Month 22.60 1.58 0.45 23.73
4 4th Month 23.73 1.66 0.47 24.92
5 5th Month 24.92 1.74 0.50 26.16
6 6th Month 26.16 1.83 0.52 27.47
7 7th Month 27.47 1.92 0.55 28.85
8 8th Month 28.85 2.02 0.58 30.29
9 9th Month 30.29 2.12 0.61 31.80
10 10th Month 31.80 2.23 0.64 33.39
11 11th Month 33.39 2.34 0.67 35.06
12 12th Month 35.06 2.45 0.70 36.82
22.84
Sl No Particulars Amount
(Assumed)
4 Customer at end 112.68
5 Retention Rate 23.9%
Part C
Under, the third solution it has been assumed that the monthly growth rate is roughly 7% as
the market shall see a robust growth in USA for the period of 5 year for all the demographics
and the churning rate shall be 6% as stated in the case study. Further, it has been assumed that
the churning and the growth both are computed on the opening balance every month. Further,
7% rate has also been used in order to show an increase in market customer base.
Further, the customer base at the beginning is 20.5 Million and the company is planning from
a fixed contract to prepaid system.
The formula used for computation of retention rate is (End base of customer- Customer added
during the year)/Beginning Value of Customers
The computation of the beginning customer base under new system has been presented here-
in-below subject to above assumption:
Computation of Annual Churn Rate
Sl No Particular Beginning Added Released Closing
1 1st Month 20.5 1.44 0.41 21.53
2 2nd Month 21.525 1.51 0.43 22.60
3 3rd Month 22.60 1.58 0.45 23.73
4 4th Month 23.73 1.66 0.47 24.92
5 5th Month 24.92 1.74 0.50 26.16
6 6th Month 26.16 1.83 0.52 27.47
7 7th Month 27.47 1.92 0.55 28.85
8 8th Month 28.85 2.02 0.58 30.29
9 9th Month 30.29 2.12 0.61 31.80
10 10th Month 31.80 2.23 0.64 33.39
11 11th Month 33.39 2.34 0.67 35.06
12 12th Month 35.06 2.45 0.70 36.82
22.84
⊘ This is a preview!⊘
Do you want full access?
Subscribe today to unlock all pages.
Trusted by 1+ million students worldwide
Computation of Number of Customers to be added with contracts
Sl No Particulars Amount
1 Total Number of initial Contracts (Say) 20.5
2 Churn Rate (Monthly 2% ) [ refer page 19] 2%
3 Growth Rate (Monthly ) 7.00%
15-19 : 17 % approx
20-29: 48% approx
(Assumed)
4 Customer at end 36.82
5 Retention Rate 68%
Computation of Annual Churn Rate
Sl No Particular Beginning Added Released Closing
1 1st Month 56.45 3.95 3.39 54.48
2 2nd Month 54.48 3.81 3.27 52.57
3 3rd Month 52.57 3.68 3.15 50.73
4 4th Month 50.73 3.55 3.04 48.96
5 5th Month 48.96 3.43 2.94 47.24
6 6th Month 47.24 3.31 2.83 45.59
7 7th Month 45.59 3.19 2.74 43.99
8 8th Month 43.99 3.08 2.64 42.45
9 9th Month 42.45 2.97 2.55 40.97
10 10th Month 40.97 2.87 2.46 39.53
11 11th Month 39.53 2.77 2.37 38.15
12 12th Month 38.15 2.67 2.29 36.82
Total 39.28
Computation of Number of Customers to be added with contracts
1 Closing Customer 36.82
2 Retention Rate 23.9%
3 Churn Rate 6%
4 Initial Customer Base Required 56.45
5 Initial Customer Base existing' 20.5
6 Additional Customer Required 35.95
7 Cost of Acquisition per customer (Refer page No 3) 370
8 Total Cost 13303.12289
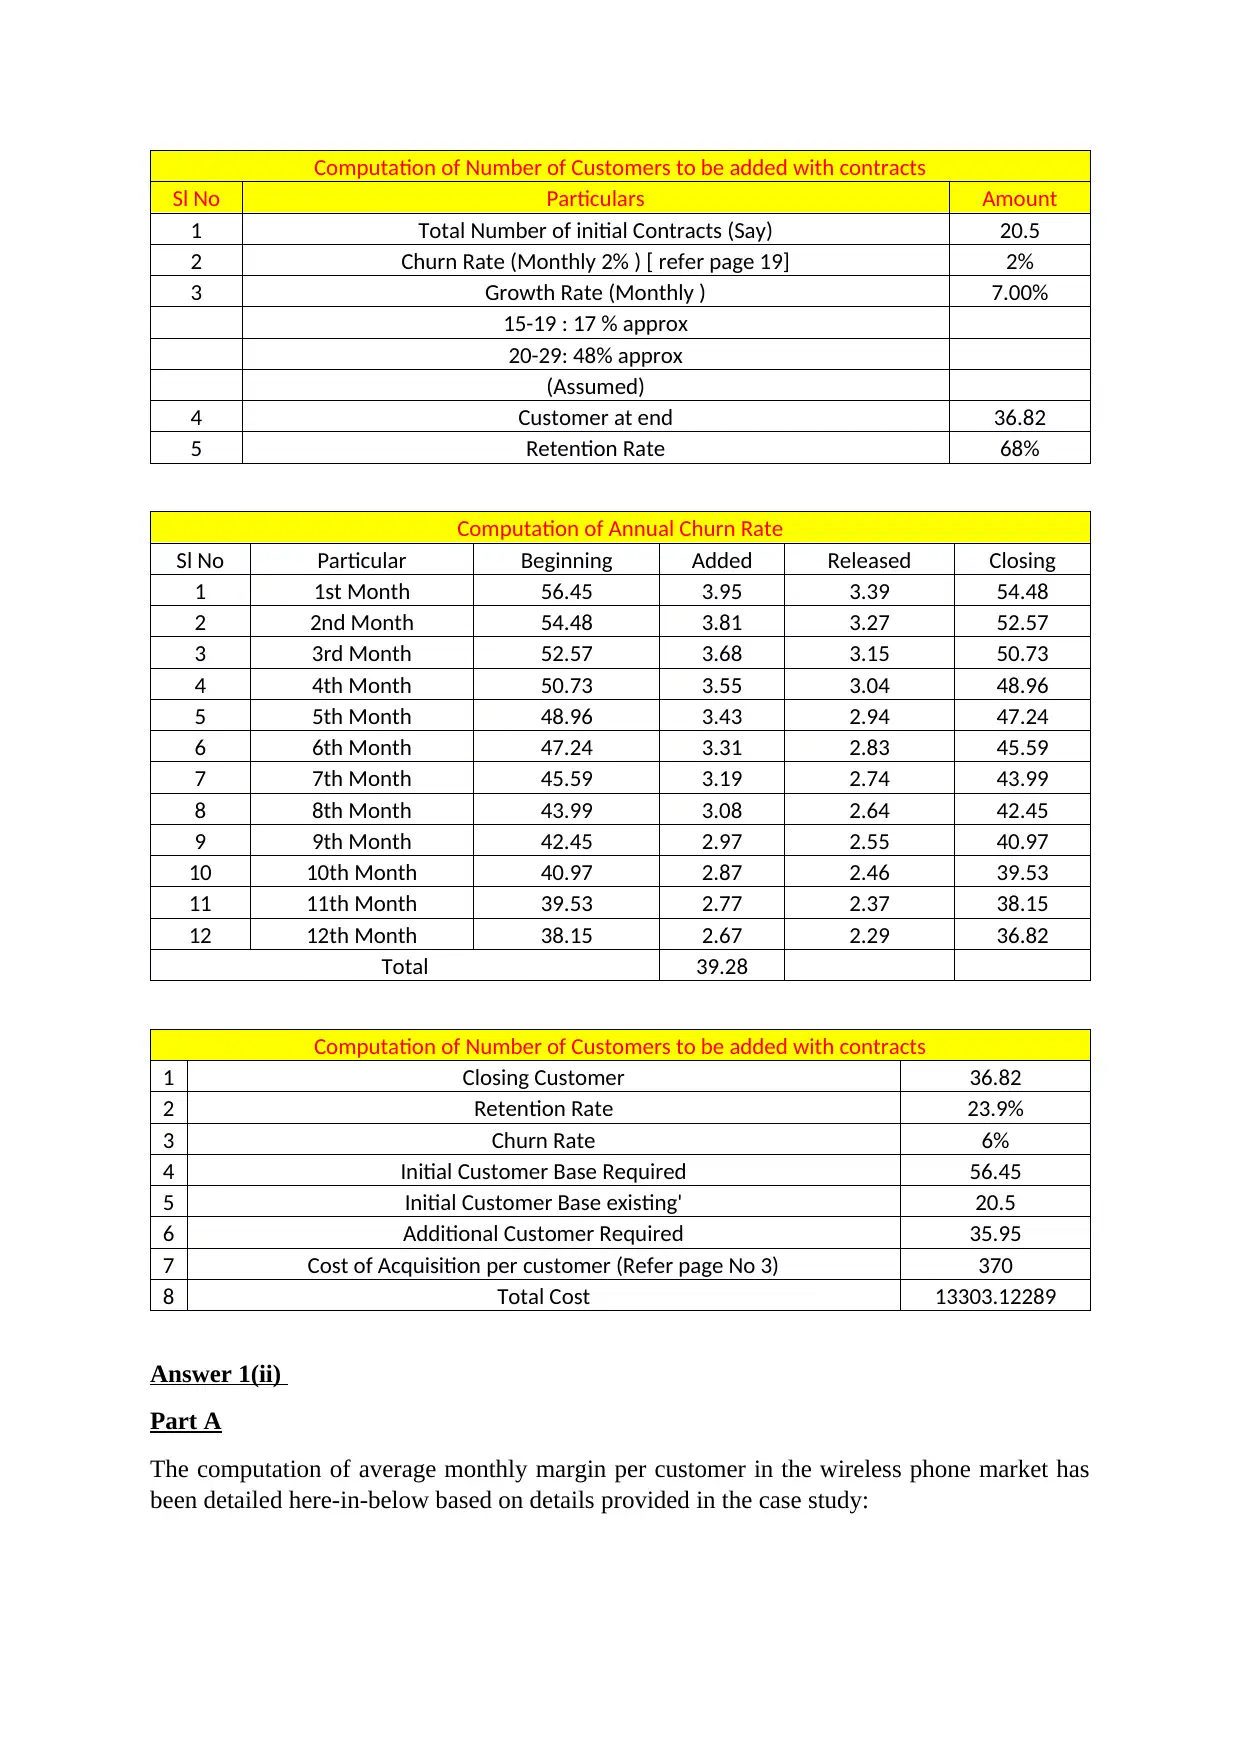
Answer 1(ii)
Part A
The computation of average monthly margin per customer in the wireless phone market has
been detailed here-in-below based on details provided in the case study:
Sl No Particulars Amount
1 Total Number of initial Contracts (Say) 20.5
2 Churn Rate (Monthly 2% ) [ refer page 19] 2%
3 Growth Rate (Monthly ) 7.00%
15-19 : 17 % approx
20-29: 48% approx
(Assumed)
4 Customer at end 36.82
5 Retention Rate 68%
Computation of Annual Churn Rate
Sl No Particular Beginning Added Released Closing
1 1st Month 56.45 3.95 3.39 54.48
2 2nd Month 54.48 3.81 3.27 52.57
3 3rd Month 52.57 3.68 3.15 50.73
4 4th Month 50.73 3.55 3.04 48.96
5 5th Month 48.96 3.43 2.94 47.24
6 6th Month 47.24 3.31 2.83 45.59
7 7th Month 45.59 3.19 2.74 43.99
8 8th Month 43.99 3.08 2.64 42.45
9 9th Month 42.45 2.97 2.55 40.97
10 10th Month 40.97 2.87 2.46 39.53
11 11th Month 39.53 2.77 2.37 38.15
12 12th Month 38.15 2.67 2.29 36.82
Total 39.28
Computation of Number of Customers to be added with contracts
1 Closing Customer 36.82
2 Retention Rate 23.9%
3 Churn Rate 6%
4 Initial Customer Base Required 56.45
5 Initial Customer Base existing' 20.5
6 Additional Customer Required 35.95
7 Cost of Acquisition per customer (Refer page No 3) 370
8 Total Cost 13303.12289
Answer 1(ii)
Part A
The computation of average monthly margin per customer in the wireless phone market has
been detailed here-in-below based on details provided in the case study:
Paraphrase This Document
Need a fresh take? Get an instant paraphrase of this document with our AI Paraphraser
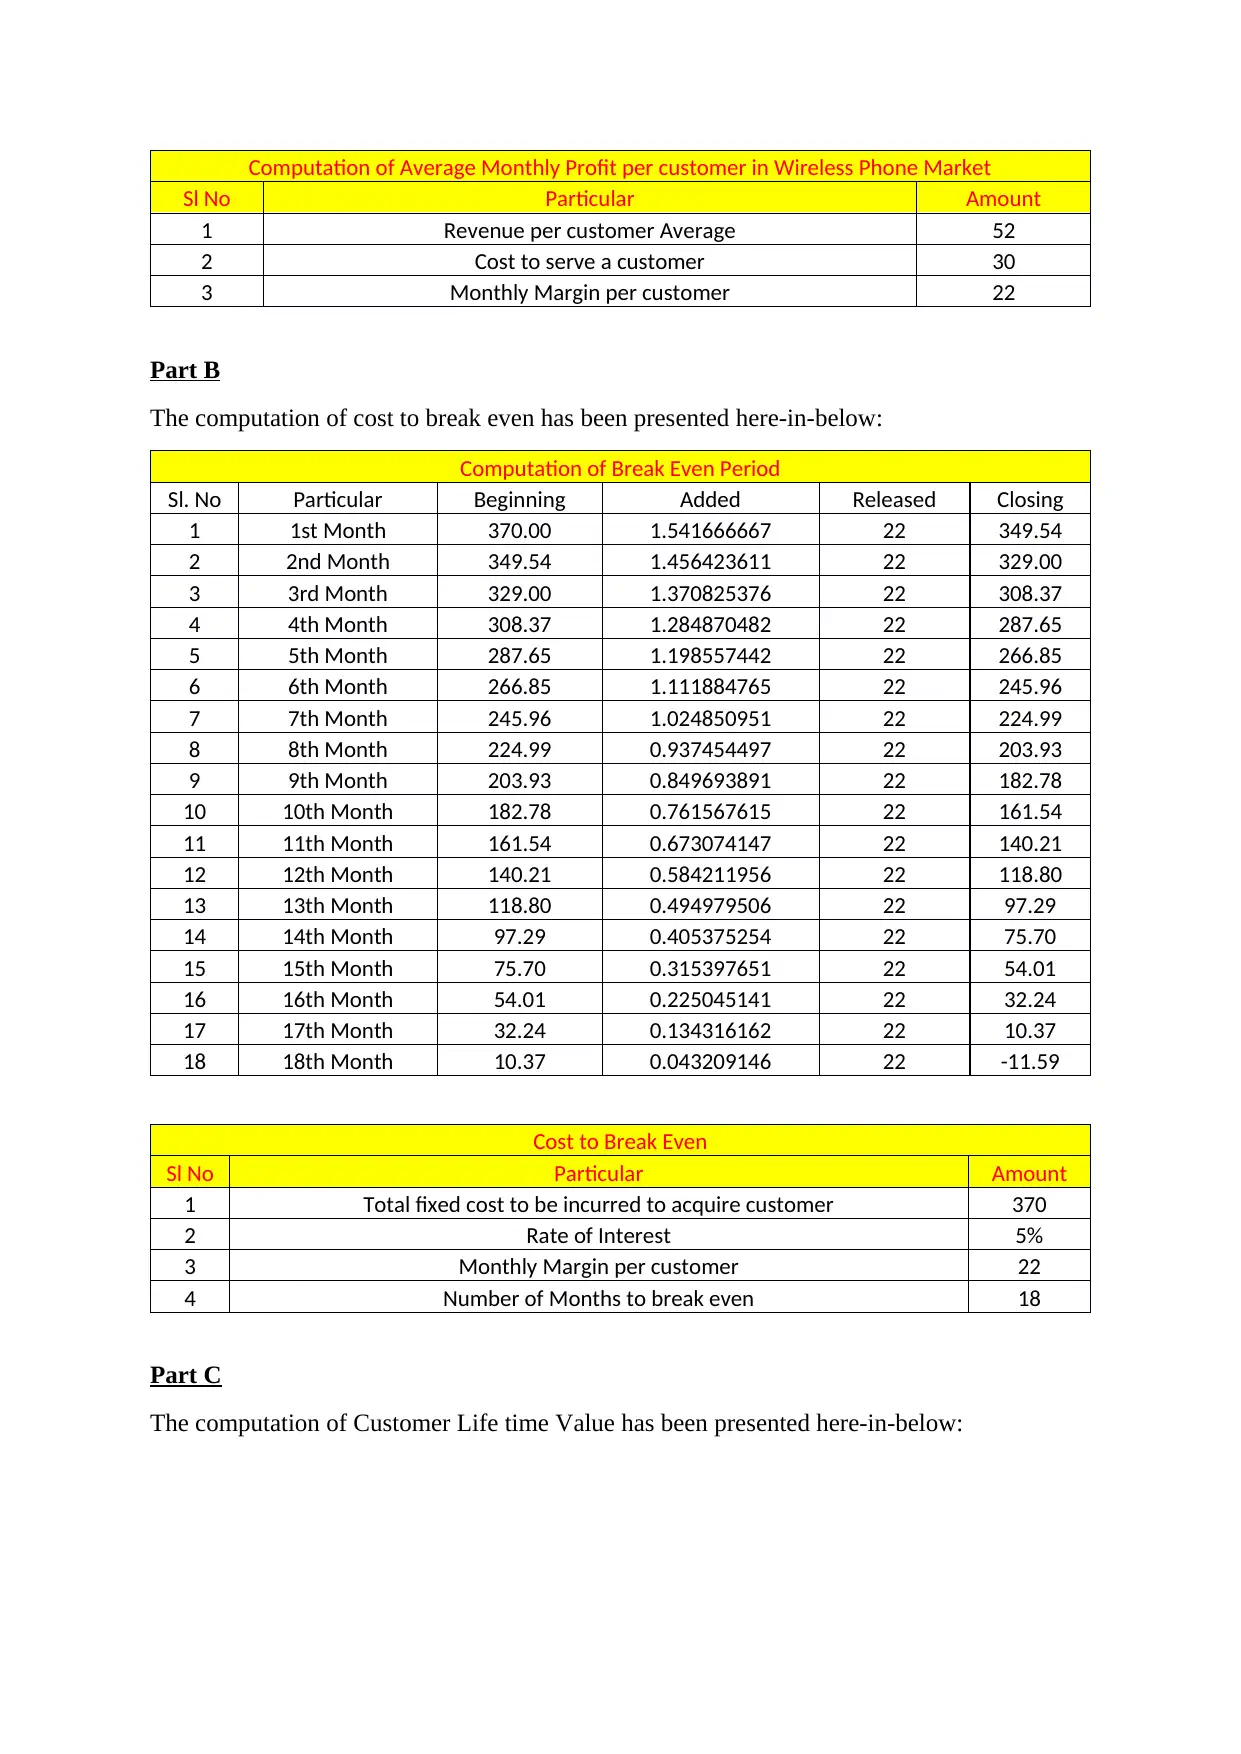
Computation of Average Monthly Profit per customer in Wireless Phone Market
Sl No Particular Amount
1 Revenue per customer Average 52
2 Cost to serve a customer 30
3 Monthly Margin per customer 22
Part B
The computation of cost to break even has been presented here-in-below:
Computation of Break Even Period
Sl. No Particular Beginning Added Released Closing
1 1st Month 370.00 1.541666667 22 349.54
2 2nd Month 349.54 1.456423611 22 329.00
3 3rd Month 329.00 1.370825376 22 308.37
4 4th Month 308.37 1.284870482 22 287.65
5 5th Month 287.65 1.198557442 22 266.85
6 6th Month 266.85 1.111884765 22 245.96
7 7th Month 245.96 1.024850951 22 224.99
8 8th Month 224.99 0.937454497 22 203.93
9 9th Month 203.93 0.849693891 22 182.78
10 10th Month 182.78 0.761567615 22 161.54
11 11th Month 161.54 0.673074147 22 140.21
12 12th Month 140.21 0.584211956 22 118.80
13 13th Month 118.80 0.494979506 22 97.29
14 14th Month 97.29 0.405375254 22 75.70
15 15th Month 75.70 0.315397651 22 54.01
16 16th Month 54.01 0.225045141 22 32.24
17 17th Month 32.24 0.134316162 22 10.37
18 18th Month 10.37 0.043209146 22 -11.59
Cost to Break Even
Sl No Particular Amount
1 Total fixed cost to be incurred to acquire customer 370
2 Rate of Interest 5%
3 Monthly Margin per customer 22
4 Number of Months to break even 18
Part C
The computation of Customer Life time Value has been presented here-in-below:
Sl No Particular Amount
1 Revenue per customer Average 52
2 Cost to serve a customer 30
3 Monthly Margin per customer 22
Part B
The computation of cost to break even has been presented here-in-below:
Computation of Break Even Period
Sl. No Particular Beginning Added Released Closing
1 1st Month 370.00 1.541666667 22 349.54
2 2nd Month 349.54 1.456423611 22 329.00
3 3rd Month 329.00 1.370825376 22 308.37
4 4th Month 308.37 1.284870482 22 287.65
5 5th Month 287.65 1.198557442 22 266.85
6 6th Month 266.85 1.111884765 22 245.96
7 7th Month 245.96 1.024850951 22 224.99
8 8th Month 224.99 0.937454497 22 203.93
9 9th Month 203.93 0.849693891 22 182.78
10 10th Month 182.78 0.761567615 22 161.54
11 11th Month 161.54 0.673074147 22 140.21
12 12th Month 140.21 0.584211956 22 118.80
13 13th Month 118.80 0.494979506 22 97.29
14 14th Month 97.29 0.405375254 22 75.70
15 15th Month 75.70 0.315397651 22 54.01
16 16th Month 54.01 0.225045141 22 32.24
17 17th Month 32.24 0.134316162 22 10.37
18 18th Month 10.37 0.043209146 22 -11.59
Cost to Break Even
Sl No Particular Amount
1 Total fixed cost to be incurred to acquire customer 370
2 Rate of Interest 5%
3 Monthly Margin per customer 22
4 Number of Months to break even 18
Part C
The computation of Customer Life time Value has been presented here-in-below:
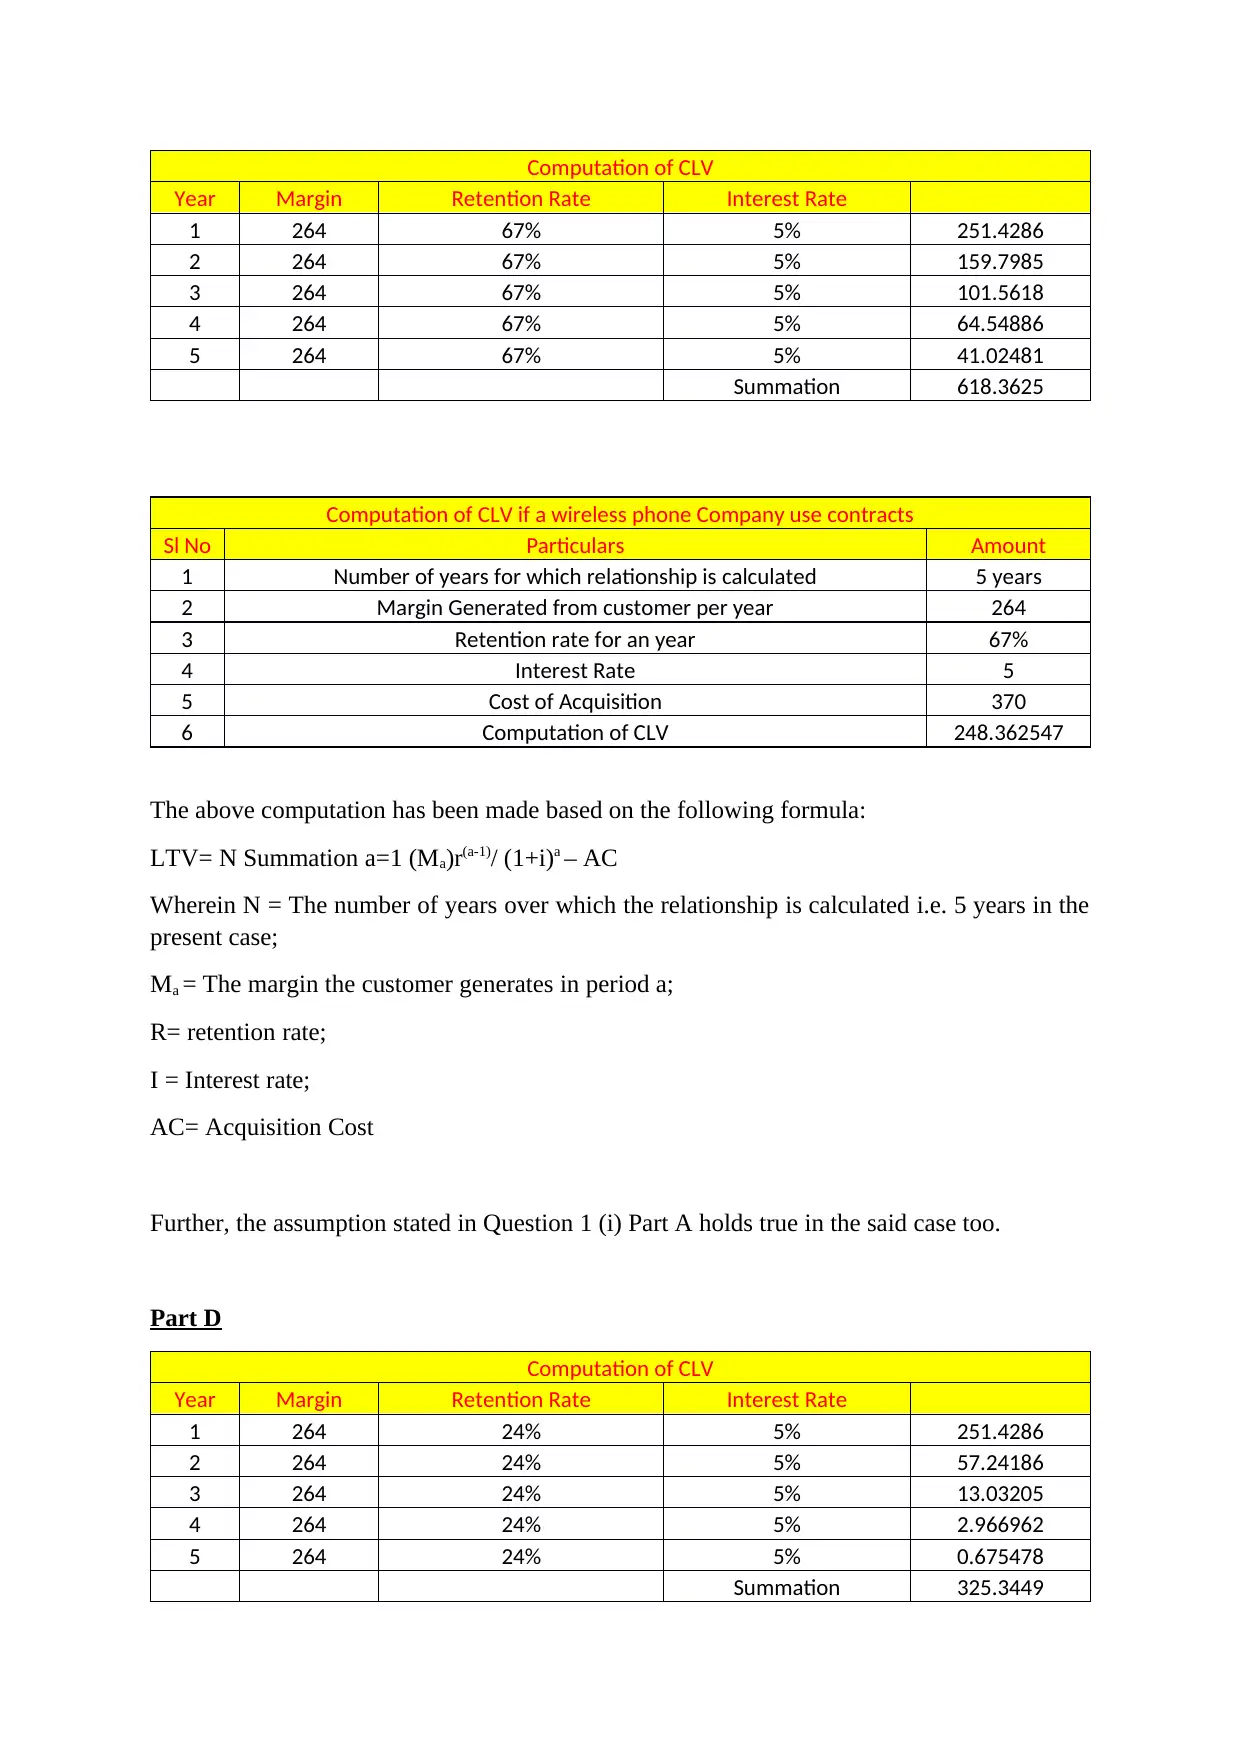
Computation of CLV
Year Margin Retention Rate Interest Rate
1 264 67% 5% 251.4286
2 264 67% 5% 159.7985
3 264 67% 5% 101.5618
4 264 67% 5% 64.54886
5 264 67% 5% 41.02481
Summation 618.3625
Computation of CLV if a wireless phone Company use contracts
Sl No Particulars Amount
1 Number of years for which relationship is calculated 5 years
2 Margin Generated from customer per year 264
3 Retention rate for an year 67%
4 Interest Rate 5
5 Cost of Acquisition 370
6 Computation of CLV 248.362547
The above computation has been made based on the following formula:
LTV= N Summation a=1 (Ma)r(a-1)/ (1+i)a – AC
Wherein N = The number of years over which the relationship is calculated i.e. 5 years in the
present case;
Ma = The margin the customer generates in period a;
R= retention rate;
I = Interest rate;
AC= Acquisition Cost
Further, the assumption stated in Question 1 (i) Part A holds true in the said case too.
Part D
Computation of CLV
Year Margin Retention Rate Interest Rate
1 264 24% 5% 251.4286
2 264 24% 5% 57.24186
3 264 24% 5% 13.03205
4 264 24% 5% 2.966962
5 264 24% 5% 0.675478
Summation 325.3449
Year Margin Retention Rate Interest Rate
1 264 67% 5% 251.4286
2 264 67% 5% 159.7985
3 264 67% 5% 101.5618
4 264 67% 5% 64.54886
5 264 67% 5% 41.02481
Summation 618.3625
Computation of CLV if a wireless phone Company use contracts
Sl No Particulars Amount
1 Number of years for which relationship is calculated 5 years
2 Margin Generated from customer per year 264
3 Retention rate for an year 67%
4 Interest Rate 5
5 Cost of Acquisition 370
6 Computation of CLV 248.362547
The above computation has been made based on the following formula:
LTV= N Summation a=1 (Ma)r(a-1)/ (1+i)a – AC
Wherein N = The number of years over which the relationship is calculated i.e. 5 years in the
present case;
Ma = The margin the customer generates in period a;
R= retention rate;
I = Interest rate;
AC= Acquisition Cost
Further, the assumption stated in Question 1 (i) Part A holds true in the said case too.
Part D
Computation of CLV
Year Margin Retention Rate Interest Rate
1 264 24% 5% 251.4286
2 264 24% 5% 57.24186
3 264 24% 5% 13.03205
4 264 24% 5% 2.966962
5 264 24% 5% 0.675478
Summation 325.3449
⊘ This is a preview!⊘
Do you want full access?
Subscribe today to unlock all pages.
Trusted by 1+ million students worldwide
Computation of CLV if a wireless phone Company does not use contracts
Sl No Particulars Amount
1 Number of years for which relationship is calculated 5 years
2 Margin Generated from customer per year 264
3 Retention rate for an year 24%
4 Interest Rate 5
5 Cost of Acquisition 370
6 Computation of CLV -44.65507328
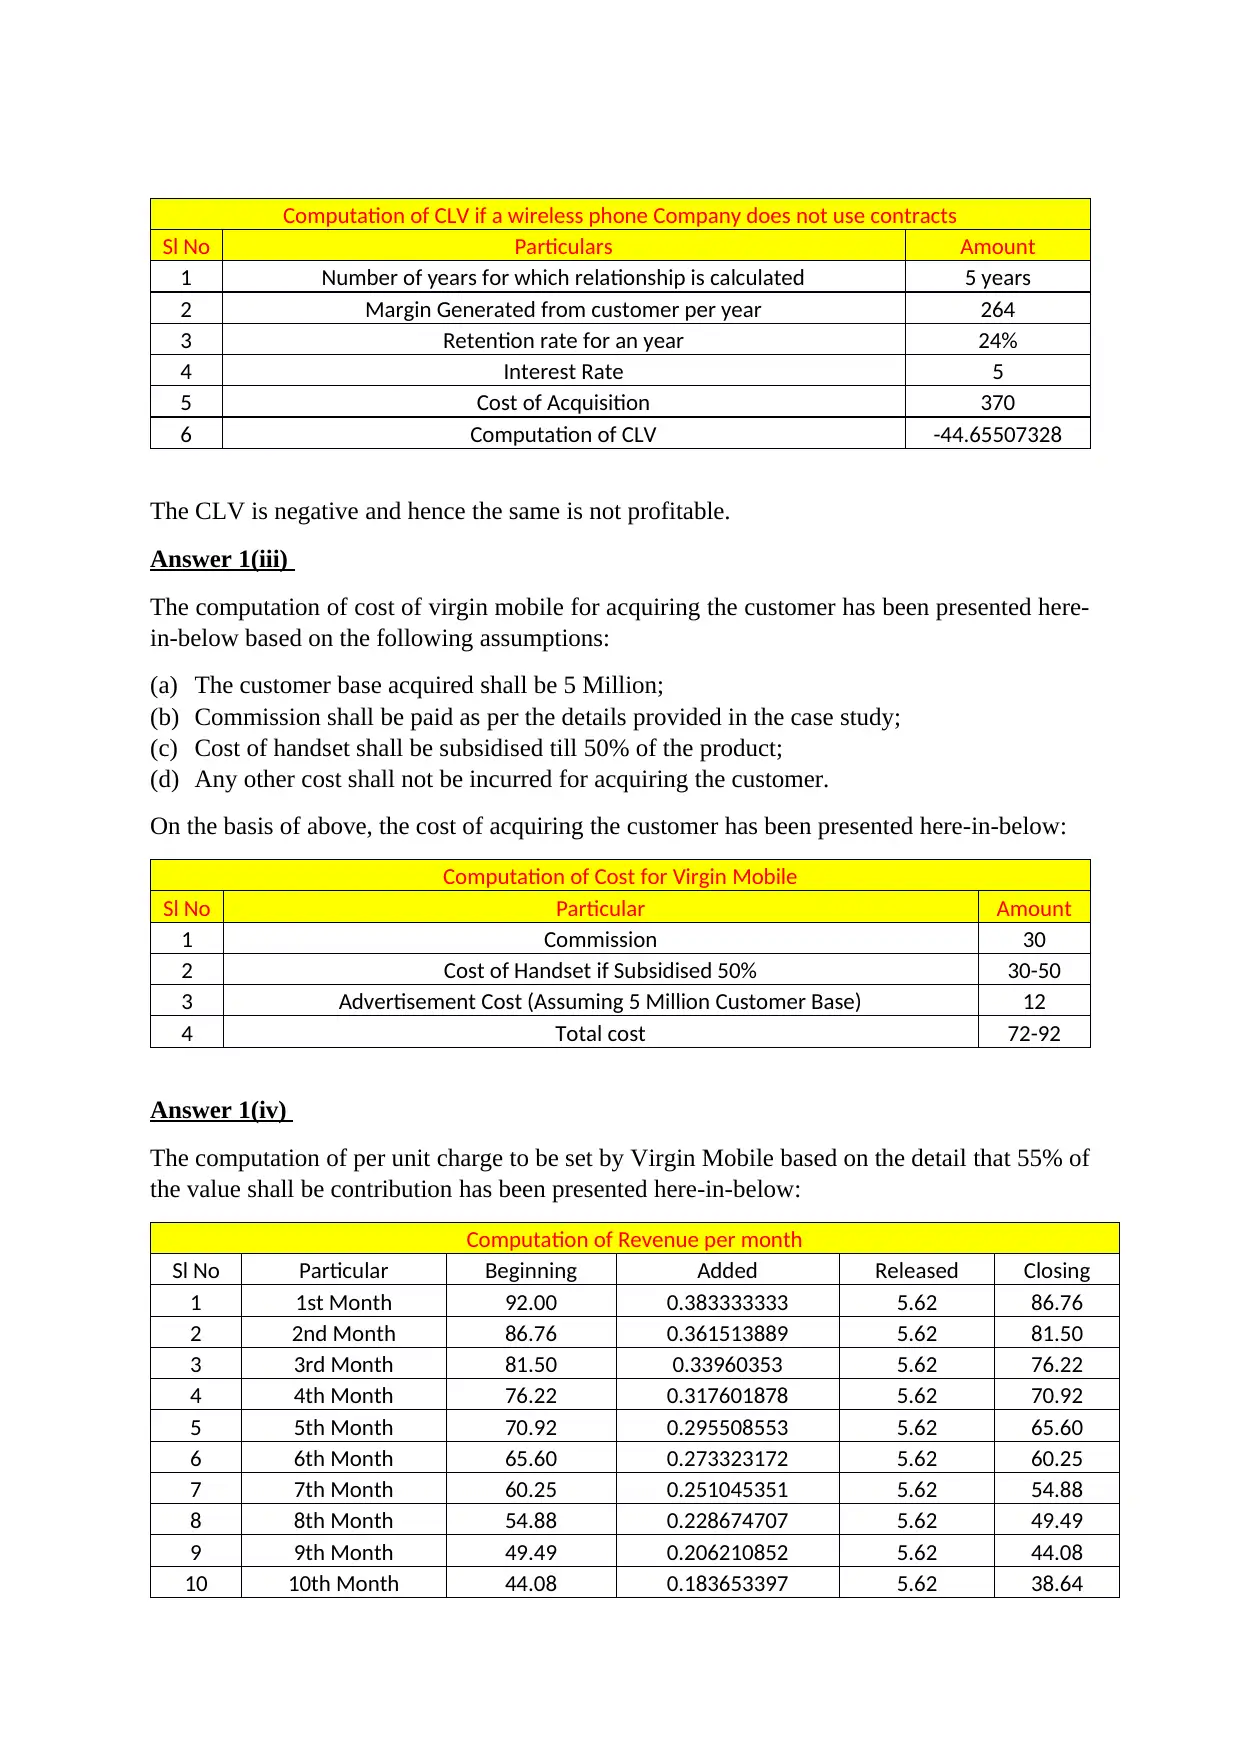
The CLV is negative and hence the same is not profitable.
Answer 1(iii)
The computation of cost of virgin mobile for acquiring the customer has been presented here-
in-below based on the following assumptions:
(a) The customer base acquired shall be 5 Million;
(b) Commission shall be paid as per the details provided in the case study;
(c) Cost of handset shall be subsidised till 50% of the product;
(d) Any other cost shall not be incurred for acquiring the customer.
On the basis of above, the cost of acquiring the customer has been presented here-in-below:
Computation of Cost for Virgin Mobile
Sl No Particular Amount
1 Commission 30
2 Cost of Handset if Subsidised 50% 30-50
3 Advertisement Cost (Assuming 5 Million Customer Base) 12
4 Total cost 72-92
Answer 1(iv)
The computation of per unit charge to be set by Virgin Mobile based on the detail that 55% of
the value shall be contribution has been presented here-in-below:
Computation of Revenue per month
Sl No Particular Beginning Added Released Closing
1 1st Month 92.00 0.383333333 5.62 86.76
2 2nd Month 86.76 0.361513889 5.62 81.50
3 3rd Month 81.50 0.33960353 5.62 76.22
4 4th Month 76.22 0.317601878 5.62 70.92
5 5th Month 70.92 0.295508553 5.62 65.60
6 6th Month 65.60 0.273323172 5.62 60.25
7 7th Month 60.25 0.251045351 5.62 54.88
8 8th Month 54.88 0.228674707 5.62 49.49
9 9th Month 49.49 0.206210852 5.62 44.08
10 10th Month 44.08 0.183653397 5.62 38.64
Sl No Particulars Amount
1 Number of years for which relationship is calculated 5 years
2 Margin Generated from customer per year 264
3 Retention rate for an year 24%
4 Interest Rate 5
5 Cost of Acquisition 370
6 Computation of CLV -44.65507328
The CLV is negative and hence the same is not profitable.
Answer 1(iii)
The computation of cost of virgin mobile for acquiring the customer has been presented here-
in-below based on the following assumptions:
(a) The customer base acquired shall be 5 Million;
(b) Commission shall be paid as per the details provided in the case study;
(c) Cost of handset shall be subsidised till 50% of the product;
(d) Any other cost shall not be incurred for acquiring the customer.
On the basis of above, the cost of acquiring the customer has been presented here-in-below:
Computation of Cost for Virgin Mobile
Sl No Particular Amount
1 Commission 30
2 Cost of Handset if Subsidised 50% 30-50
3 Advertisement Cost (Assuming 5 Million Customer Base) 12
4 Total cost 72-92
Answer 1(iv)
The computation of per unit charge to be set by Virgin Mobile based on the detail that 55% of
the value shall be contribution has been presented here-in-below:
Computation of Revenue per month
Sl No Particular Beginning Added Released Closing
1 1st Month 92.00 0.383333333 5.62 86.76
2 2nd Month 86.76 0.361513889 5.62 81.50
3 3rd Month 81.50 0.33960353 5.62 76.22
4 4th Month 76.22 0.317601878 5.62 70.92
5 5th Month 70.92 0.295508553 5.62 65.60
6 6th Month 65.60 0.273323172 5.62 60.25
7 7th Month 60.25 0.251045351 5.62 54.88
8 8th Month 54.88 0.228674707 5.62 49.49
9 9th Month 49.49 0.206210852 5.62 44.08
10 10th Month 44.08 0.183653397 5.62 38.64
Paraphrase This Document
Need a fresh take? Get an instant paraphrase of this document with our AI Paraphraser
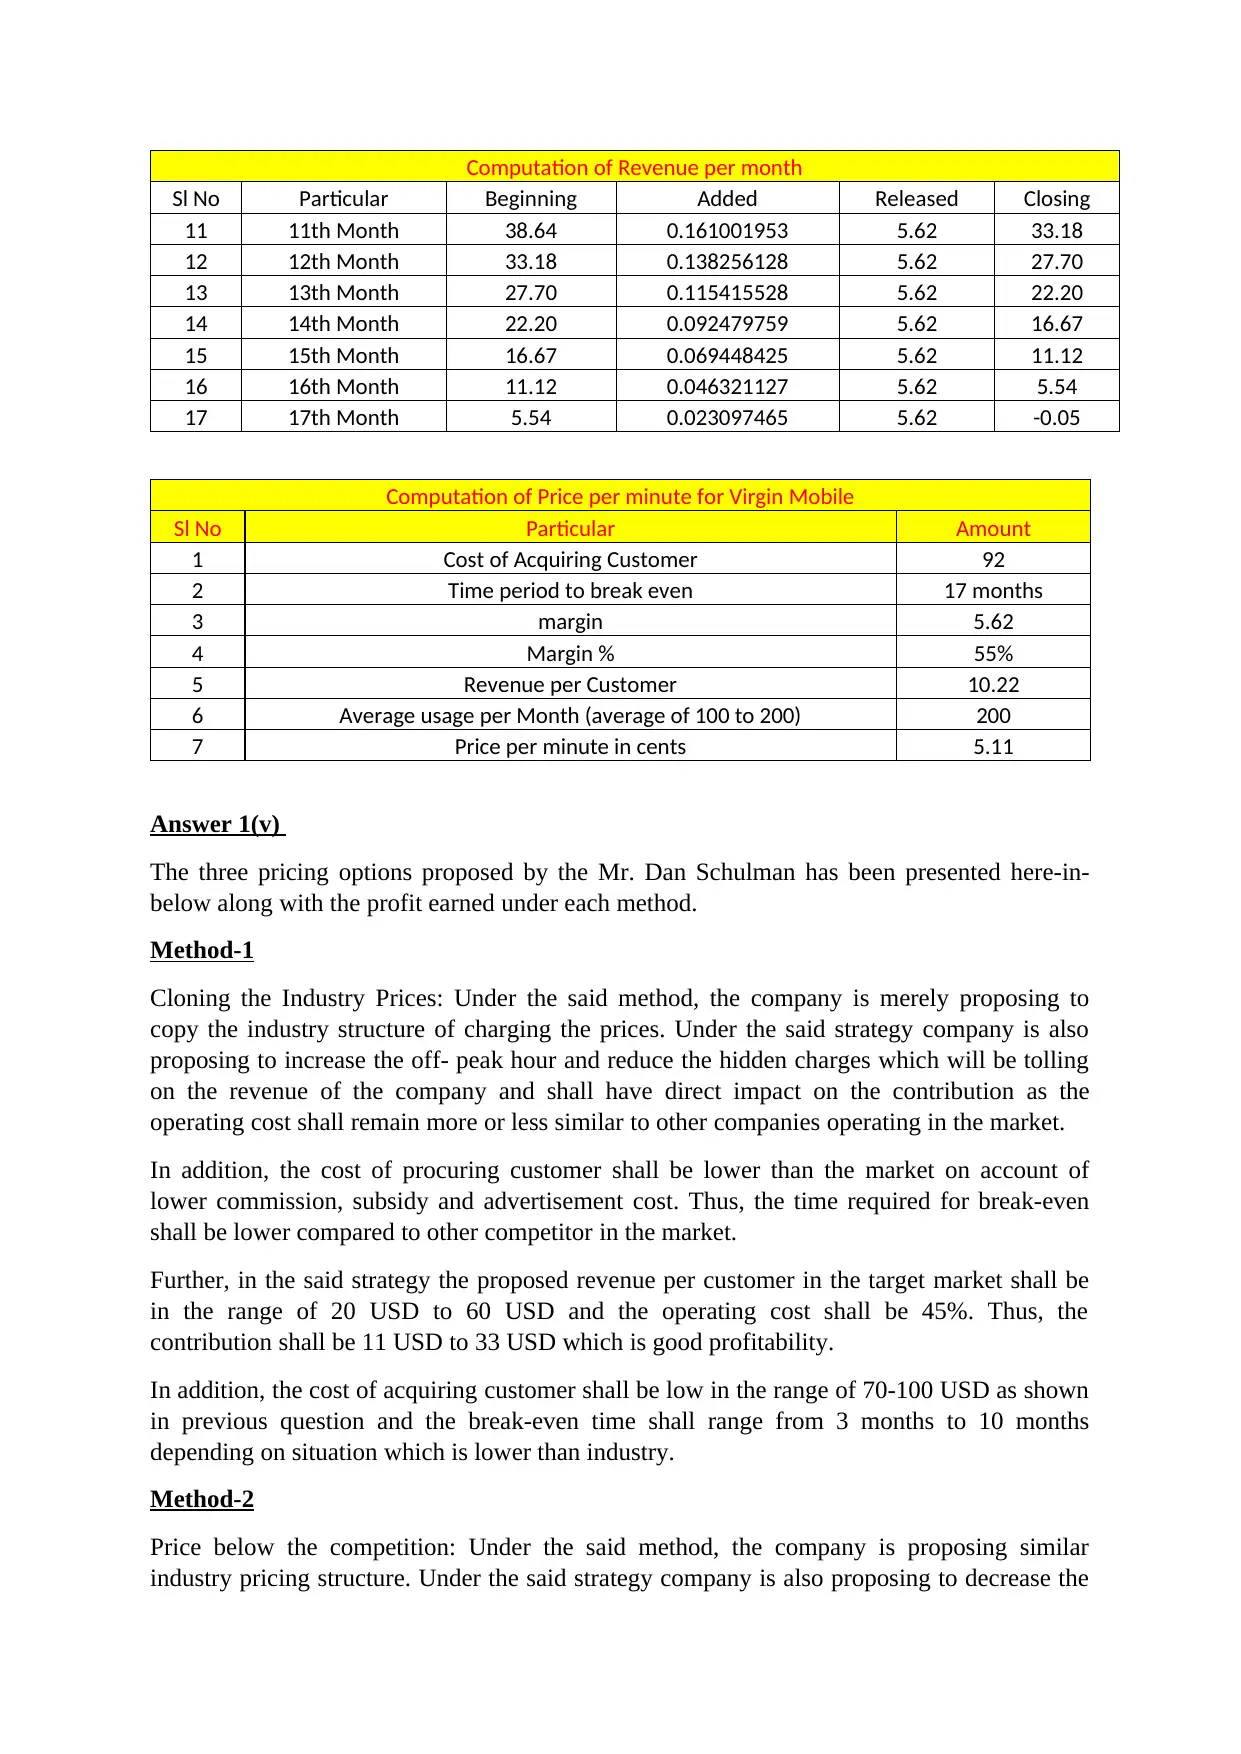
Computation of Revenue per month
Sl No Particular Beginning Added Released Closing
11 11th Month 38.64 0.161001953 5.62 33.18
12 12th Month 33.18 0.138256128 5.62 27.70
13 13th Month 27.70 0.115415528 5.62 22.20
14 14th Month 22.20 0.092479759 5.62 16.67
15 15th Month 16.67 0.069448425 5.62 11.12
16 16th Month 11.12 0.046321127 5.62 5.54
17 17th Month 5.54 0.023097465 5.62 -0.05
Computation of Price per minute for Virgin Mobile
Sl No Particular Amount
1 Cost of Acquiring Customer 92
2 Time period to break even 17 months
3 margin 5.62
4 Margin % 55%
5 Revenue per Customer 10.22
6 Average usage per Month (average of 100 to 200) 200
7 Price per minute in cents 5.11
Answer 1(v)
The three pricing options proposed by the Mr. Dan Schulman has been presented here-in-
below along with the profit earned under each method.
Method-1
Cloning the Industry Prices: Under the said method, the company is merely proposing to
copy the industry structure of charging the prices. Under the said strategy company is also
proposing to increase the off- peak hour and reduce the hidden charges which will be tolling
on the revenue of the company and shall have direct impact on the contribution as the
operating cost shall remain more or less similar to other companies operating in the market.
In addition, the cost of procuring customer shall be lower than the market on account of
lower commission, subsidy and advertisement cost. Thus, the time required for break-even
shall be lower compared to other competitor in the market.
Further, in the said strategy the proposed revenue per customer in the target market shall be
in the range of 20 USD to 60 USD and the operating cost shall be 45%. Thus, the
contribution shall be 11 USD to 33 USD which is good profitability.
In addition, the cost of acquiring customer shall be low in the range of 70-100 USD as shown
in previous question and the break-even time shall range from 3 months to 10 months
depending on situation which is lower than industry.
Method-2
Price below the competition: Under the said method, the company is proposing similar
industry pricing structure. Under the said strategy company is also proposing to decrease the
price charged from customer under key buckets which will be tolling on the revenue of the
company and shall have direct impact on the contribution as the operating cost shall remain
more or less similar to other companies operating in the market. Further, the company is also
proposing to increase the off- peak hour and reduce the hidden charges
In addition, the cost of procuring customer shall be lower than the market on account of
lower commission, subsidy and advertisement cost. Thus, the time required for break-even
shall be lower compared to other competitor in the market.
Further, in the said strategy the proposed revenue per customer in the target market shall be
in the range of 12.5 USD to 37.5 USD and the operating cost shall be 45%. Thus, the
contribution shall be 6.9 USD to 20.63 USD which is good profitability.
In addition, the cost of acquiring customer shall be low in the range of 70-100 USD as shown
in previous question and the break-even time shall range from 5 months to 16 months
depending on situation which is lower than industry.
However, the said strategy may provide the company with an increased customer base and
shall increase the overall profitability of the company. Further, in a competitive market
reduced prices and incentives shall entice the customer and attract it. Thus, this strategy is
ideal and shall be used by the company.
Method-3
A whole new Plan: This is an out of box idea and involves shortening of contract period or
even eliminating it together. The said strategy reduces customer loyalty to the company
which may lead to huge churn rate and can impact the profitability of the company and shall
increase the break-even period of the company. Further, the company is also proposing to
enter in a wide scale in the prepaid segment since customer below 18 years of age cannot
obtain the connection without their parent consent, however, the LTV of this strategy is
negative as depicted in solutions above. Hence, the ideal strategy for beginning and entering
the market shall be proposal -2.
Answer 2
Durable Good Pricing
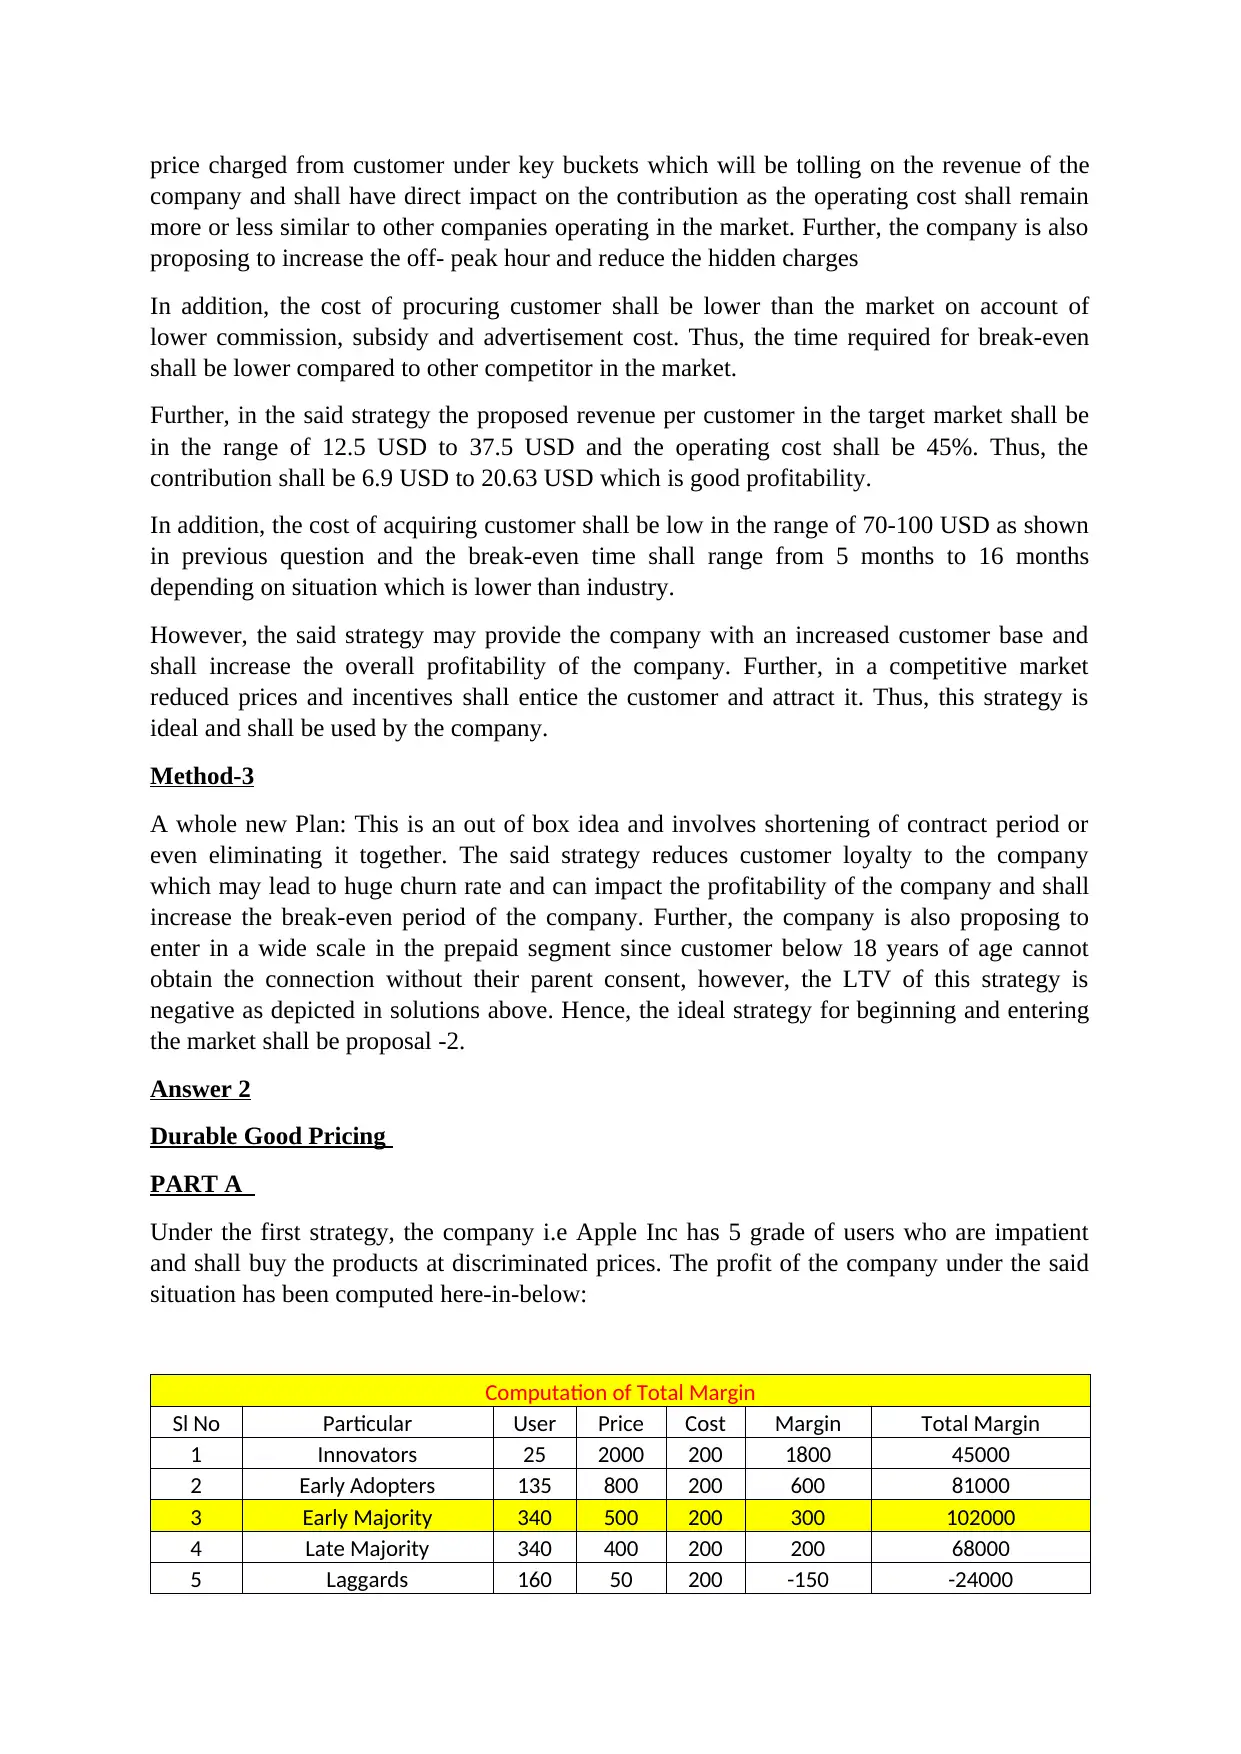
PART A
Under the first strategy, the company i.e Apple Inc has 5 grade of users who are impatient
and shall buy the products at discriminated prices. The profit of the company under the said
situation has been computed here-in-below:
Computation of Total Margin
Sl No Particular User Price Cost Margin Total Margin
1 Innovators 25 2000 200 1800 45000
2 Early Adopters 135 800 200 600 81000
3 Early Majority 340 500 200 300 102000
4 Late Majority 340 400 200 200 68000
5 Laggards 160 50 200 -150 -24000
company and shall have direct impact on the contribution as the operating cost shall remain
more or less similar to other companies operating in the market. Further, the company is also
proposing to increase the off- peak hour and reduce the hidden charges
In addition, the cost of procuring customer shall be lower than the market on account of
lower commission, subsidy and advertisement cost. Thus, the time required for break-even
shall be lower compared to other competitor in the market.
Further, in the said strategy the proposed revenue per customer in the target market shall be
in the range of 12.5 USD to 37.5 USD and the operating cost shall be 45%. Thus, the
contribution shall be 6.9 USD to 20.63 USD which is good profitability.
In addition, the cost of acquiring customer shall be low in the range of 70-100 USD as shown
in previous question and the break-even time shall range from 5 months to 16 months
depending on situation which is lower than industry.
However, the said strategy may provide the company with an increased customer base and
shall increase the overall profitability of the company. Further, in a competitive market
reduced prices and incentives shall entice the customer and attract it. Thus, this strategy is
ideal and shall be used by the company.
Method-3
A whole new Plan: This is an out of box idea and involves shortening of contract period or
even eliminating it together. The said strategy reduces customer loyalty to the company
which may lead to huge churn rate and can impact the profitability of the company and shall
increase the break-even period of the company. Further, the company is also proposing to
enter in a wide scale in the prepaid segment since customer below 18 years of age cannot
obtain the connection without their parent consent, however, the LTV of this strategy is
negative as depicted in solutions above. Hence, the ideal strategy for beginning and entering
the market shall be proposal -2.
Answer 2
Durable Good Pricing
PART A
Under the first strategy, the company i.e Apple Inc has 5 grade of users who are impatient
and shall buy the products at discriminated prices. The profit of the company under the said
situation has been computed here-in-below:
Computation of Total Margin
Sl No Particular User Price Cost Margin Total Margin
1 Innovators 25 2000 200 1800 45000
2 Early Adopters 135 800 200 600 81000
3 Early Majority 340 500 200 300 102000
4 Late Majority 340 400 200 200 68000
5 Laggards 160 50 200 -150 -24000
⊘ This is a preview!⊘
Do you want full access?
Subscribe today to unlock all pages.
Trusted by 1+ million students worldwide
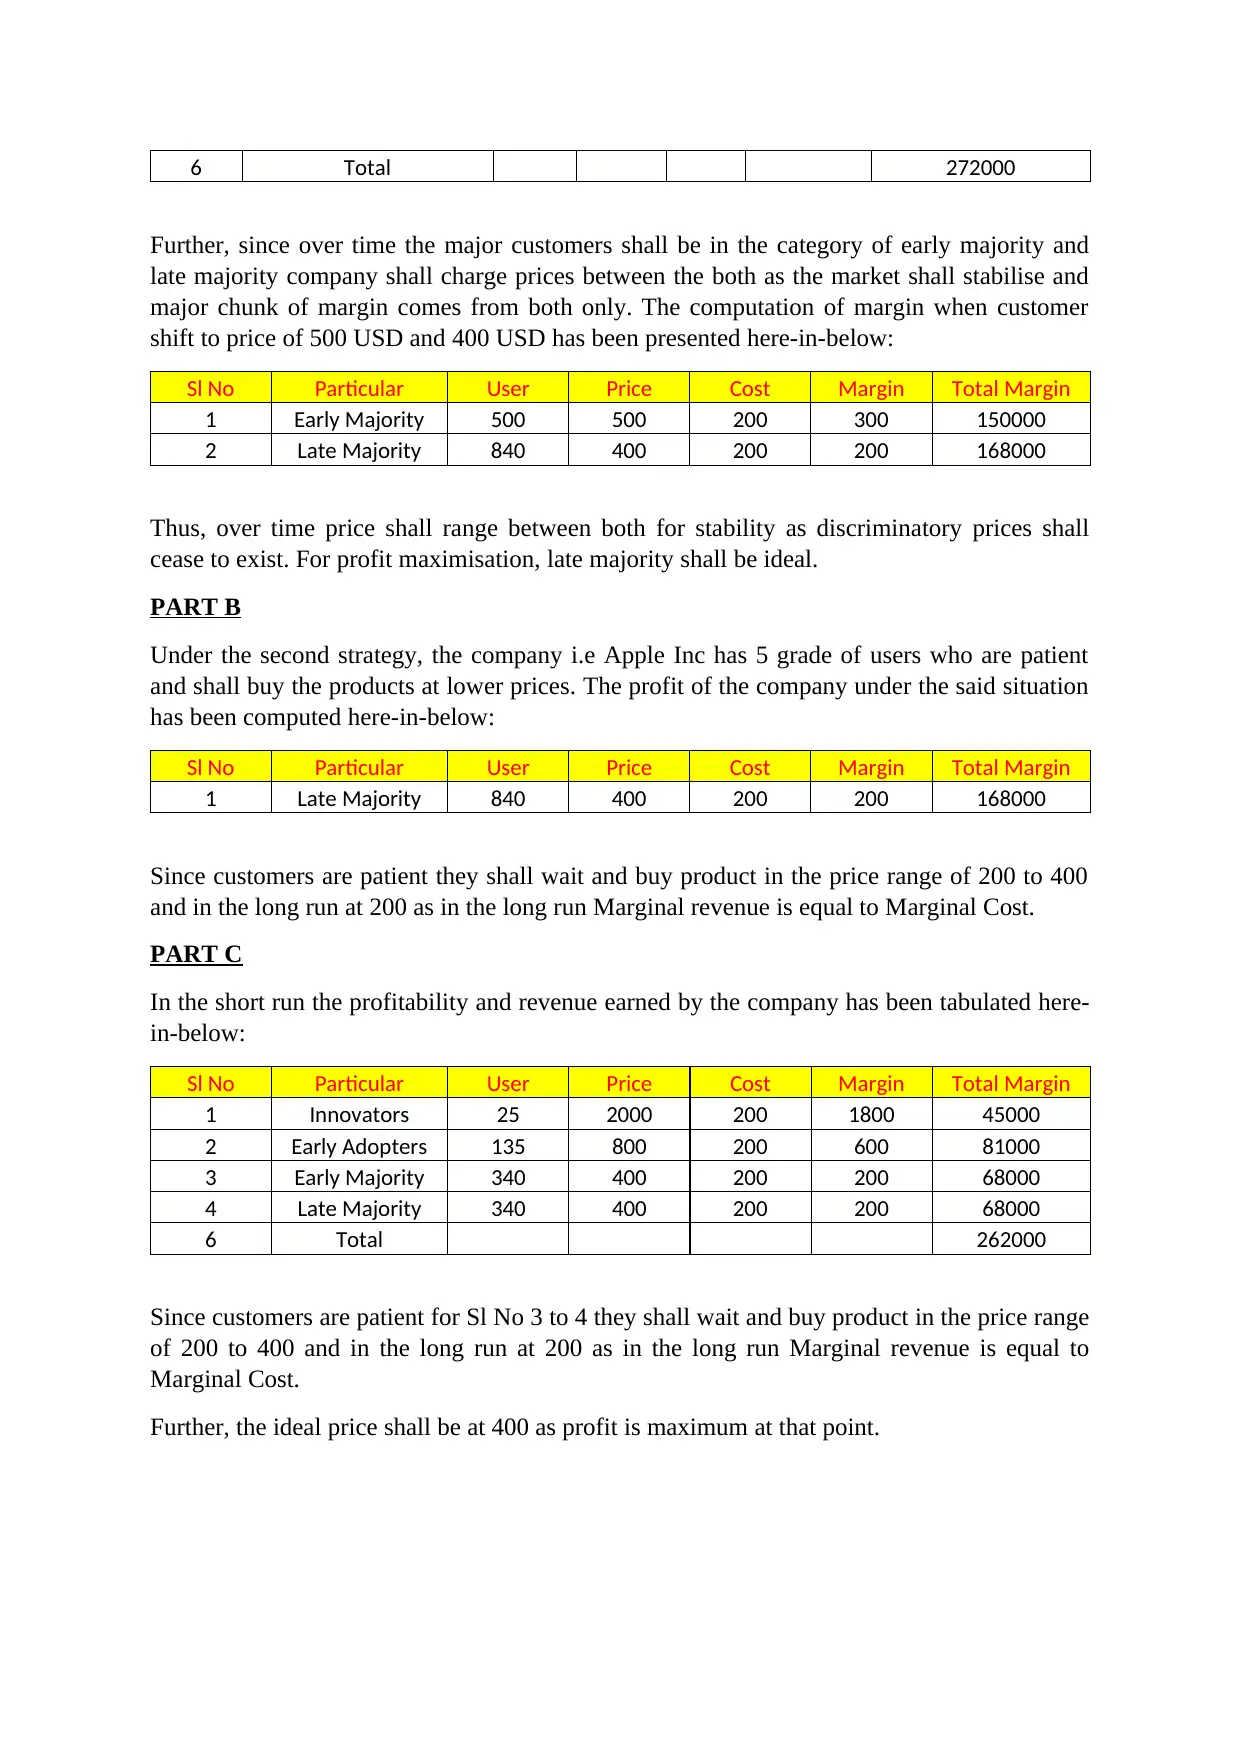
6 Total 272000
Further, since over time the major customers shall be in the category of early majority and
late majority company shall charge prices between the both as the market shall stabilise and
major chunk of margin comes from both only. The computation of margin when customer
shift to price of 500 USD and 400 USD has been presented here-in-below:
Sl No Particular User Price Cost Margin Total Margin
1 Early Majority 500 500 200 300 150000
2 Late Majority 840 400 200 200 168000
Thus, over time price shall range between both for stability as discriminatory prices shall
cease to exist. For profit maximisation, late majority shall be ideal.
PART B
Under the second strategy, the company i.e Apple Inc has 5 grade of users who are patient
and shall buy the products at lower prices. The profit of the company under the said situation
has been computed here-in-below:
Sl No Particular User Price Cost Margin Total Margin
1 Late Majority 840 400 200 200 168000
Since customers are patient they shall wait and buy product in the price range of 200 to 400
and in the long run at 200 as in the long run Marginal revenue is equal to Marginal Cost.
PART C
In the short run the profitability and revenue earned by the company has been tabulated here-
in-below:
Sl No Particular User Price Cost Margin Total Margin
1 Innovators 25 2000 200 1800 45000
2 Early Adopters 135 800 200 600 81000
3 Early Majority 340 400 200 200 68000
4 Late Majority 340 400 200 200 68000
6 Total 262000
Since customers are patient for Sl No 3 to 4 they shall wait and buy product in the price range
of 200 to 400 and in the long run at 200 as in the long run Marginal revenue is equal to
Marginal Cost.
Further, the ideal price shall be at 400 as profit is maximum at that point.
1 out of 10

Your All-in-One AI-Powered Toolkit for Academic Success.
+13062052269
info@desklib.com
Available 24*7 on WhatsApp / Email
![[object Object]](/_next/static/media/star-bottom.7253800d.svg)
Unlock your academic potential
Copyright © 2020–2026 A2Z Services. All Rights Reserved. Developed and managed by ZUCOL.