Visa Inc. Credit Card Fraud: A Business Analysis Case Study
VerifiedAdded on 2020/05/04
|19
|3678
|412
Case Study
AI Summary
This case study examines credit card fraud at Visa Inc., a global financial services firm. The study investigates the occurrence of fraud across genders and age groups, differentiating between online and offline fraud. Data was collected from 420 customers using questionnaires, and ANOVA was used for hypothesis testing at a 95% significance level. Key findings reveal that fraud affects both males and females across different age groups. Customer satisfaction is influenced by the advice given by the resolution team. The study highlights the importance of educating customers on fraud prevention and the need for future research to address the methods of fraud occurrence. The analysis explores the impact of response time, communication, and advice on customer satisfaction with fraud resolution. The study concludes that while the average time taken for resolution is more than the set 12 hours, the occurrence of fraud is not limited to a specific gender or age group, emphasizing the need for comprehensive fraud prevention strategies.
FOUNDATIONS OF BUSINESS ANALYSIS
CASE STUDY – VISA INC
Course Name…………………………………………………..
School ……………………………………………………
Department…………………………………………….
Lecturer name…………………………………………………..
Task Name……………………………………………………
Date………………………………………………………………
CASE STUDY – VISA INC
Course Name…………………………………………………..
School ……………………………………………………
Department…………………………………………….
Lecturer name…………………………………………………..
Task Name……………………………………………………
Date………………………………………………………………
Paraphrase This Document
Need a fresh take? Get an instant paraphrase of this document with our AI Paraphraser
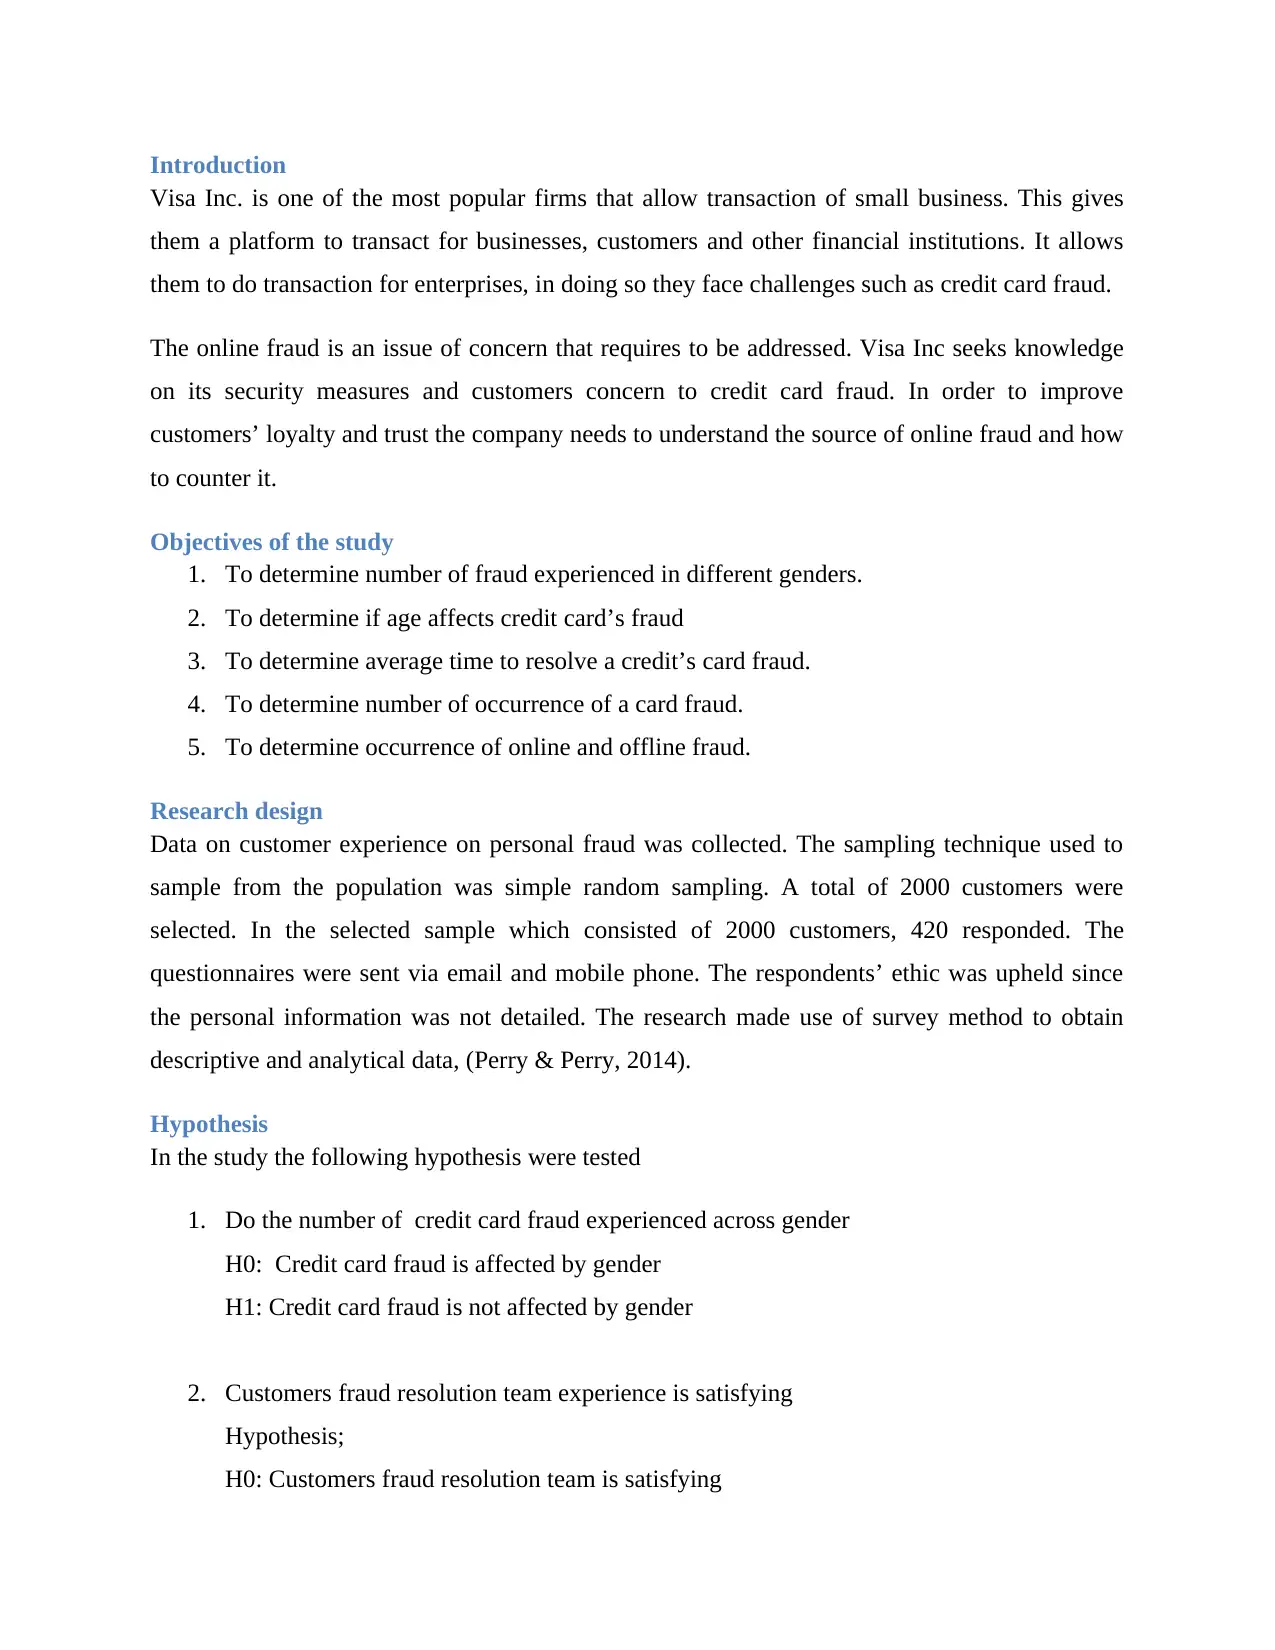
EXECUTIVE SUMMARY
Visa Inc. is one of the world’s largest retail electronic payments chains of network and it is one
of the most reputable global financial services firm. It enables world commerce via the transfer
of value and information among businesses, clients, lending institutions and government
departments.
Most of customers using the credit cards have been experiencing fraud on their cards. The called
for research on how the frauds occur? Is it online or offline? The study involved if this occurs to
both males and females? Is this credit card fraud across the age-groups? The satisfaction these
cards offer to customers and if the resolution team is effective?
The analysis of variance was used to test the hypothesis. The study was carried out at 95% level
of significance with alpha 0.05. Most of the factors being tested were important in the cub the
credit card fraud. Gender case fraud occurred in both males and females. The age-group was also
influenced across the youths to old. The customer satisfaction rating was most influenced by type
of advice given by the resolution team.
Credit card customer should be really advised on the loopholes through which the frauds occur.
Public awareness of different types of credit card frauds should be done. These will improve
them and lower their chances of being fraud.
The study didn’t address ways in which the fraud they occurred. Future studies should address
ways in which the fraud occurs if online how did they do it. Was it thus suspicious emails
addresses? Billing address or shipping address?
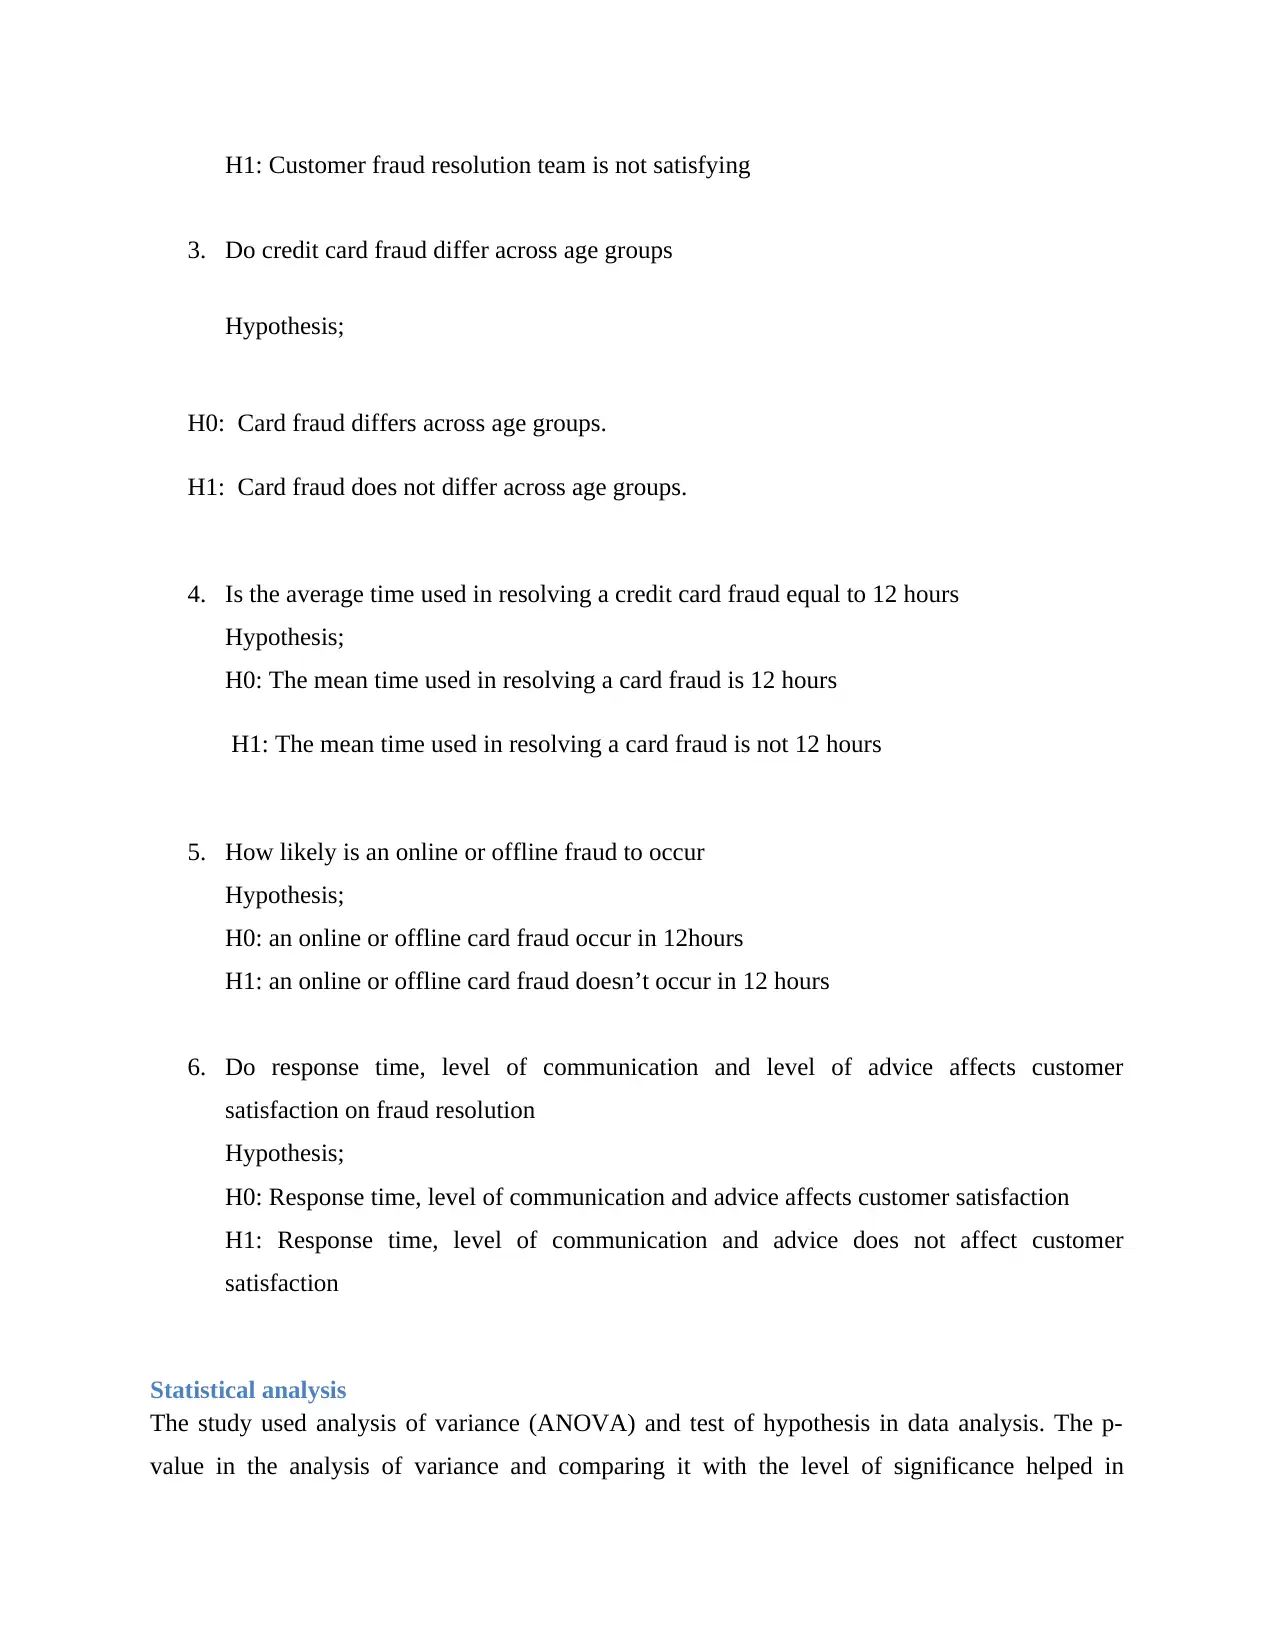
Introduction
Visa Inc. is one of the most popular firms that allow transaction of small business. This gives
them a platform to transact for businesses, customers and other financial institutions. It allows
them to do transaction for enterprises, in doing so they face challenges such as credit card fraud.
The online fraud is an issue of concern that requires to be addressed. Visa Inc seeks knowledge
on its security measures and customers concern to credit card fraud. In order to improve
customers’ loyalty and trust the company needs to understand the source of online fraud and how
to counter it.
Objectives of the study
1. To determine number of fraud experienced in different genders.
2. To determine if age affects credit card’s fraud
3. To determine average time to resolve a credit’s card fraud.
4. To determine number of occurrence of a card fraud.
5. To determine occurrence of online and offline fraud.
Research design
Data on customer experience on personal fraud was collected. The sampling technique used to
sample from the population was simple random sampling. A total of 2000 customers were
selected. In the selected sample which consisted of 2000 customers, 420 responded. The
questionnaires were sent via email and mobile phone. The respondents’ ethic was upheld since
the personal information was not detailed. The research made use of survey method to obtain
descriptive and analytical data, (Perry & Perry, 2014).
Hypothesis
In the study the following hypothesis were tested
1. Do the number of credit card fraud experienced across gender
H0: Credit card fraud is affected by gender
H1: Credit card fraud is not affected by gender
2. Customers fraud resolution team experience is satisfying
Hypothesis;
H0: Customers fraud resolution team is satisfying
⊘ This is a preview!⊘
Do you want full access?
Subscribe today to unlock all pages.
Trusted by 1+ million students worldwide
H1: Customer fraud resolution team is not satisfying
3. Do credit card fraud differ across age groups
Hypothesis;
H0: Card fraud differs across age groups.
H1: Card fraud does not differ across age groups.
4. Is the average time used in resolving a credit card fraud equal to 12 hours
Hypothesis;
H0: The mean time used in resolving a card fraud is 12 hours
H1: The mean time used in resolving a card fraud is not 12 hours
5. How likely is an online or offline fraud to occur
Hypothesis;
H0: an online or offline card fraud occur in 12hours
H1: an online or offline card fraud doesn’t occur in 12 hours
6. Do response time, level of communication and level of advice affects customer
satisfaction on fraud resolution
Hypothesis;
H0: Response time, level of communication and advice affects customer satisfaction
H1: Response time, level of communication and advice does not affect customer
satisfaction
Statistical analysis
The study used analysis of variance (ANOVA) and test of hypothesis in data analysis. The p-
value in the analysis of variance and comparing it with the level of significance helped in
Paraphrase This Document
Need a fresh take? Get an instant paraphrase of this document with our AI Paraphraser
rejecting the null hypothesis or failing to reject the null hypothesis. If the p-value calculated was
less than the level of significance we reject null hypothesis and p-value calculated is greater than
the level of significance we thus fail to reject the null hypothesis, (Neuman, 2004).
Results, and Statistical and non-statistical Interpretation
Descriptive statistics
Data analysis was done using inferential statistics and descriptive statistics, (Kothari, 2004).
females
66%
males
34%
Experienced Card Fraud
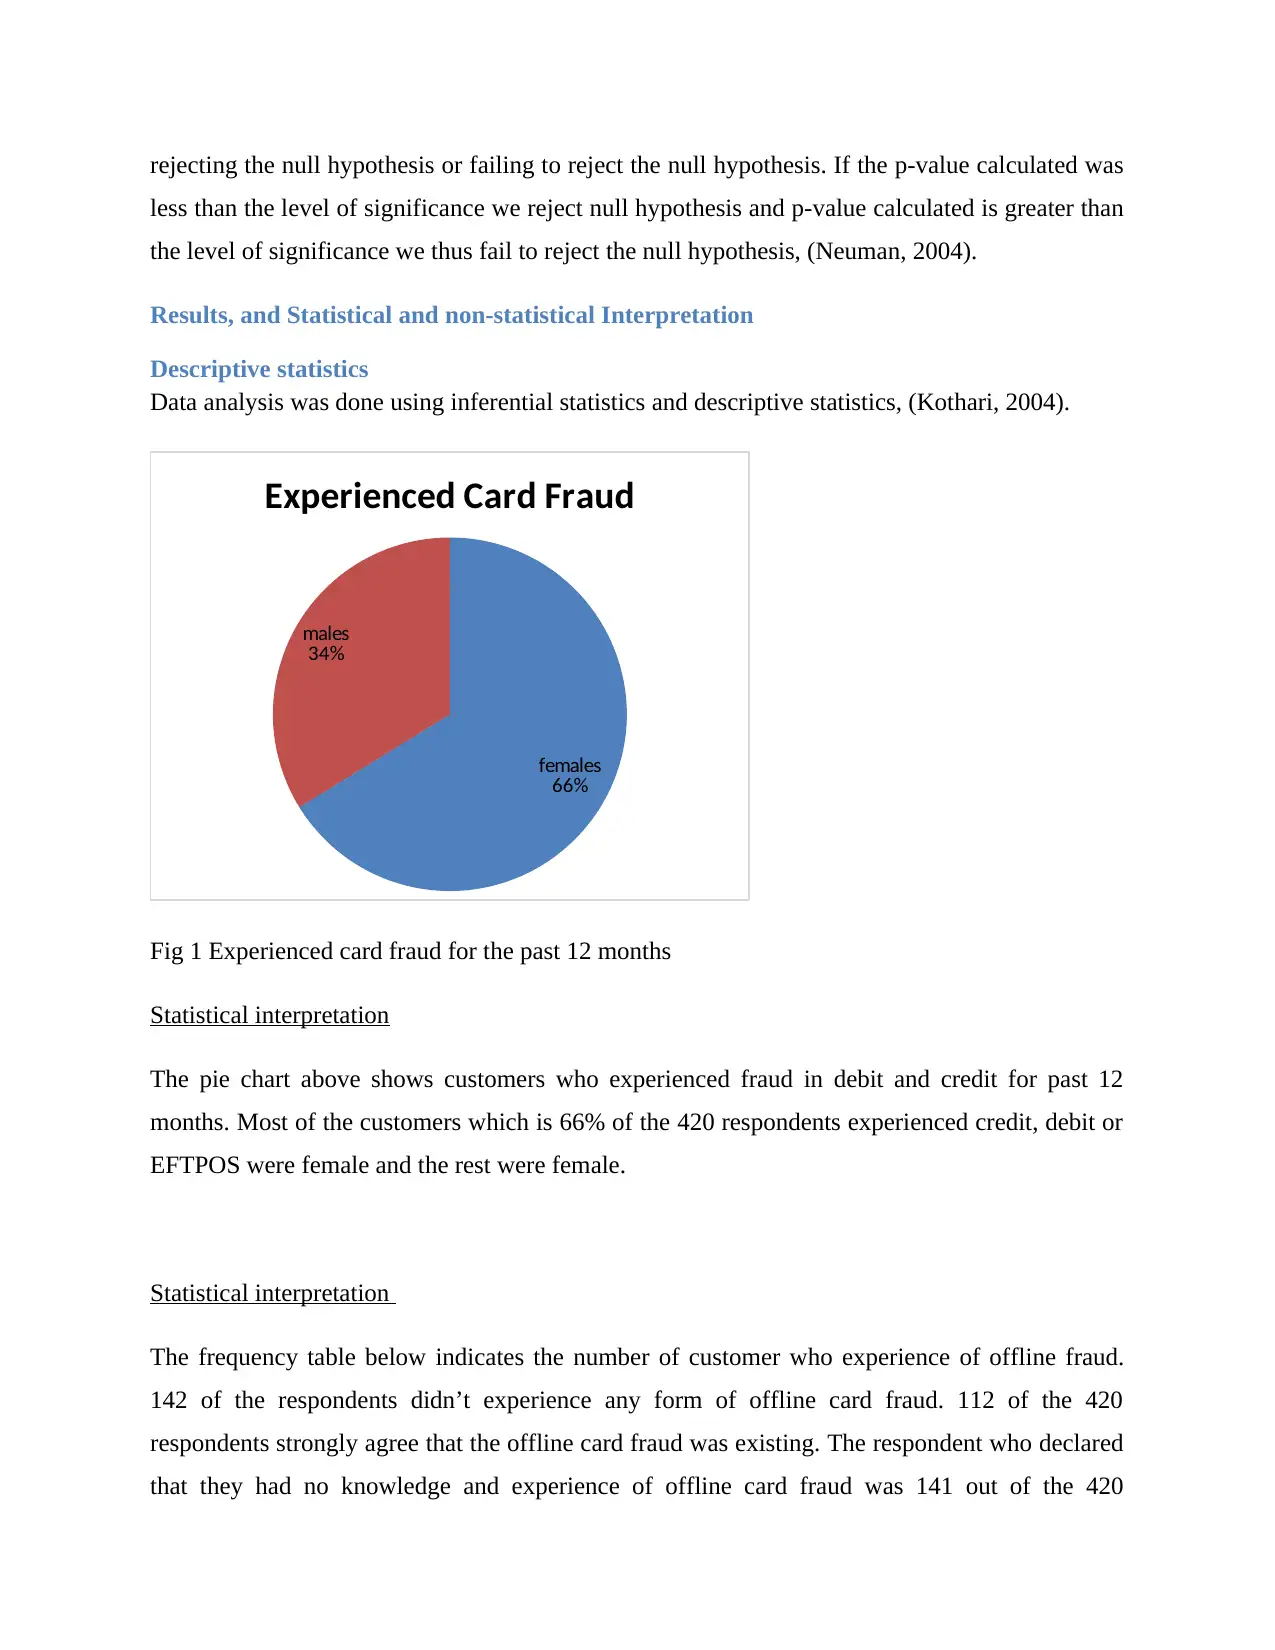
Fig 1 Experienced card fraud for the past 12 months
Statistical interpretation
The pie chart above shows customers who experienced fraud in debit and credit for past 12
months. Most of the customers which is 66% of the 420 respondents experienced credit, debit or
EFTPOS were female and the rest were female.
Statistical interpretation
The frequency table below indicates the number of customer who experience of offline fraud.
142 of the respondents didn’t experience any form of offline card fraud. 112 of the 420
respondents strongly agree that the offline card fraud was existing. The respondent who declared
that they had no knowledge and experience of offline card fraud was 141 out of the 420
less than the level of significance we reject null hypothesis and p-value calculated is greater than
the level of significance we thus fail to reject the null hypothesis, (Neuman, 2004).
Results, and Statistical and non-statistical Interpretation
Descriptive statistics
Data analysis was done using inferential statistics and descriptive statistics, (Kothari, 2004).
females
66%
males
34%
Experienced Card Fraud
Fig 1 Experienced card fraud for the past 12 months
Statistical interpretation
The pie chart above shows customers who experienced fraud in debit and credit for past 12
months. Most of the customers which is 66% of the 420 respondents experienced credit, debit or
EFTPOS were female and the rest were female.
Statistical interpretation
The frequency table below indicates the number of customer who experience of offline fraud.
142 of the respondents didn’t experience any form of offline card fraud. 112 of the 420
respondents strongly agree that the offline card fraud was existing. The respondent who declared
that they had no knowledge and experience of offline card fraud was 141 out of the 420
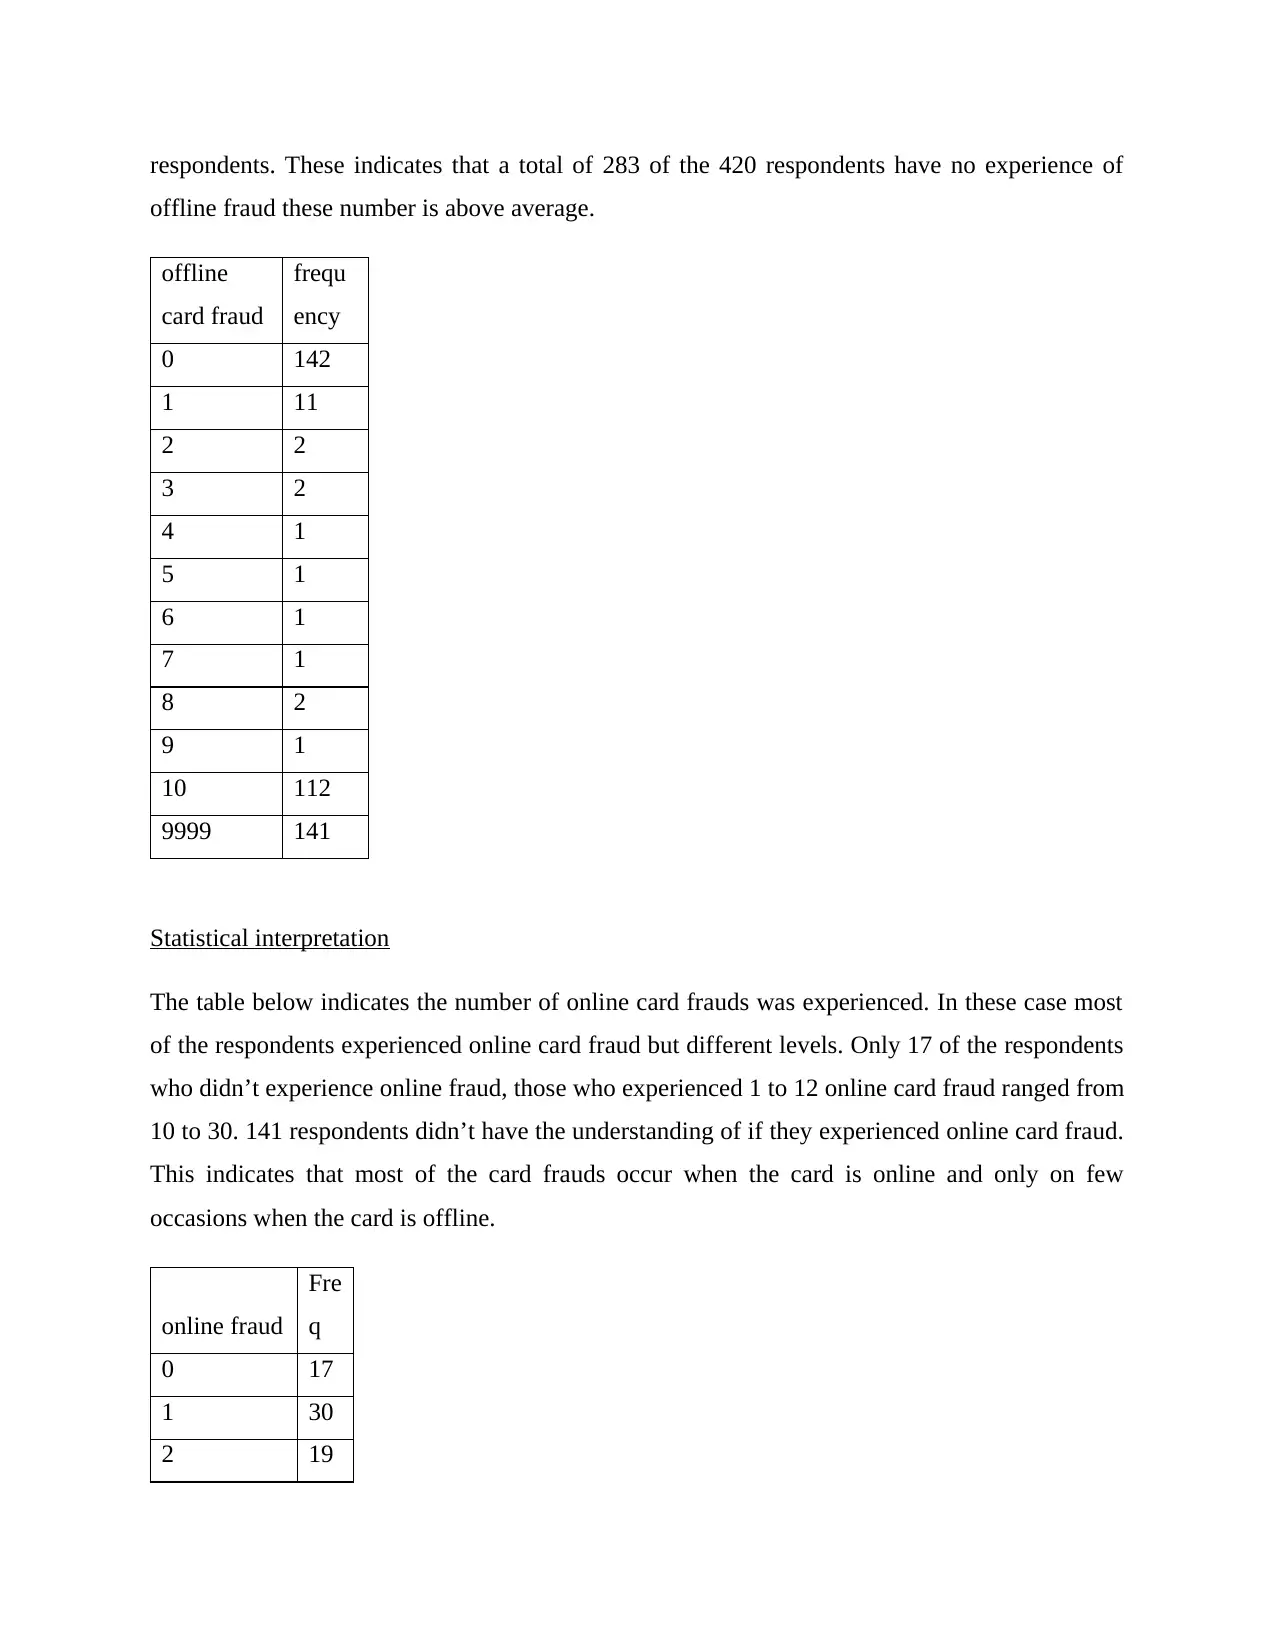
respondents. These indicates that a total of 283 of the 420 respondents have no experience of
offline fraud these number is above average.
offline
card fraud
frequ
ency
0 142
1 11
2 2
3 2
4 1
5 1
6 1
7 1
8 2
9 1
10 112
9999 141
Statistical interpretation
The table below indicates the number of online card frauds was experienced. In these case most
of the respondents experienced online card fraud but different levels. Only 17 of the respondents
who didn’t experience online fraud, those who experienced 1 to 12 online card fraud ranged from
10 to 30. 141 respondents didn’t have the understanding of if they experienced online card fraud.
This indicates that most of the card frauds occur when the card is online and only on few
occasions when the card is offline.
online fraud
Fre
q
0 17
1 30
2 19
⊘ This is a preview!⊘
Do you want full access?
Subscribe today to unlock all pages.
Trusted by 1+ million students worldwide
3 15
4 17
5 20
6 19
7 13
8 18
9 26
10 17
11 29
12 26
9999
14
1
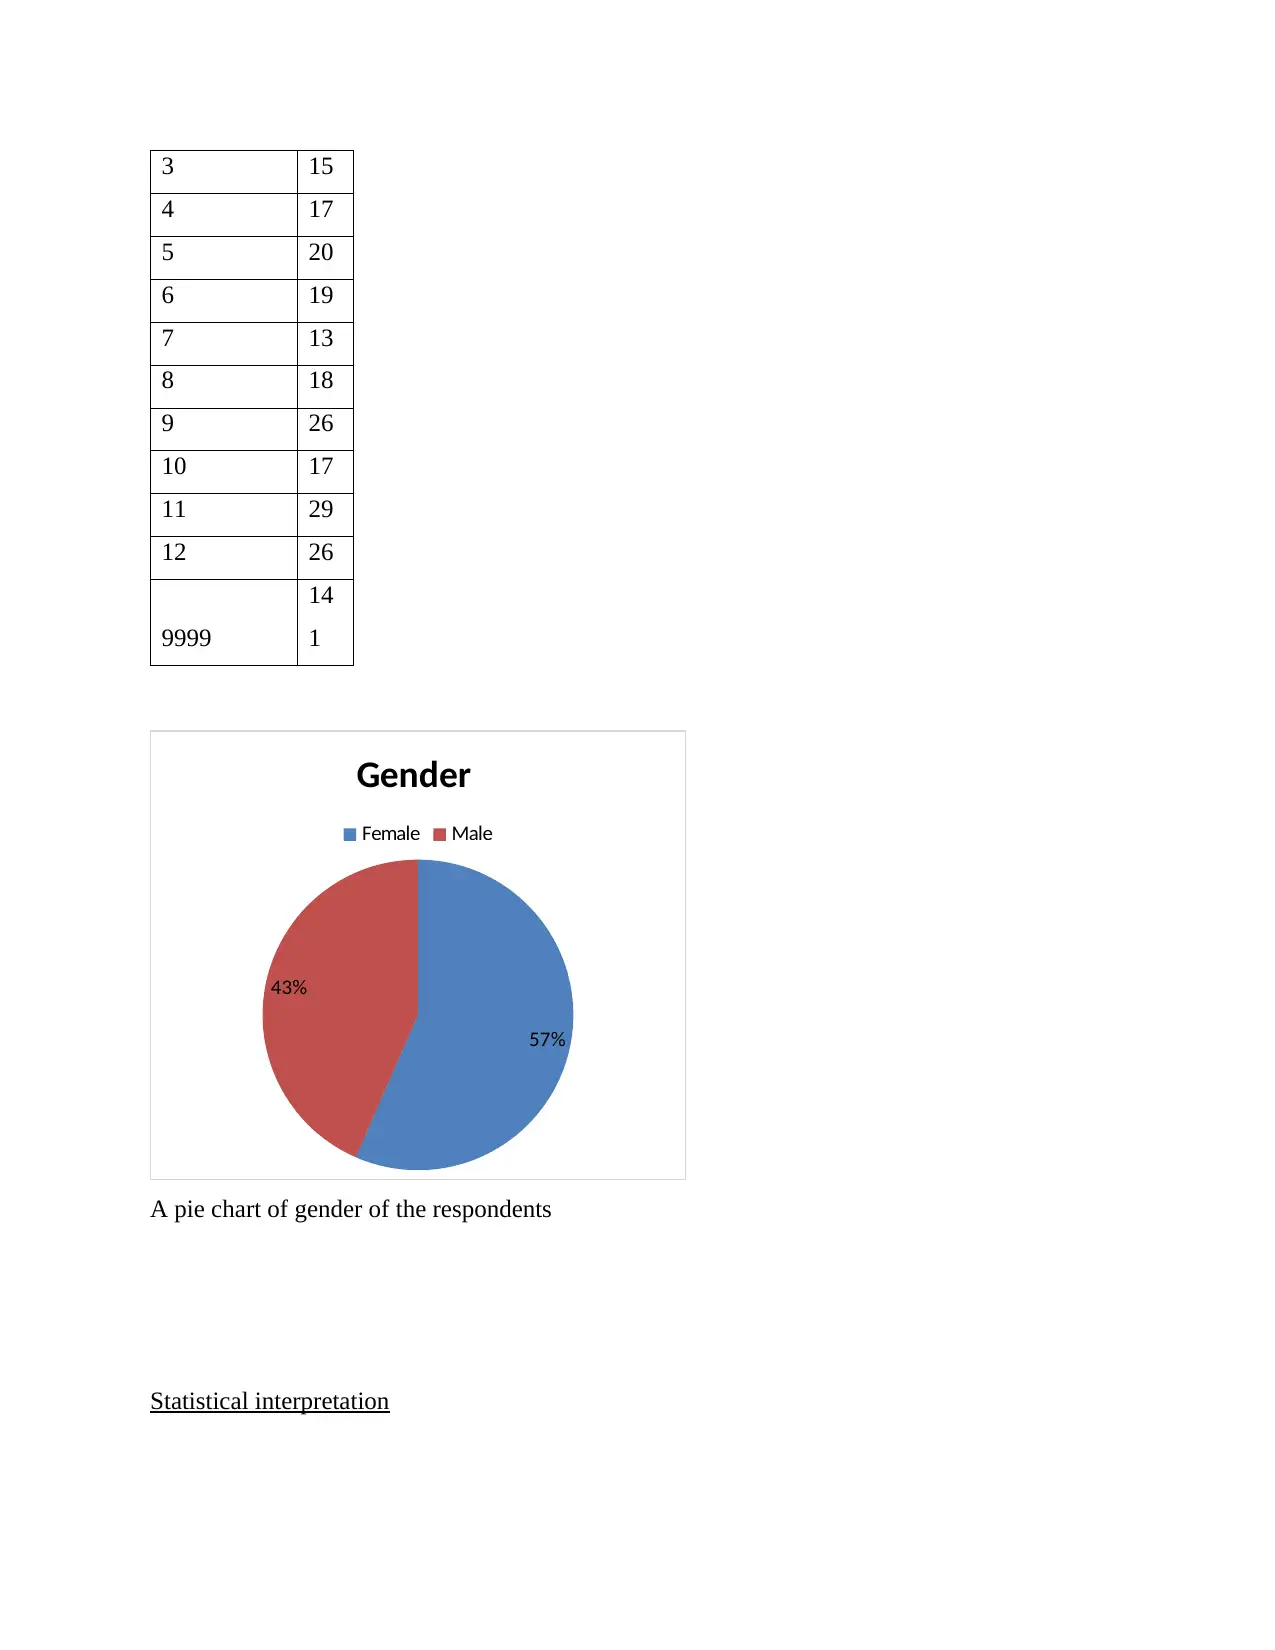
A pie chart of gender of the respondents
Statistical interpretation
57%
43%
Gender
Female Male
4 17
5 20
6 19
7 13
8 18
9 26
10 17
11 29
12 26
9999
14
1
A pie chart of gender of the respondents
Statistical interpretation
57%
43%
Gender
Female Male
Paraphrase This Document
Need a fresh take? Get an instant paraphrase of this document with our AI Paraphraser
57% of the respondents were females while 43% of the respondents were males. Out of the 420
respondents 237 of them were females while 182 of them were males. These indicate the
majority of the respondents were female.
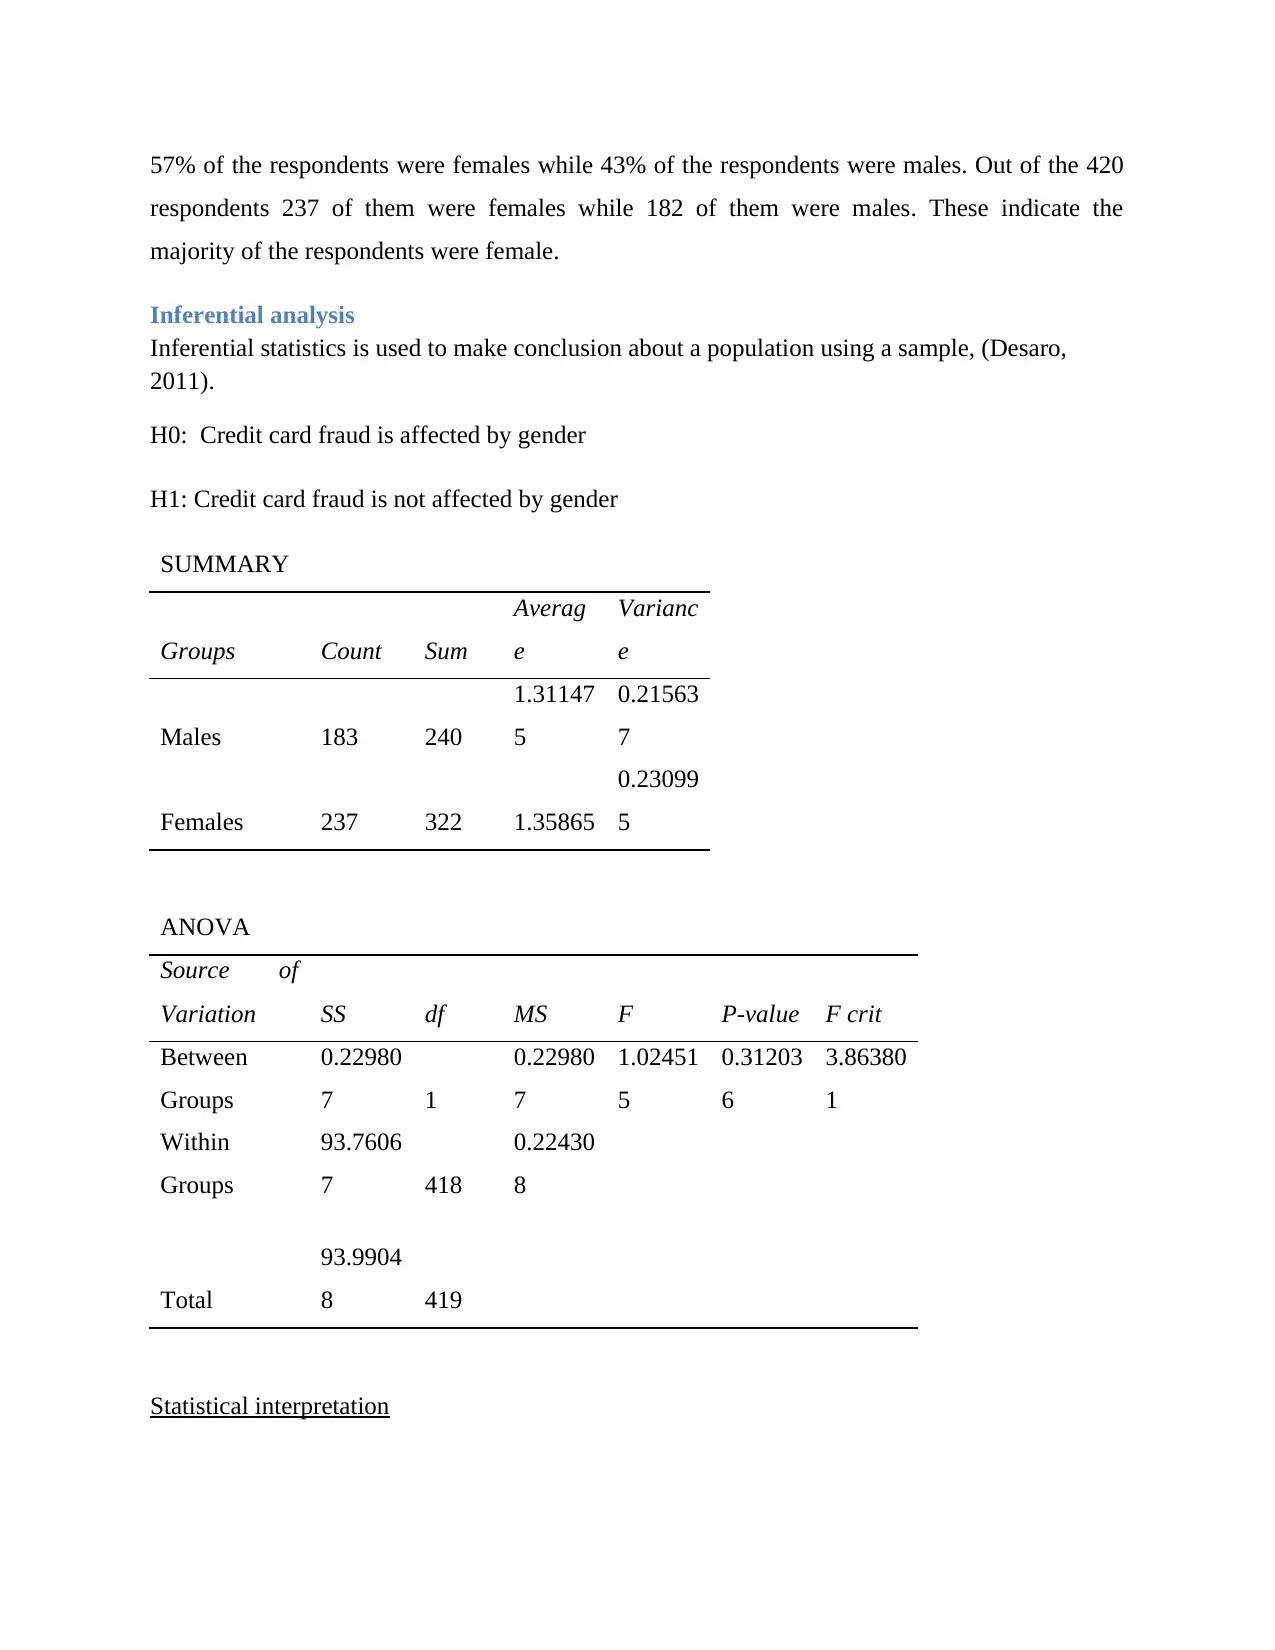
Inferential analysis
Inferential statistics is used to make conclusion about a population using a sample, (Desaro,
2011).
H0: Credit card fraud is affected by gender
H1: Credit card fraud is not affected by gender
SUMMARY
Groups Count Sum
Averag
e
Varianc
e
Males 183 240
1.31147
5
0.21563
7
Females 237 322 1.35865
0.23099
5
ANOVA
Source of
Variation SS df MS F P-value F crit
Between
Groups
0.22980
7 1
0.22980
7
1.02451
5
0.31203
6
3.86380
1
Within
Groups
93.7606
7 418
0.22430
8
Total
93.9904
8 419
Statistical interpretation
respondents 237 of them were females while 182 of them were males. These indicate the
majority of the respondents were female.
Inferential analysis
Inferential statistics is used to make conclusion about a population using a sample, (Desaro,
2011).
H0: Credit card fraud is affected by gender
H1: Credit card fraud is not affected by gender
SUMMARY
Groups Count Sum
Averag
e
Varianc
e
Males 183 240
1.31147
5
0.21563
7
Females 237 322 1.35865
0.23099
5
ANOVA
Source of
Variation SS df MS F P-value F crit
Between
Groups
0.22980
7 1
0.22980
7
1.02451
5
0.31203
6
3.86380
1
Within
Groups
93.7606
7 418
0.22430
8
Total
93.9904
8 419
Statistical interpretation
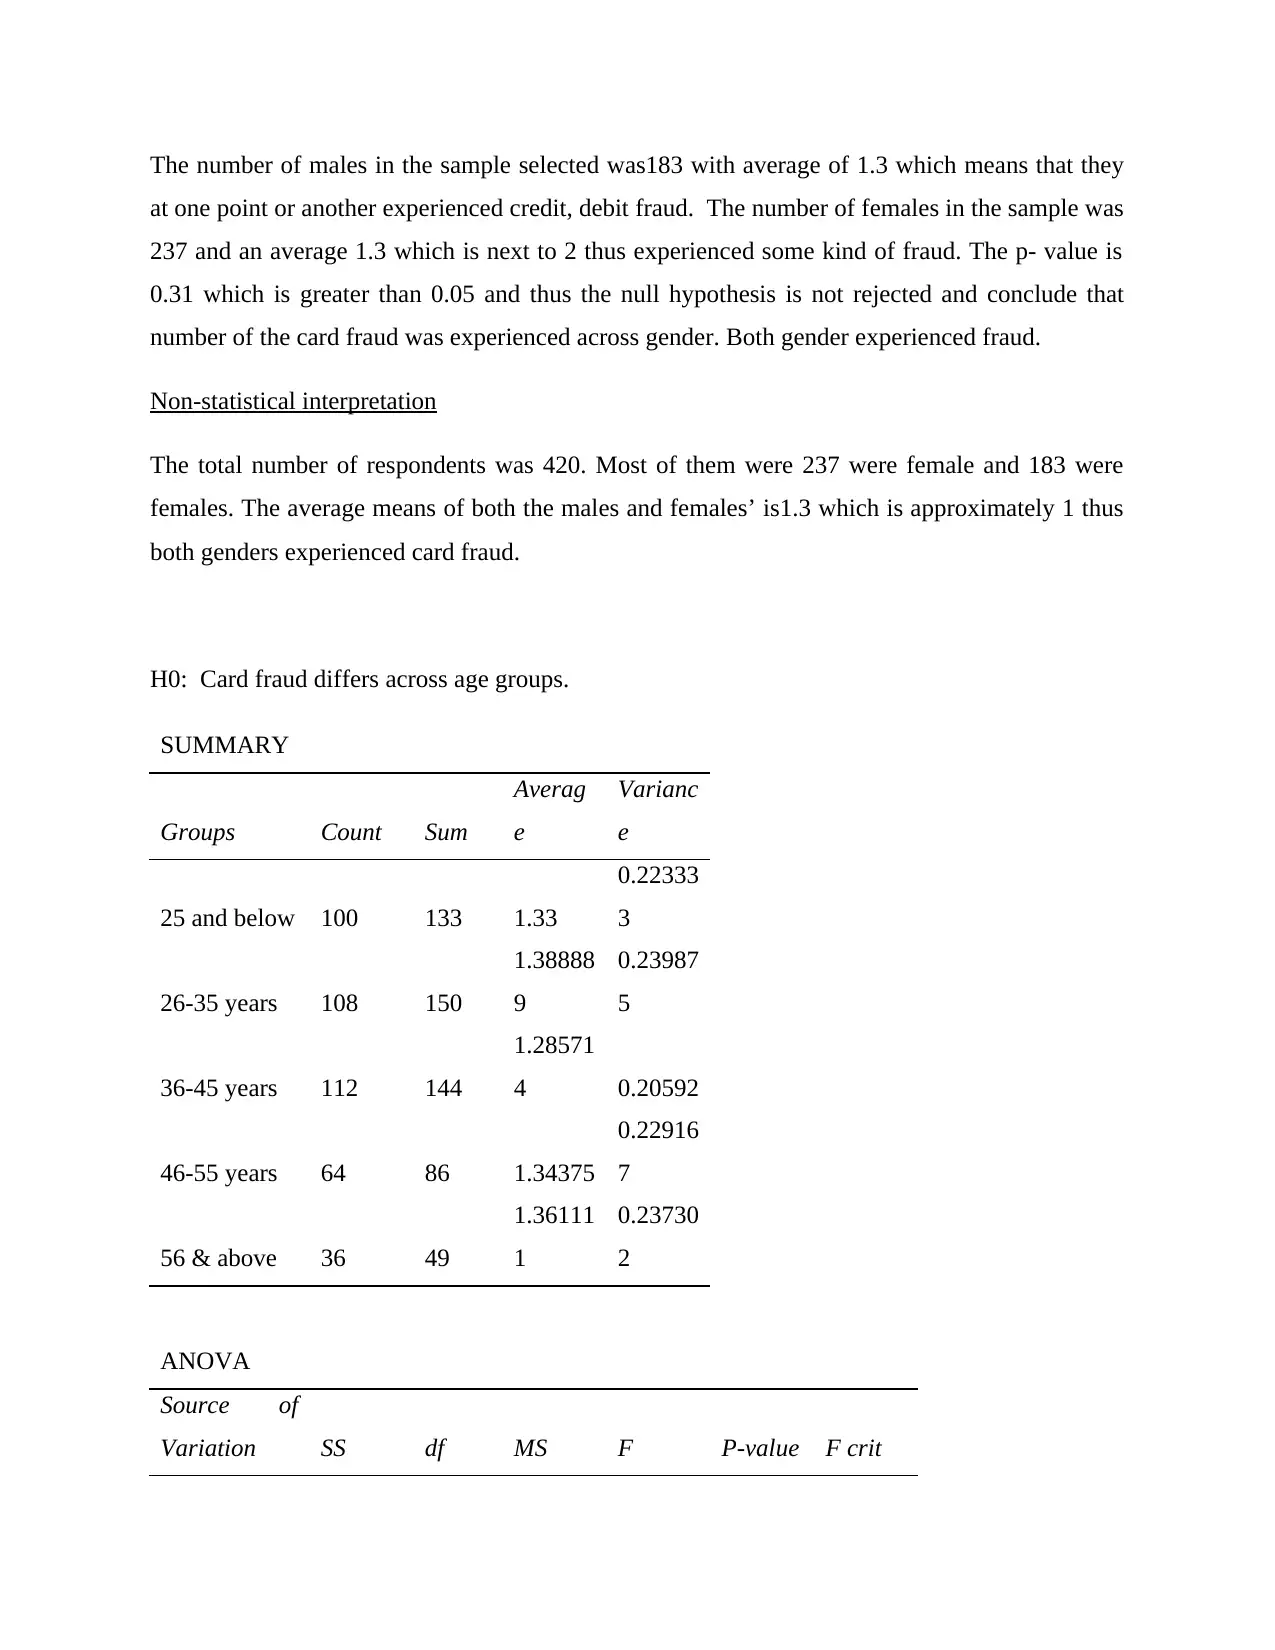
The number of males in the sample selected was183 with average of 1.3 which means that they
at one point or another experienced credit, debit fraud. The number of females in the sample was
237 and an average 1.3 which is next to 2 thus experienced some kind of fraud. The p- value is
0.31 which is greater than 0.05 and thus the null hypothesis is not rejected and conclude that
number of the card fraud was experienced across gender. Both gender experienced fraud.
Non-statistical interpretation
The total number of respondents was 420. Most of them were 237 were female and 183 were
females. The average means of both the males and females’ is1.3 which is approximately 1 thus
both genders experienced card fraud.
H0: Card fraud differs across age groups.
SUMMARY
Groups Count Sum
Averag
e
Varianc
e
25 and below 100 133 1.33
0.22333
3
26-35 years 108 150
1.38888
9
0.23987
5
36-45 years 112 144
1.28571
4 0.20592
46-55 years 64 86 1.34375
0.22916
7
56 & above 36 49
1.36111
1
0.23730
2
ANOVA
Source of
Variation SS df MS F P-value F crit
⊘ This is a preview!⊘
Do you want full access?
Subscribe today to unlock all pages.
Trusted by 1+ million students worldwide
Between
Groups
0.61361
1 4
0.15340
3
0.68177
7
0.60489
5
2.39343
8
Within
Groups
93.3768
7 415
0.22500
4
Total
93.9904
8 419
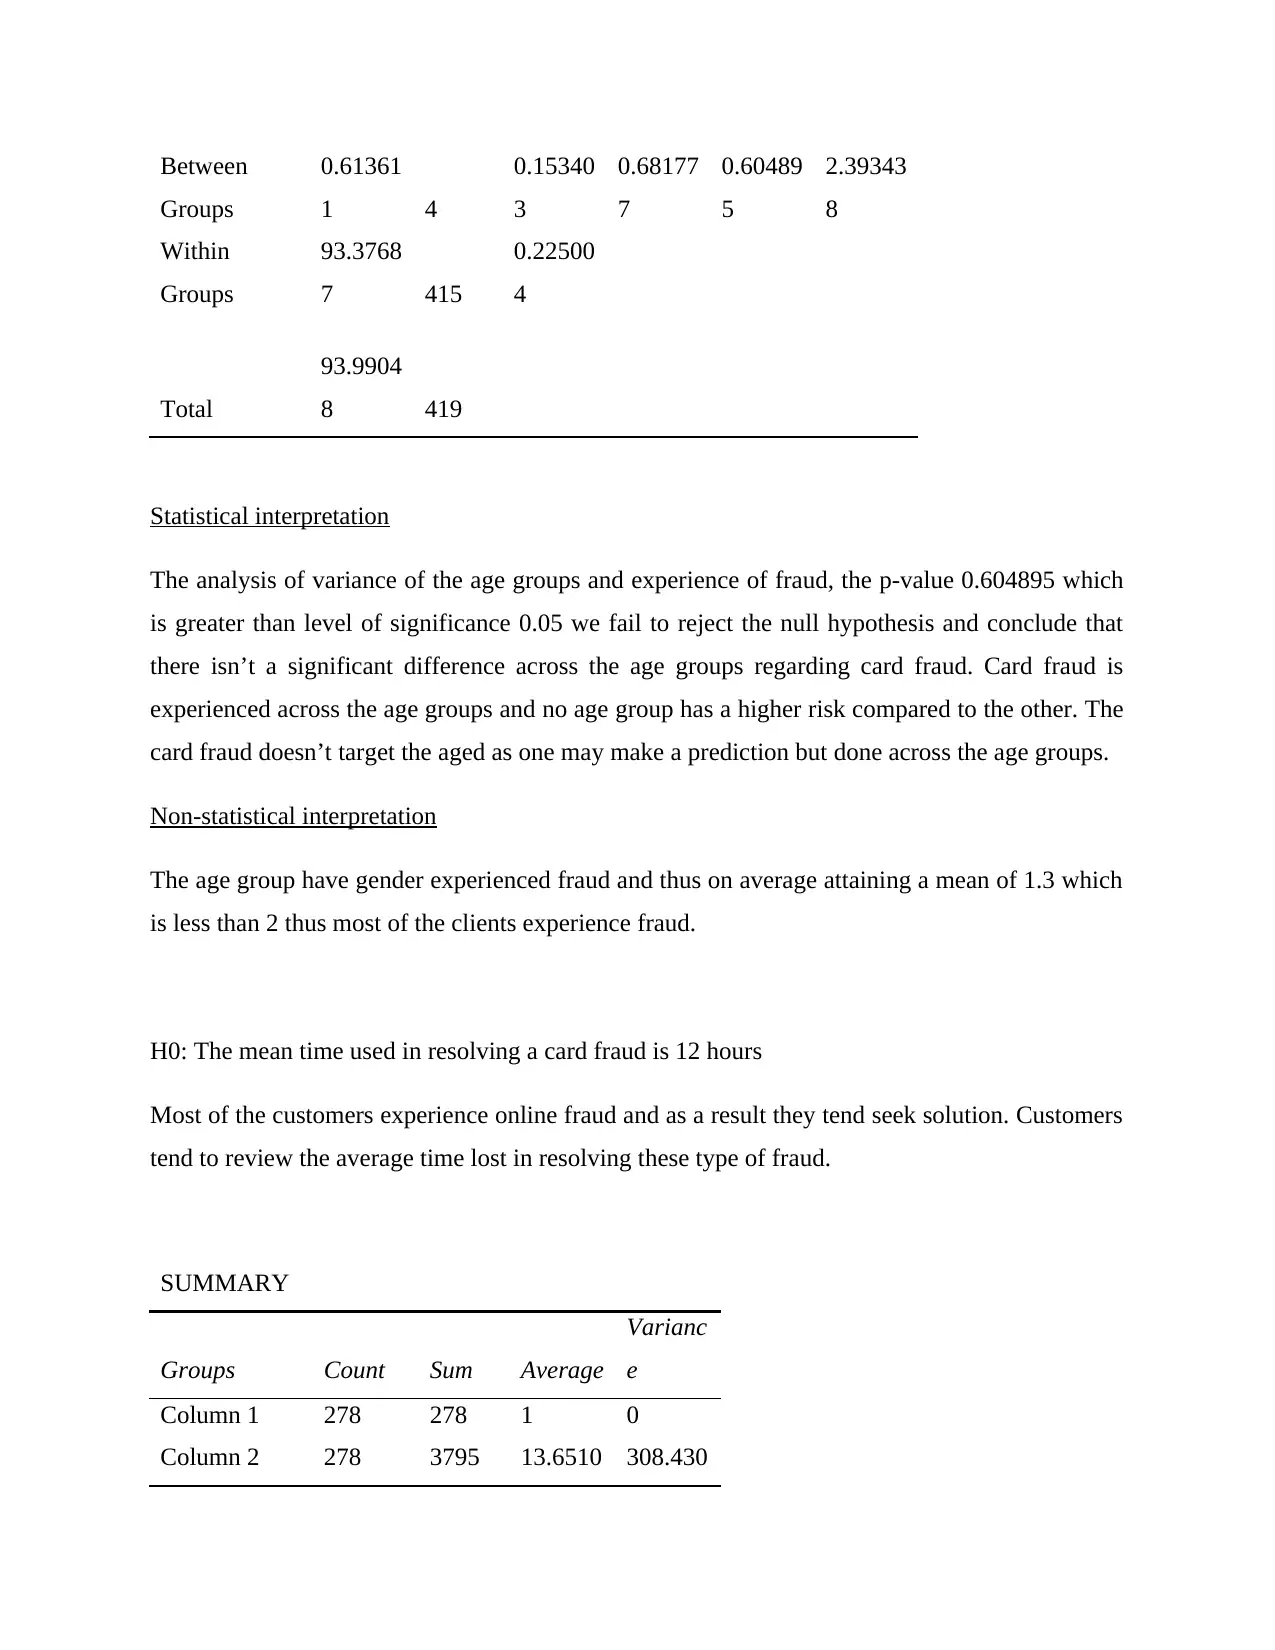
Statistical interpretation
The analysis of variance of the age groups and experience of fraud, the p-value 0.604895 which
is greater than level of significance 0.05 we fail to reject the null hypothesis and conclude that
there isn’t a significant difference across the age groups regarding card fraud. Card fraud is
experienced across the age groups and no age group has a higher risk compared to the other. The
card fraud doesn’t target the aged as one may make a prediction but done across the age groups.
Non-statistical interpretation
The age group have gender experienced fraud and thus on average attaining a mean of 1.3 which
is less than 2 thus most of the clients experience fraud.
H0: The mean time used in resolving a card fraud is 12 hours
Most of the customers experience online fraud and as a result they tend seek solution. Customers
tend to review the average time lost in resolving these type of fraud.
SUMMARY
Groups Count Sum Average
Varianc
e
Column 1 278 278 1 0
Column 2 278 3795 13.6510 308.430
Groups
0.61361
1 4
0.15340
3
0.68177
7
0.60489
5
2.39343
8
Within
Groups
93.3768
7 415
0.22500
4
Total
93.9904
8 419
Statistical interpretation
The analysis of variance of the age groups and experience of fraud, the p-value 0.604895 which
is greater than level of significance 0.05 we fail to reject the null hypothesis and conclude that
there isn’t a significant difference across the age groups regarding card fraud. Card fraud is
experienced across the age groups and no age group has a higher risk compared to the other. The
card fraud doesn’t target the aged as one may make a prediction but done across the age groups.
Non-statistical interpretation
The age group have gender experienced fraud and thus on average attaining a mean of 1.3 which
is less than 2 thus most of the clients experience fraud.
H0: The mean time used in resolving a card fraud is 12 hours
Most of the customers experience online fraud and as a result they tend seek solution. Customers
tend to review the average time lost in resolving these type of fraud.
SUMMARY
Groups Count Sum Average
Varianc
e
Column 1 278 278 1 0
Column 2 278 3795 13.6510 308.430
Paraphrase This Document
Need a fresh take? Get an instant paraphrase of this document with our AI Paraphraser
8 2
ANOVA
Source of
Variation SS df MS F
P-
value F crit
Between
Groups
22246.9
2 1
22246.9
2
144.259
1
1.07E-
29
3.85829
8
Within
Groups
85435.1
5 554
154.215
1
Total
107682.
1 555
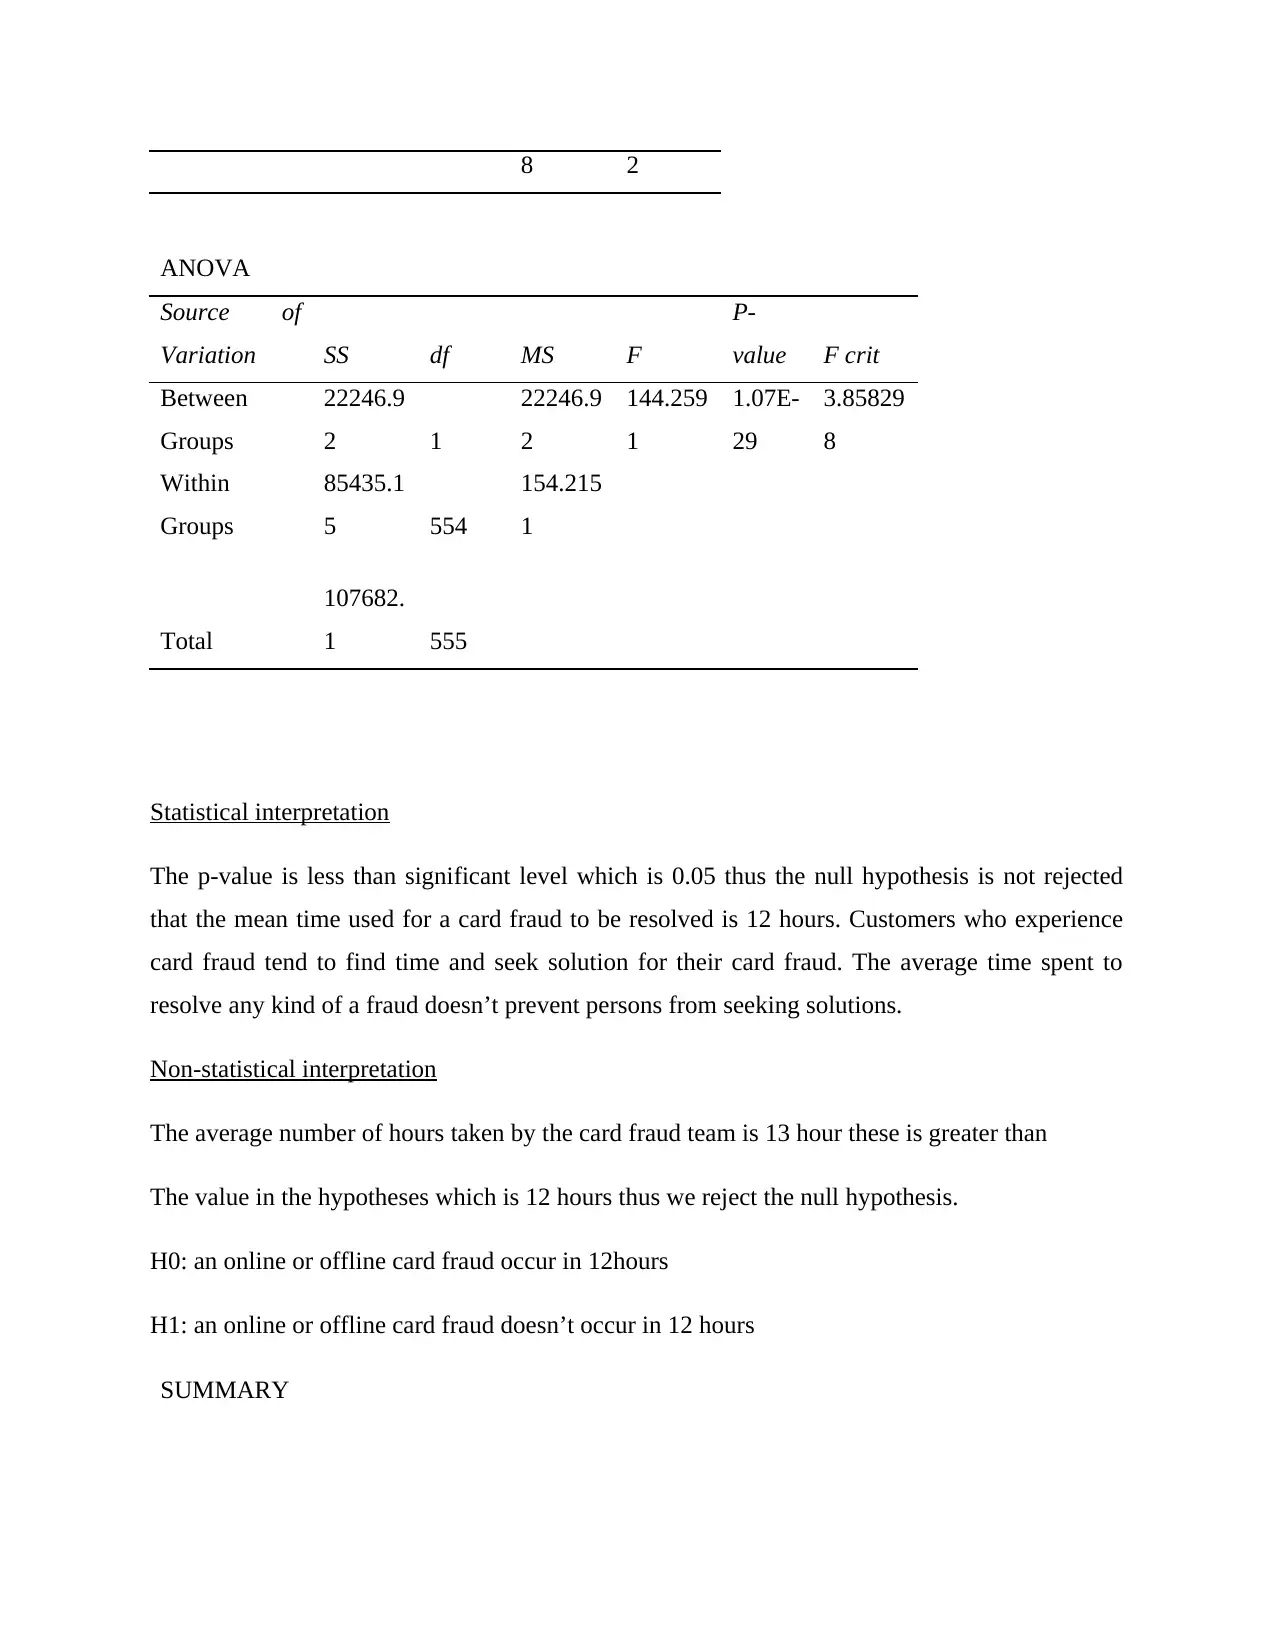
Statistical interpretation
The p-value is less than significant level which is 0.05 thus the null hypothesis is not rejected
that the mean time used for a card fraud to be resolved is 12 hours. Customers who experience
card fraud tend to find time and seek solution for their card fraud. The average time spent to
resolve any kind of a fraud doesn’t prevent persons from seeking solutions.
Non-statistical interpretation
The average number of hours taken by the card fraud team is 13 hour these is greater than
The value in the hypotheses which is 12 hours thus we reject the null hypothesis.
H0: an online or offline card fraud occur in 12hours
H1: an online or offline card fraud doesn’t occur in 12 hours
SUMMARY
ANOVA
Source of
Variation SS df MS F
P-
value F crit
Between
Groups
22246.9
2 1
22246.9
2
144.259
1
1.07E-
29
3.85829
8
Within
Groups
85435.1
5 554
154.215
1
Total
107682.
1 555
Statistical interpretation
The p-value is less than significant level which is 0.05 thus the null hypothesis is not rejected
that the mean time used for a card fraud to be resolved is 12 hours. Customers who experience
card fraud tend to find time and seek solution for their card fraud. The average time spent to
resolve any kind of a fraud doesn’t prevent persons from seeking solutions.
Non-statistical interpretation
The average number of hours taken by the card fraud team is 13 hour these is greater than
The value in the hypotheses which is 12 hours thus we reject the null hypothesis.
H0: an online or offline card fraud occur in 12hours
H1: an online or offline card fraud doesn’t occur in 12 hours
SUMMARY
Groups Count Sum Average
Varianc
e
Column 1 278 278 1 0
Column 2 278 1743
6.26978
4
15.4034
9
ANOVA
Source of
Variation SS df MS F
P-
value F crit
Between
Groups
3860.11
7 1
3860.11
7
501.200
4
1.51E-
79
3.85829
8
Within
Groups
4266.76
6 554
7.70174
4
Total
8126.88
3 555
ANOVA above online card fraud
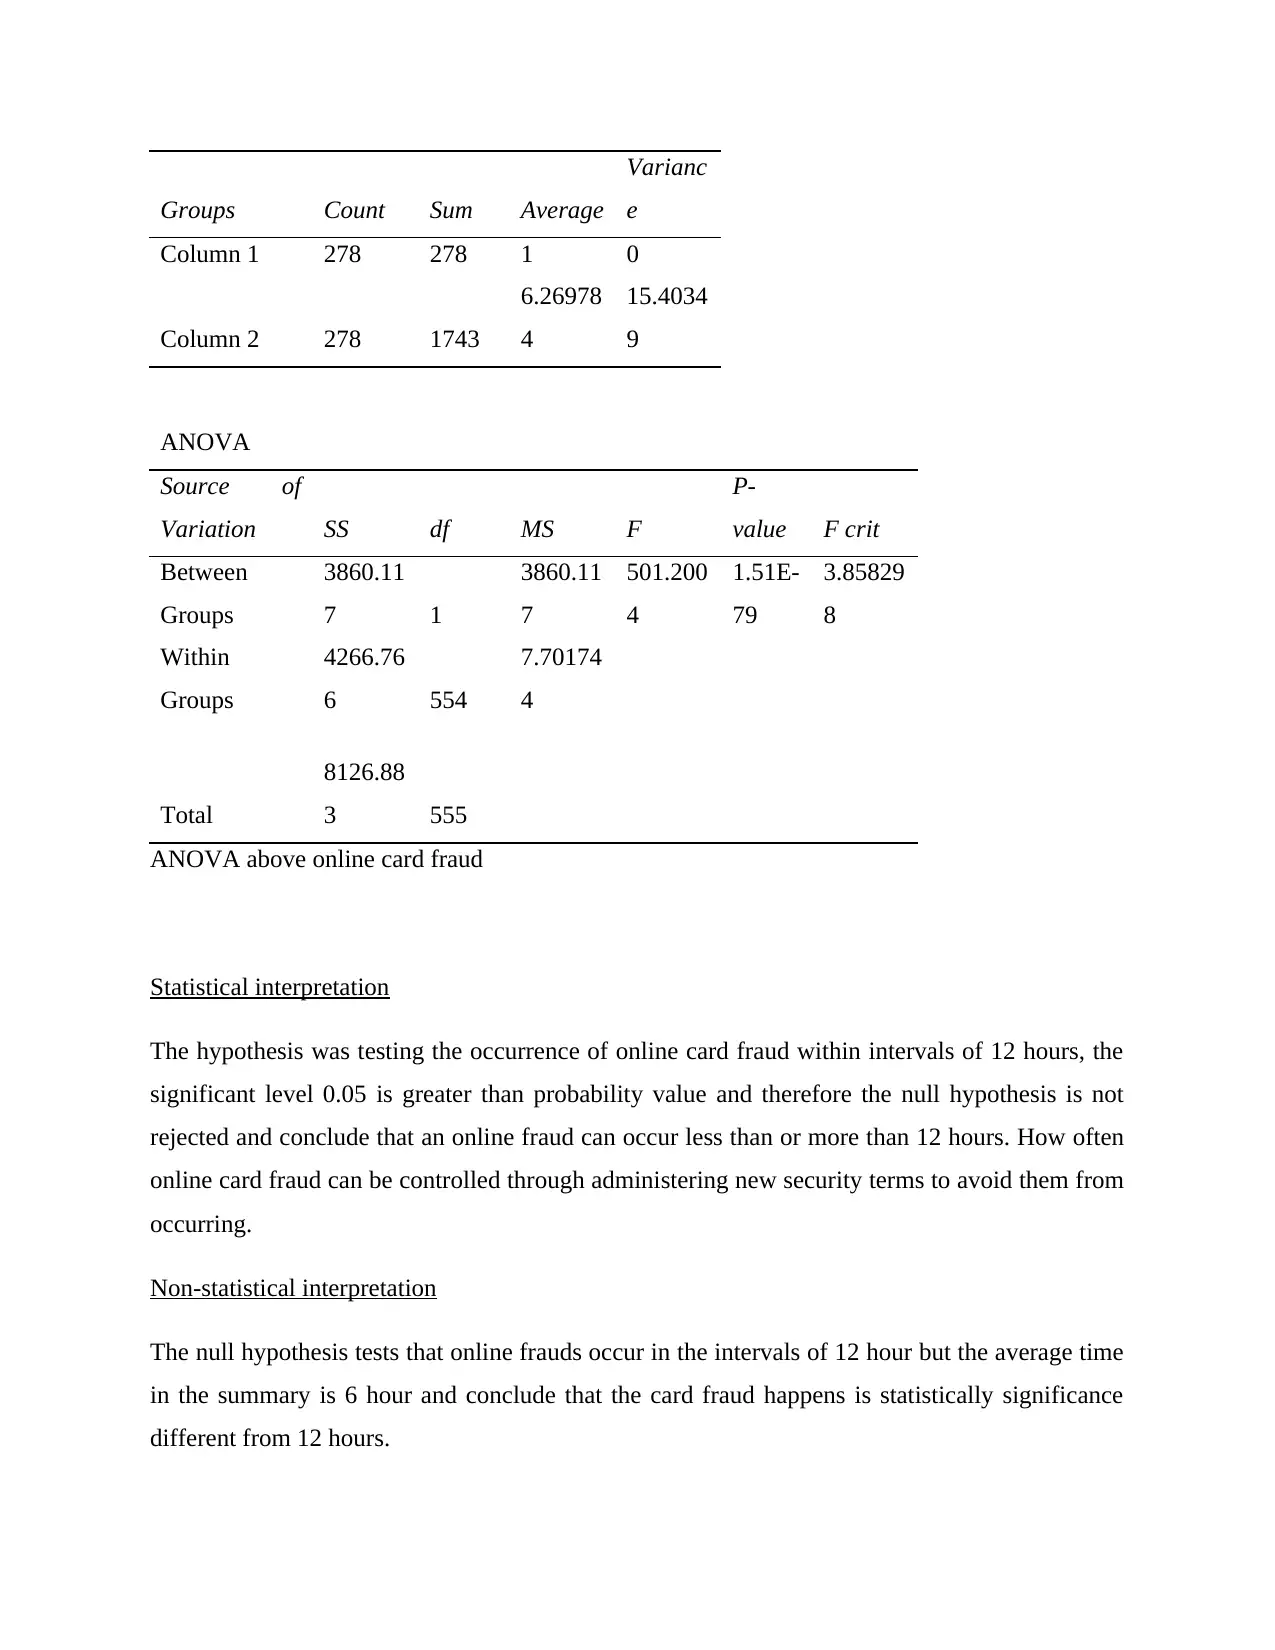
Statistical interpretation
The hypothesis was testing the occurrence of online card fraud within intervals of 12 hours, the
significant level 0.05 is greater than probability value and therefore the null hypothesis is not
rejected and conclude that an online fraud can occur less than or more than 12 hours. How often
online card fraud can be controlled through administering new security terms to avoid them from
occurring.
Non-statistical interpretation
The null hypothesis tests that online frauds occur in the intervals of 12 hour but the average time
in the summary is 6 hour and conclude that the card fraud happens is statistically significance
different from 12 hours.
Varianc
e
Column 1 278 278 1 0
Column 2 278 1743
6.26978
4
15.4034
9
ANOVA
Source of
Variation SS df MS F
P-
value F crit
Between
Groups
3860.11
7 1
3860.11
7
501.200
4
1.51E-
79
3.85829
8
Within
Groups
4266.76
6 554
7.70174
4
Total
8126.88
3 555
ANOVA above online card fraud
Statistical interpretation
The hypothesis was testing the occurrence of online card fraud within intervals of 12 hours, the
significant level 0.05 is greater than probability value and therefore the null hypothesis is not
rejected and conclude that an online fraud can occur less than or more than 12 hours. How often
online card fraud can be controlled through administering new security terms to avoid them from
occurring.
Non-statistical interpretation
The null hypothesis tests that online frauds occur in the intervals of 12 hour but the average time
in the summary is 6 hour and conclude that the card fraud happens is statistically significance
different from 12 hours.
⊘ This is a preview!⊘
Do you want full access?
Subscribe today to unlock all pages.
Trusted by 1+ million students worldwide
1 out of 19


Your All-in-One AI-Powered Toolkit for Academic Success.
+13062052269
info@desklib.com
Available 24*7 on WhatsApp / Email
![[object Object]](/_next/static/media/star-bottom.7253800d.svg)
Unlock your academic potential
Copyright © 2020–2026 A2Z Services. All Rights Reserved. Developed and managed by ZUCOL.