Visual Analytics Report: Red and White Wine Quality Analysis
VerifiedAdded on 2019/09/16
|18
|3698
|919
Report
AI Summary
This report presents a visual analytics study of red and white wine quality, focusing on the impact of various chemical components such as alcohol, sulfur dioxide, residual sugar, and pH levels on quality ratings. The analysis utilizes R software and statistical tools like distribution analysis, scatter plot matrices, and correlation analysis to explore the relationships between these components and wine quality. Key findings reveal differences in the composition of red and white wines, including higher sulfur dioxide levels in white wine and correlations between alcohol content, pH, and density. The study aims to provide insights for wine producers to optimize wine composition for better quality ratings, addressing research questions about the factors influencing wine quality and the benefits of understanding these components in wine production. Desklib offers this assignment solution as a resource for students, alongside a wealth of other solved assignments and study materials.
Visual Analytics
Red Wine and White Wine Quality Analysis Considering Internal Compositions
Student Name:
Student ID:
Course Name:
Course ID:
Faculty Name:
University Name:
Red Wine and White Wine Quality Analysis Considering Internal Compositions
Student Name:
Student ID:
Course Name:
Course ID:
Faculty Name:
University Name:
Paraphrase This Document
Need a fresh take? Get an instant paraphrase of this document with our AI Paraphraser
Introduction
The paper is concerned with the study of white wine and red wine quality in relation to the
presence of various components in them such as alcohol, sulphur, residual sugar, and other.
The major focus is to understand the quality ratings of the wines. The first chapter discusses
the motivation behind conducting this study and the type of data being used. Moreover, some
research questions have been developed which is likely to be answered at the end of this
research. The next chapter is concerned with understanding the approach of the research. The
chapter of analytical steps discusses the ways considered for reaching the results. The chapter
on finding discusses the important findings and answers the research questions. The final
chapter critically analyses the implications of the findings and the other aspects.
Motivation, Data, Research Questions
The wine quality is an important aspect in attracting the customers to make the purchase
(Charters and Pettigrew, 2007). There are various chemicals aspects within the wine that
impacts the rating of the wines by the customers. The presence of one aspect and the absence
of another change the way wines taste. These chemical components are integral part to the
wine quality (Bell et al, 1979). This research paper is focused towards assessing the
components that plays major role in quality ratings of the wines. This paper has selected two
types of wine for the study, one is red wine and another is white wine.
Motivation for the Study
The benefits of understanding what components lead to better ratings of the wine are wide.
The companies involved in the development of wines must be curious to know the reasons
why particular wine category is rated good by the customers and other is not (O’Neill and
Charters, 2000). The study will be demystifying the factors that are important to be kept in
consideration while manufacturing wines. The two major wine categories are normally
manufactured by the companies, red wine, and white wine. The comparative study of
elements within the red and white wine will help companies in deciding which one to
produce and with what composition.
Data and its Suitability
There are two types of data that has been collected for analysis of the wine quality. The data
has been brought from the secondary sources. The UCI Machine Learning Repository which
collects data in association with National Science Foundation and Rexa.info
(Archive.ics.uci.edu, 2009). The two data sets taken for the analyses are related to the
Portuguese “Vinho Verde” wine. It is a wine company situated in Portuguese. As per the data
source, the data variables are related only to the physiochemical (input) and sensory (output).
The reason is cited is privacy and logistic challenges. The input variables that are present in
the data are given below:
1 - fixed acidity
2 - volatile acidity
3 - citric acid
4 - residual sugar
5 - chlorides
6 - free sulfur dioxide
7 - total sulfur dioxide
8 - density
9 - pH
10 - sulphates
11 - alcohol
The output variable of the data is:
12 – Quality (score between 0 and 10)
In total, there are 12 attributes within the data set and the total number of instances is 4898
(Archive.ics.uci.edu, 2009). The data set and attribute characteristics are multivariate and real
respectively. All these data are from particular Portugal region only.
Research Questions to Investigate
The research questions have been prepared concerning the topic of the research. The research
questions are:
- What are the major and important factors that impact the wine quality preferences?
- How understanding components behind wine quality is beneficial in wine production?
These are the questions that will be answered through the investigation. However, it cannot
be stated at this point that the research will lead to understanding all the questions that put
forward for the study.
Tasks and Approach
This chapter discusses the visual and computational techniques that have been used in the
conduction of this research. The paper has considered the utilization of R as the software
tools to analyse the data. The statistical tools that have been used to analyse the data are
distribution analysis for the data of red and white wine, scatter plot matrix, correlation
analysis, and analysis plot. The data were passed through these statistical tests and the visual
presentation of each analysis has been presented in the next chapter. The R software has been
used which is a free statistical computing software which is capable enough to carry out
necessary statistical tasks. The distribution analysis was the first step through which all the
data was passed. The distribution analysis helps make the data readable and understandable
for human eye and mind (Dixon and Massey, 1957). The visual analysis method has been
used in this paper (Van and Jewitt, 2001).
⊘ This is a preview!⊘
Do you want full access?
Subscribe today to unlock all pages.
Trusted by 1+ million students worldwide
Analytical Steps
This chapter is concerned with the analysis of the data brought in from the secondary
resource. The analysis has been conducted considering the below mentioned parameters:
coho: It is the important aspect for the wine quality and therefore it has been considered to
understand the quality (Darias-Martin et al, 2002).
SO2 values: The analysis will focus on the effect this chemical has on the quality
determination of the wine (Bakker et al, 1998).
Alcohol content: It is also an important variable that determines the quality of the wine. Wine
is an alcoholic product and the customers’ prefer its quantity.
The further analysis is focused on analysing these three parameters together and tries to
understand the effect it has on the wine quality.
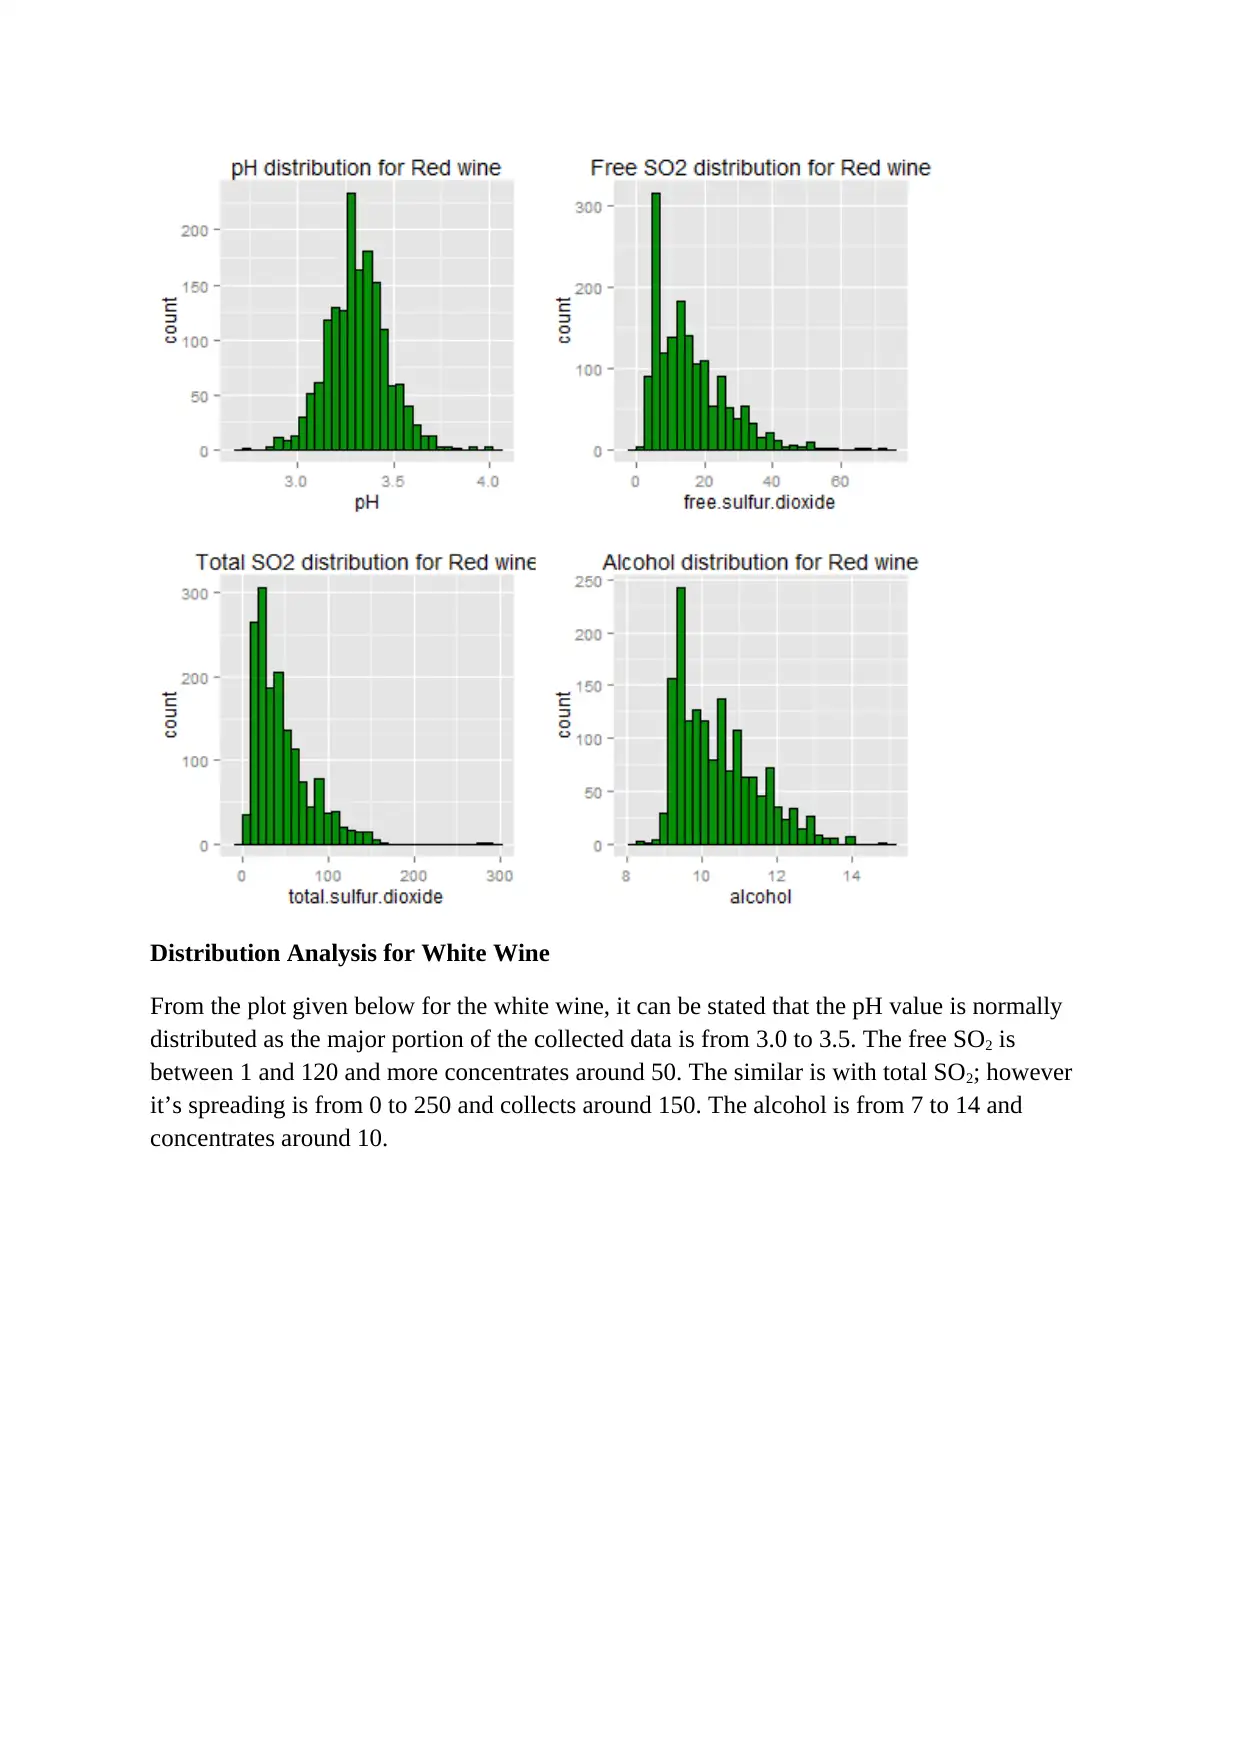
Distribution Analysis for Red Wine
From the plot given below for the red wine, it can be stated that the pH value is normally
distributed as the major portion of the collected data is from 3.0 to 3.5. The free SO2 is
between 1 and 100 and more inclined around 50. The similar is with total SO2; however it’s
spreading is from 0 to 300 and collects around 150. The alcohol is from 8 to 15 and
concentrates around 10.
This chapter is concerned with the analysis of the data brought in from the secondary
resource. The analysis has been conducted considering the below mentioned parameters:
coho: It is the important aspect for the wine quality and therefore it has been considered to
understand the quality (Darias-Martin et al, 2002).
SO2 values: The analysis will focus on the effect this chemical has on the quality
determination of the wine (Bakker et al, 1998).
Alcohol content: It is also an important variable that determines the quality of the wine. Wine
is an alcoholic product and the customers’ prefer its quantity.
The further analysis is focused on analysing these three parameters together and tries to
understand the effect it has on the wine quality.
Distribution Analysis for Red Wine
From the plot given below for the red wine, it can be stated that the pH value is normally
distributed as the major portion of the collected data is from 3.0 to 3.5. The free SO2 is
between 1 and 100 and more inclined around 50. The similar is with total SO2; however it’s
spreading is from 0 to 300 and collects around 150. The alcohol is from 8 to 15 and
concentrates around 10.
Paraphrase This Document
Need a fresh take? Get an instant paraphrase of this document with our AI Paraphraser
Distribution Analysis for White Wine
From the plot given below for the white wine, it can be stated that the pH value is normally
distributed as the major portion of the collected data is from 3.0 to 3.5. The free SO2 is
between 1 and 120 and more concentrates around 50. The similar is with total SO2; however
it’s spreading is from 0 to 250 and collects around 150. The alcohol is from 7 to 14 and
concentrates around 10.
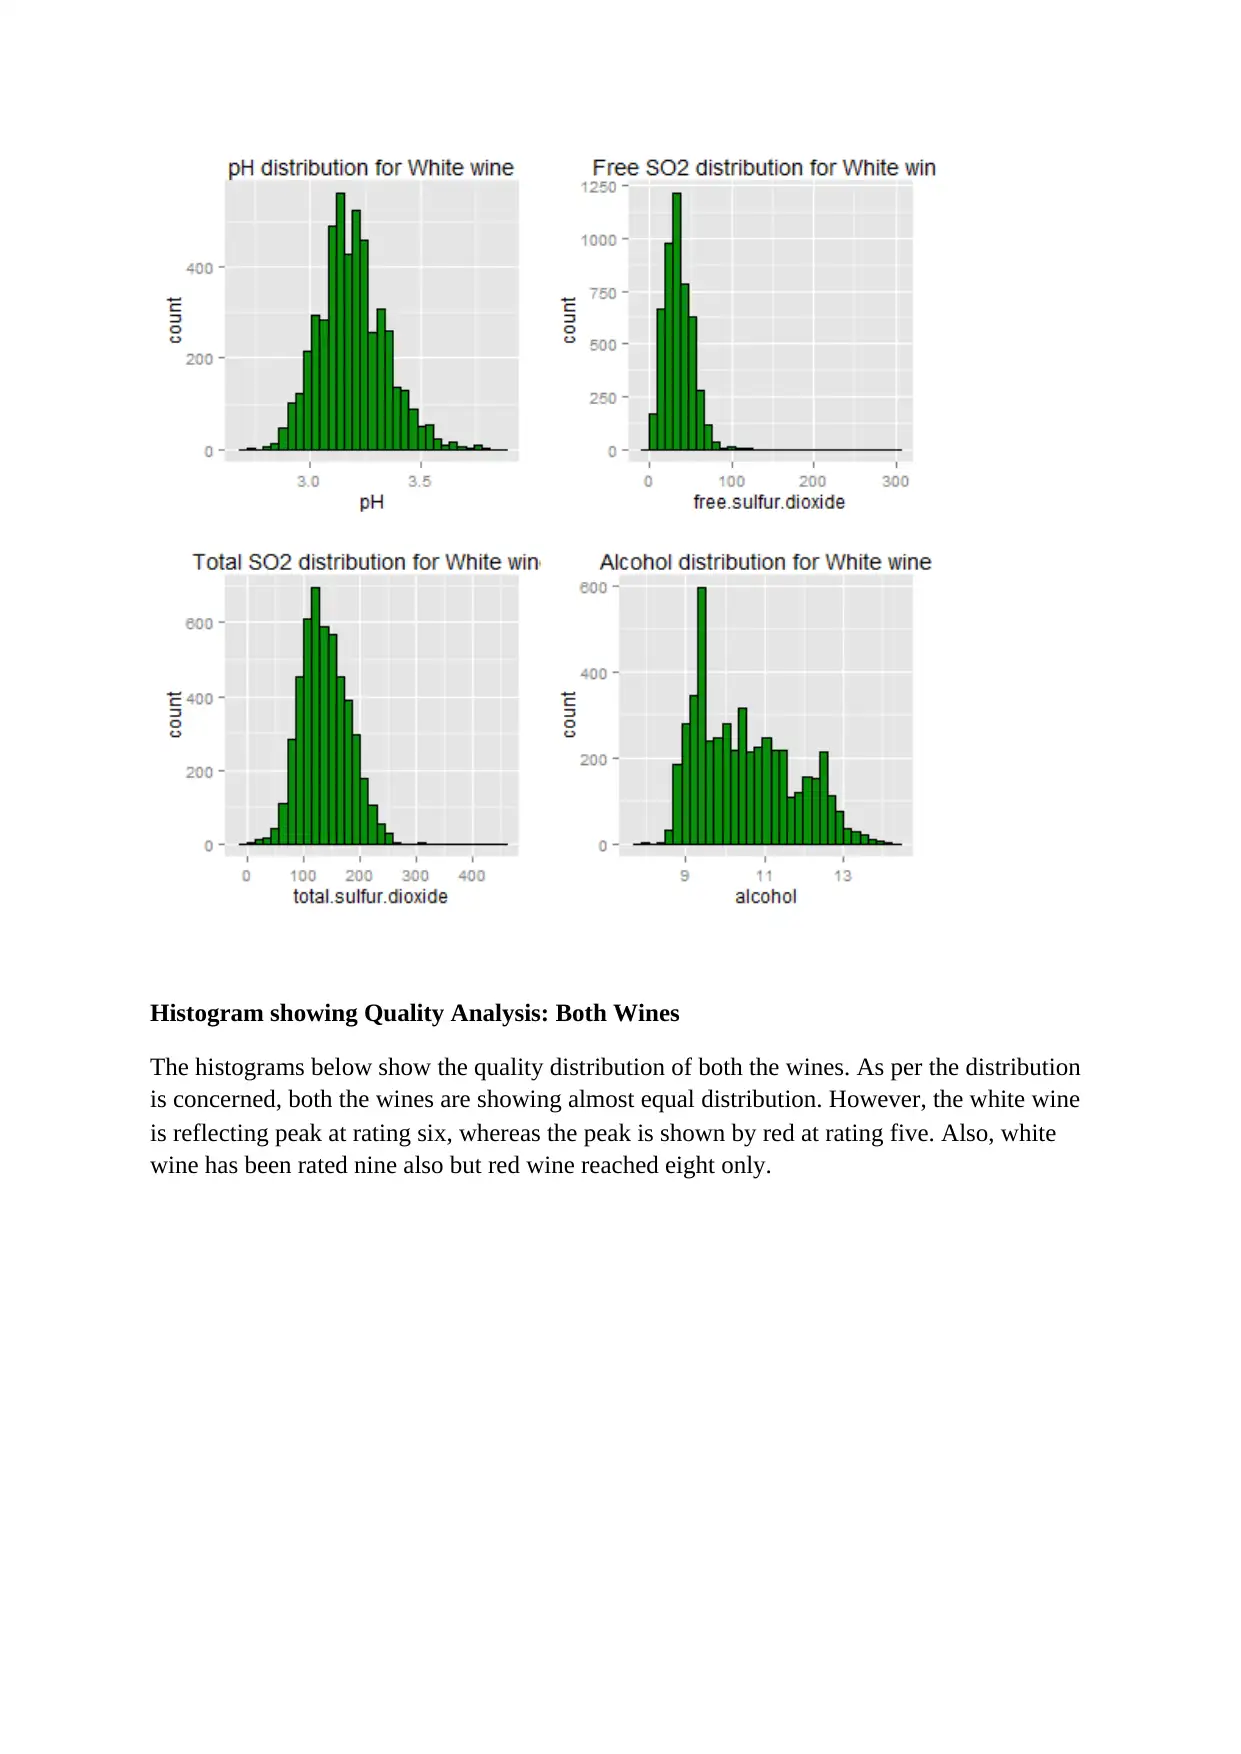
Histogram showing Quality Analysis: Both Wines
The histograms below show the quality distribution of both the wines. As per the distribution
is concerned, both the wines are showing almost equal distribution. However, the white wine
is reflecting peak at rating six, whereas the peak is shown by red at rating five. Also, white
wine has been rated nine also but red wine reached eight only.
⊘ This is a preview!⊘
Do you want full access?
Subscribe today to unlock all pages.
Trusted by 1+ million students worldwide
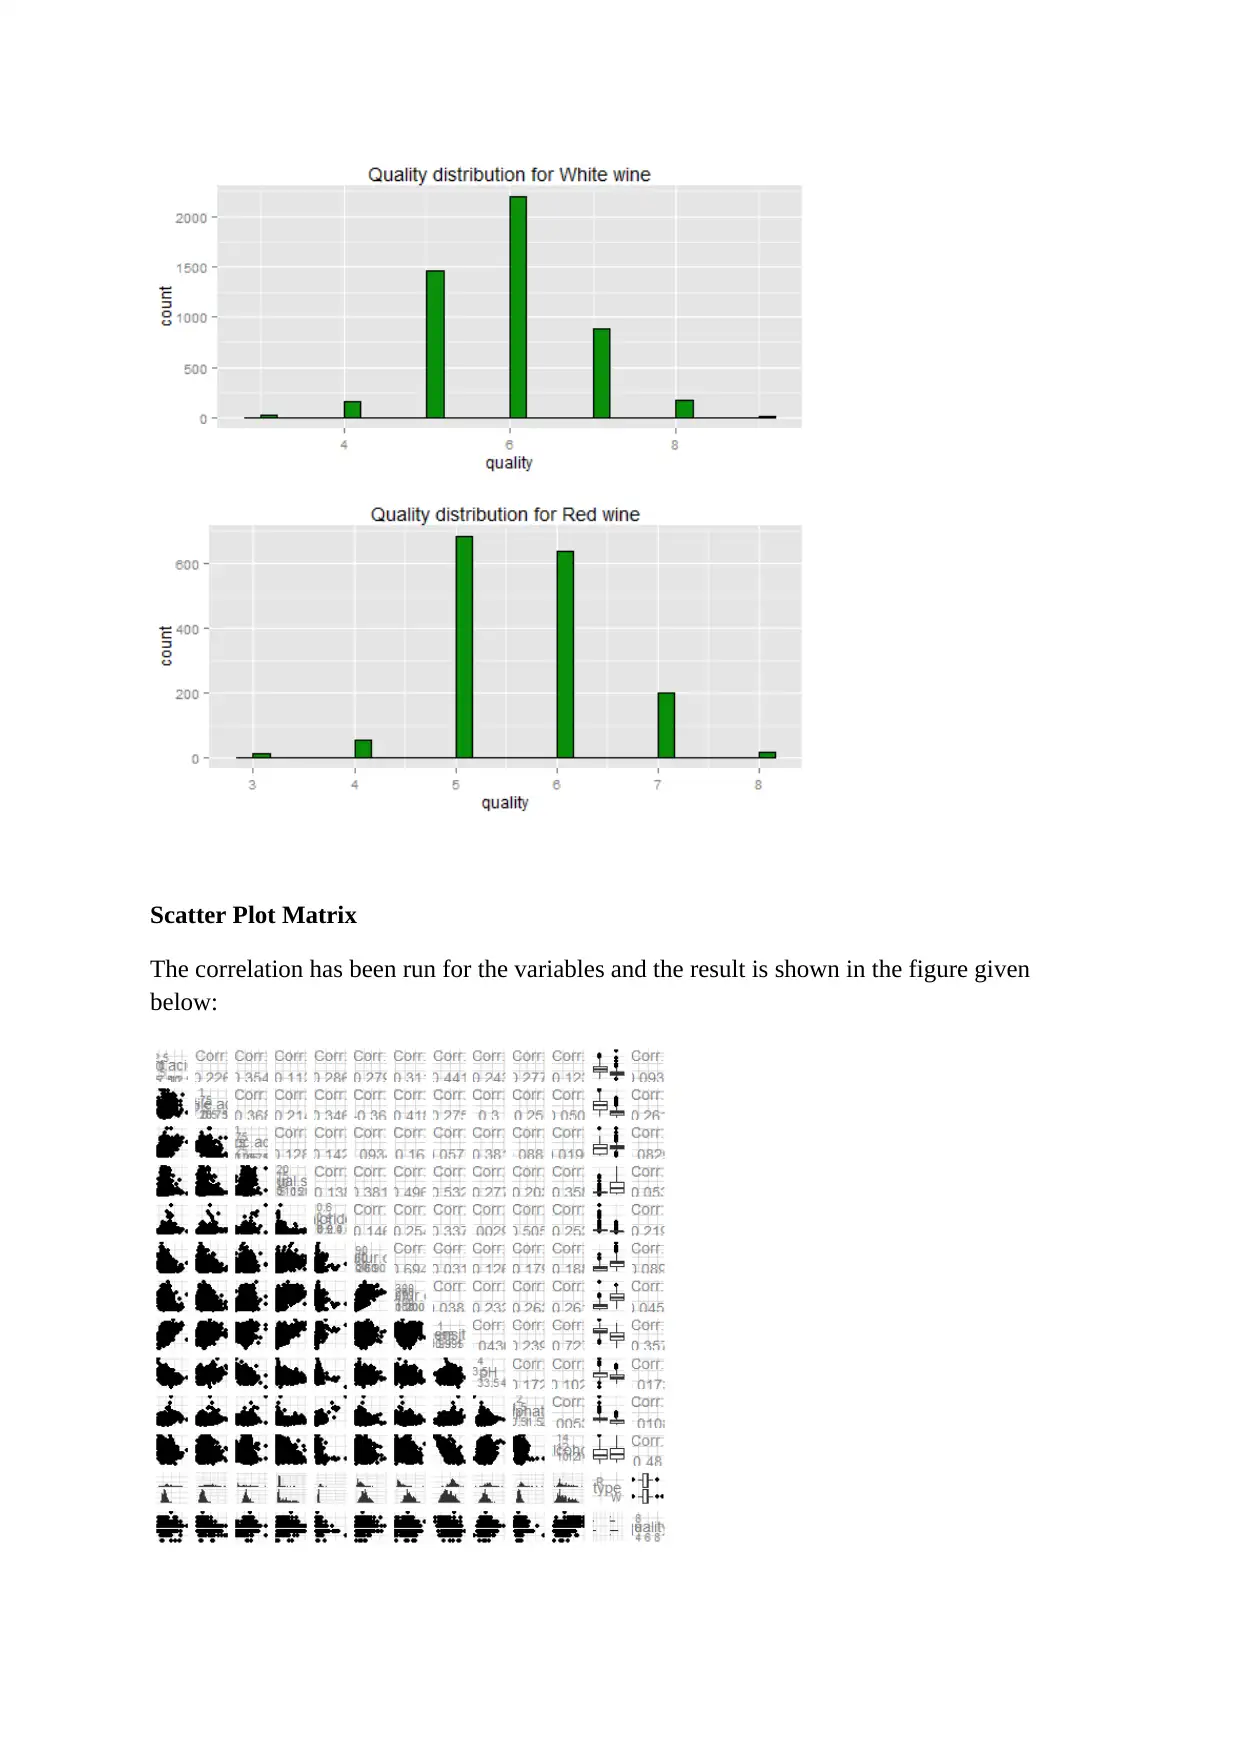
Scatter Plot Matrix
The correlation has been run for the variables and the result is shown in the figure given
below:
The correlation has been run for the variables and the result is shown in the figure given
below:
Paraphrase This Document
Need a fresh take? Get an instant paraphrase of this document with our AI Paraphraser
The scatter plot matrix shows that the Free SO2 has the positive relationship with the Total
Sulphate Oxide. On the other hand, Free SO2 shows negative relationship with the pH and
Alcohol. The Total SO2 shows the positive relationship with the Free SO2. The positive
relationship is shown between the pH and Alcohol. The Alcohol shows positive relationship
with the pH. The Quality shows positive relationship with the alcohol. However, it shows
negative relationship with the chlorine presence and the acidity.
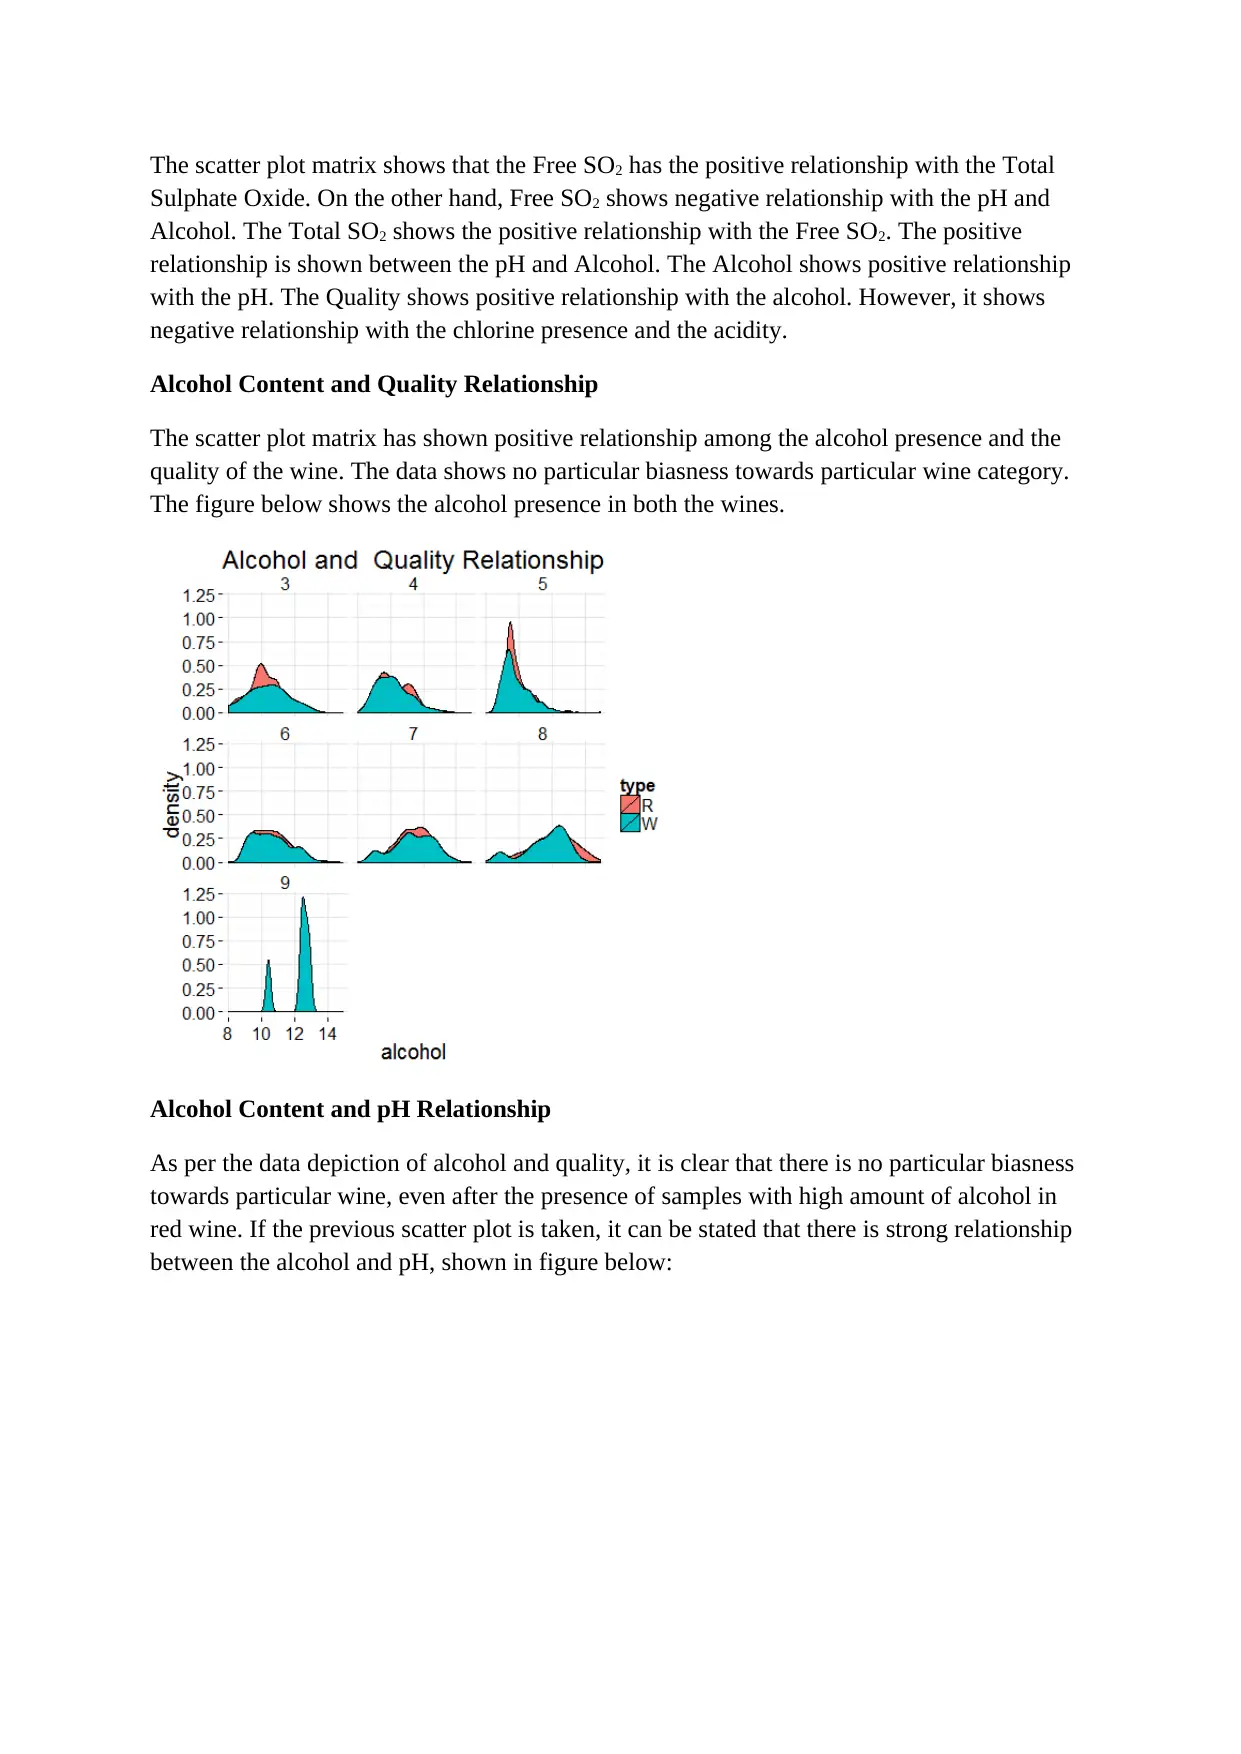
Alcohol Content and Quality Relationship
The scatter plot matrix has shown positive relationship among the alcohol presence and the
quality of the wine. The data shows no particular biasness towards particular wine category.
The figure below shows the alcohol presence in both the wines.
Alcohol Content and pH Relationship
As per the data depiction of alcohol and quality, it is clear that there is no particular biasness
towards particular wine, even after the presence of samples with high amount of alcohol in
red wine. If the previous scatter plot is taken, it can be stated that there is strong relationship
between the alcohol and pH, shown in figure below:
Sulphate Oxide. On the other hand, Free SO2 shows negative relationship with the pH and
Alcohol. The Total SO2 shows the positive relationship with the Free SO2. The positive
relationship is shown between the pH and Alcohol. The Alcohol shows positive relationship
with the pH. The Quality shows positive relationship with the alcohol. However, it shows
negative relationship with the chlorine presence and the acidity.
Alcohol Content and Quality Relationship
The scatter plot matrix has shown positive relationship among the alcohol presence and the
quality of the wine. The data shows no particular biasness towards particular wine category.
The figure below shows the alcohol presence in both the wines.
Alcohol Content and pH Relationship
As per the data depiction of alcohol and quality, it is clear that there is no particular biasness
towards particular wine, even after the presence of samples with high amount of alcohol in
red wine. If the previous scatter plot is taken, it can be stated that there is strong relationship
between the alcohol and pH, shown in figure below:
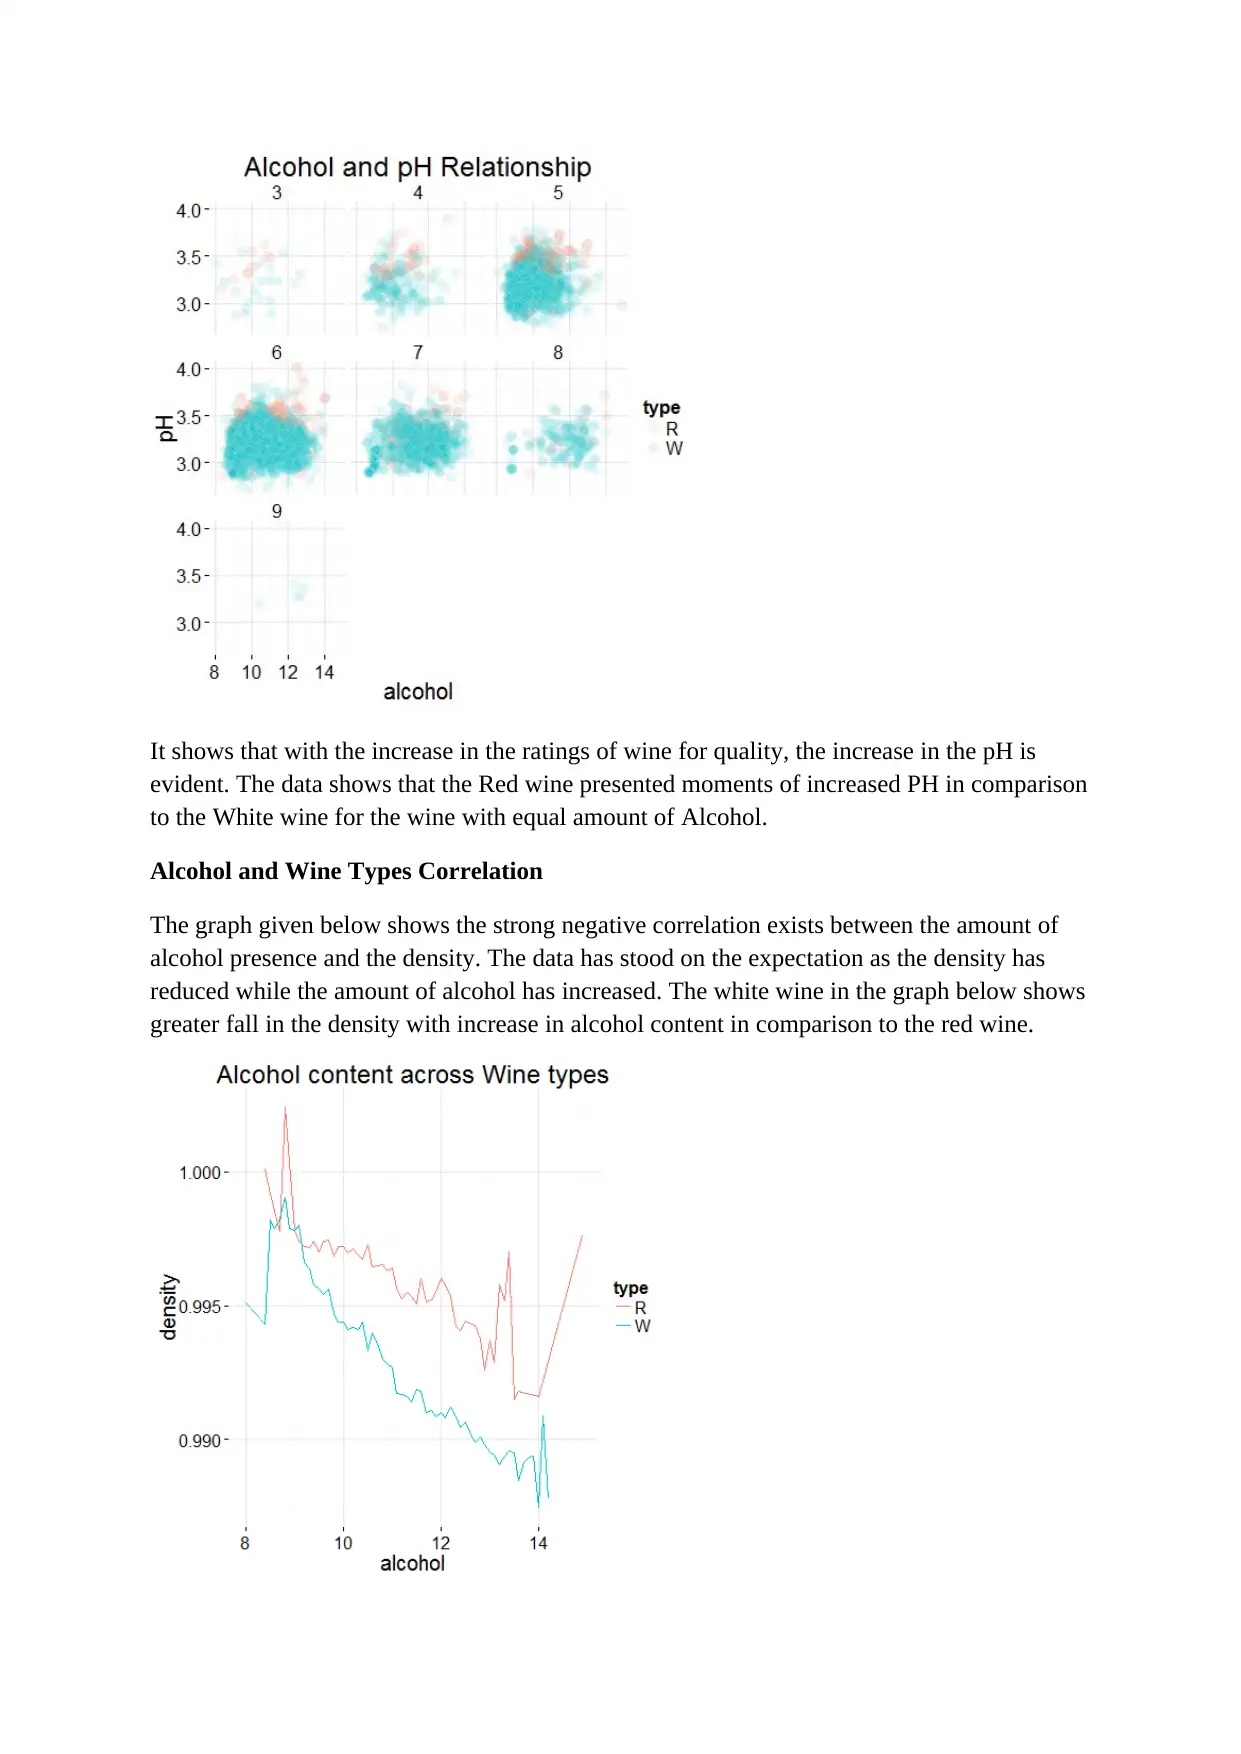
It shows that with the increase in the ratings of wine for quality, the increase in the pH is
evident. The data shows that the Red wine presented moments of increased PH in comparison
to the White wine for the wine with equal amount of Alcohol.
Alcohol and Wine Types Correlation
The graph given below shows the strong negative correlation exists between the amount of
alcohol presence and the density. The data has stood on the expectation as the density has
reduced while the amount of alcohol has increased. The white wine in the graph below shows
greater fall in the density with increase in alcohol content in comparison to the red wine.
⊘ This is a preview!⊘
Do you want full access?
Subscribe today to unlock all pages.
Trusted by 1+ million students worldwide
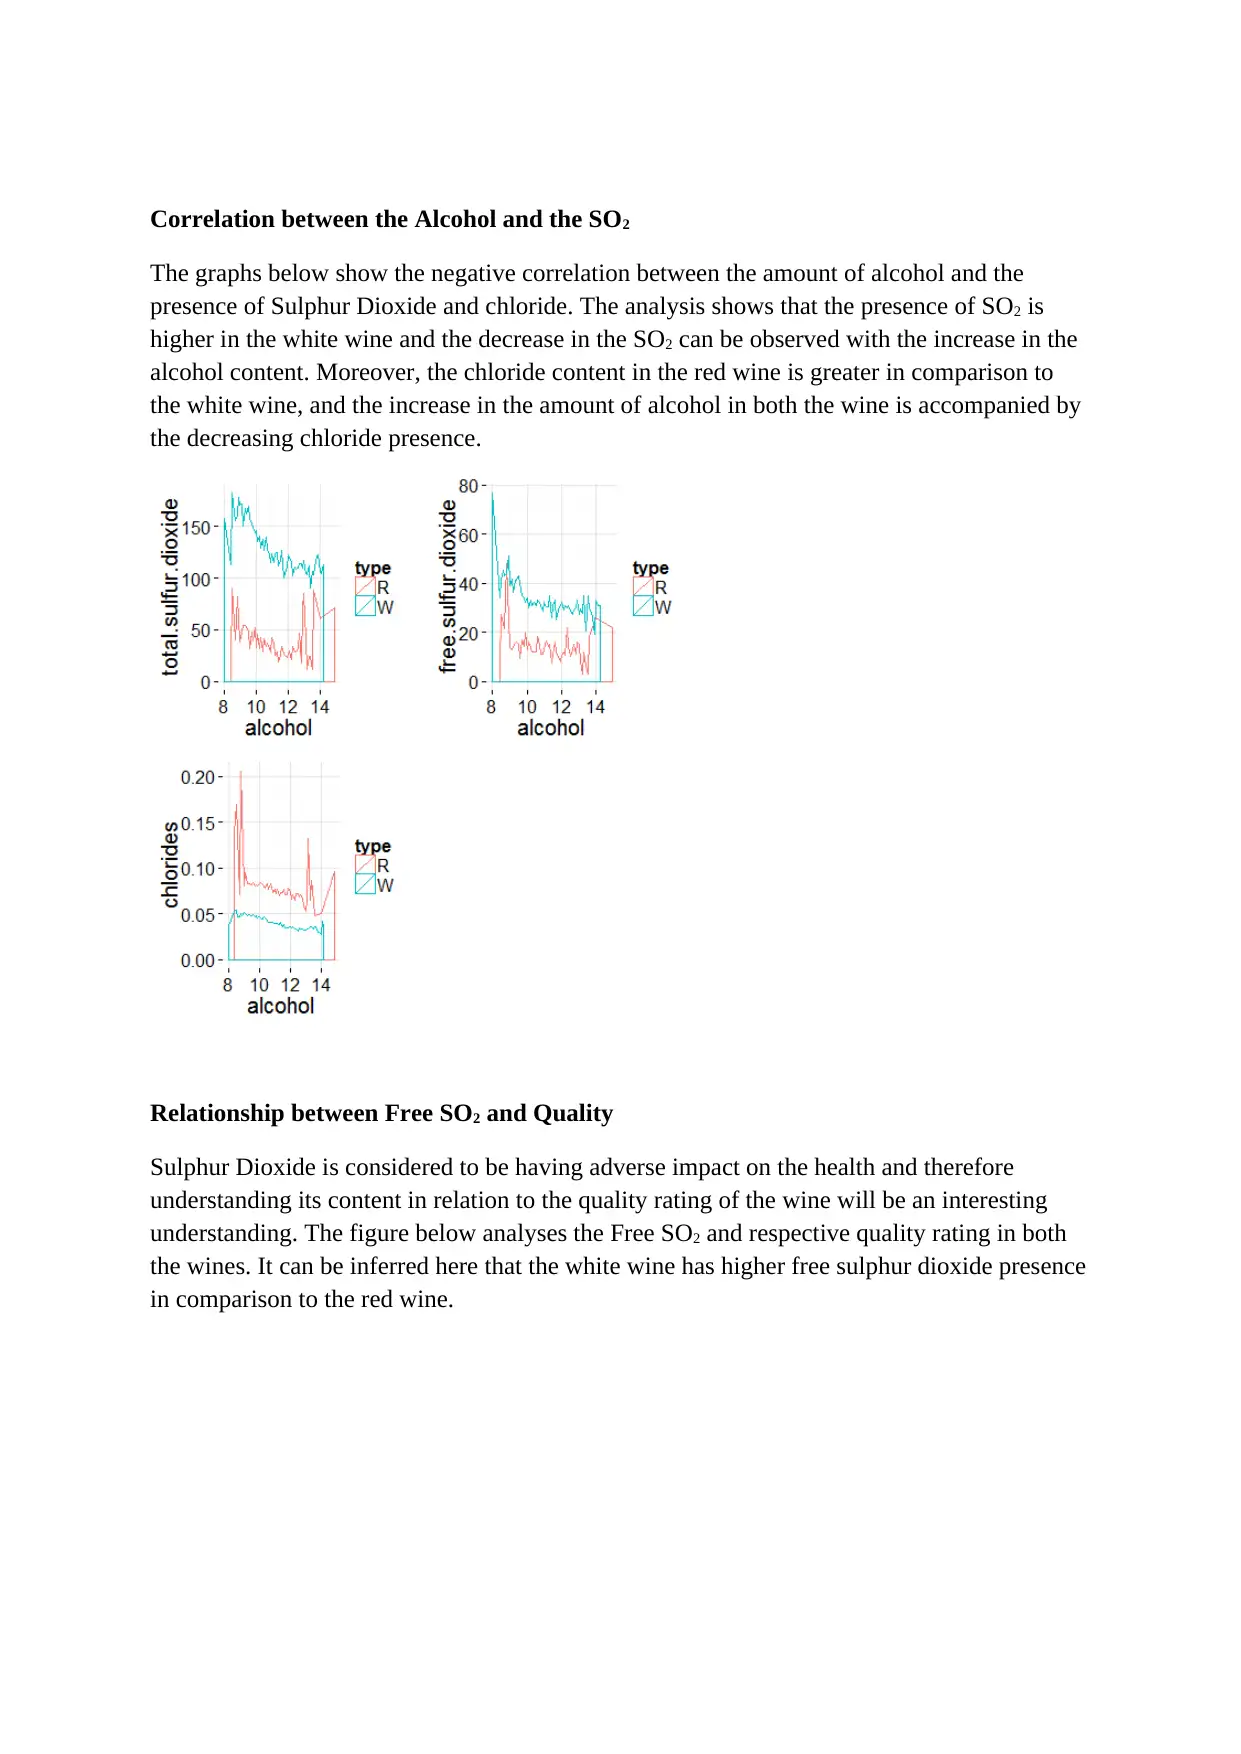
Correlation between the Alcohol and the SO2
The graphs below show the negative correlation between the amount of alcohol and the
presence of Sulphur Dioxide and chloride. The analysis shows that the presence of SO2 is
higher in the white wine and the decrease in the SO2 can be observed with the increase in the
alcohol content. Moreover, the chloride content in the red wine is greater in comparison to
the white wine, and the increase in the amount of alcohol in both the wine is accompanied by
the decreasing chloride presence.
Relationship between Free SO2 and Quality
Sulphur Dioxide is considered to be having adverse impact on the health and therefore
understanding its content in relation to the quality rating of the wine will be an interesting
understanding. The figure below analyses the Free SO2 and respective quality rating in both
the wines. It can be inferred here that the white wine has higher free sulphur dioxide presence
in comparison to the red wine.
Paraphrase This Document
Need a fresh take? Get an instant paraphrase of this document with our AI Paraphraser
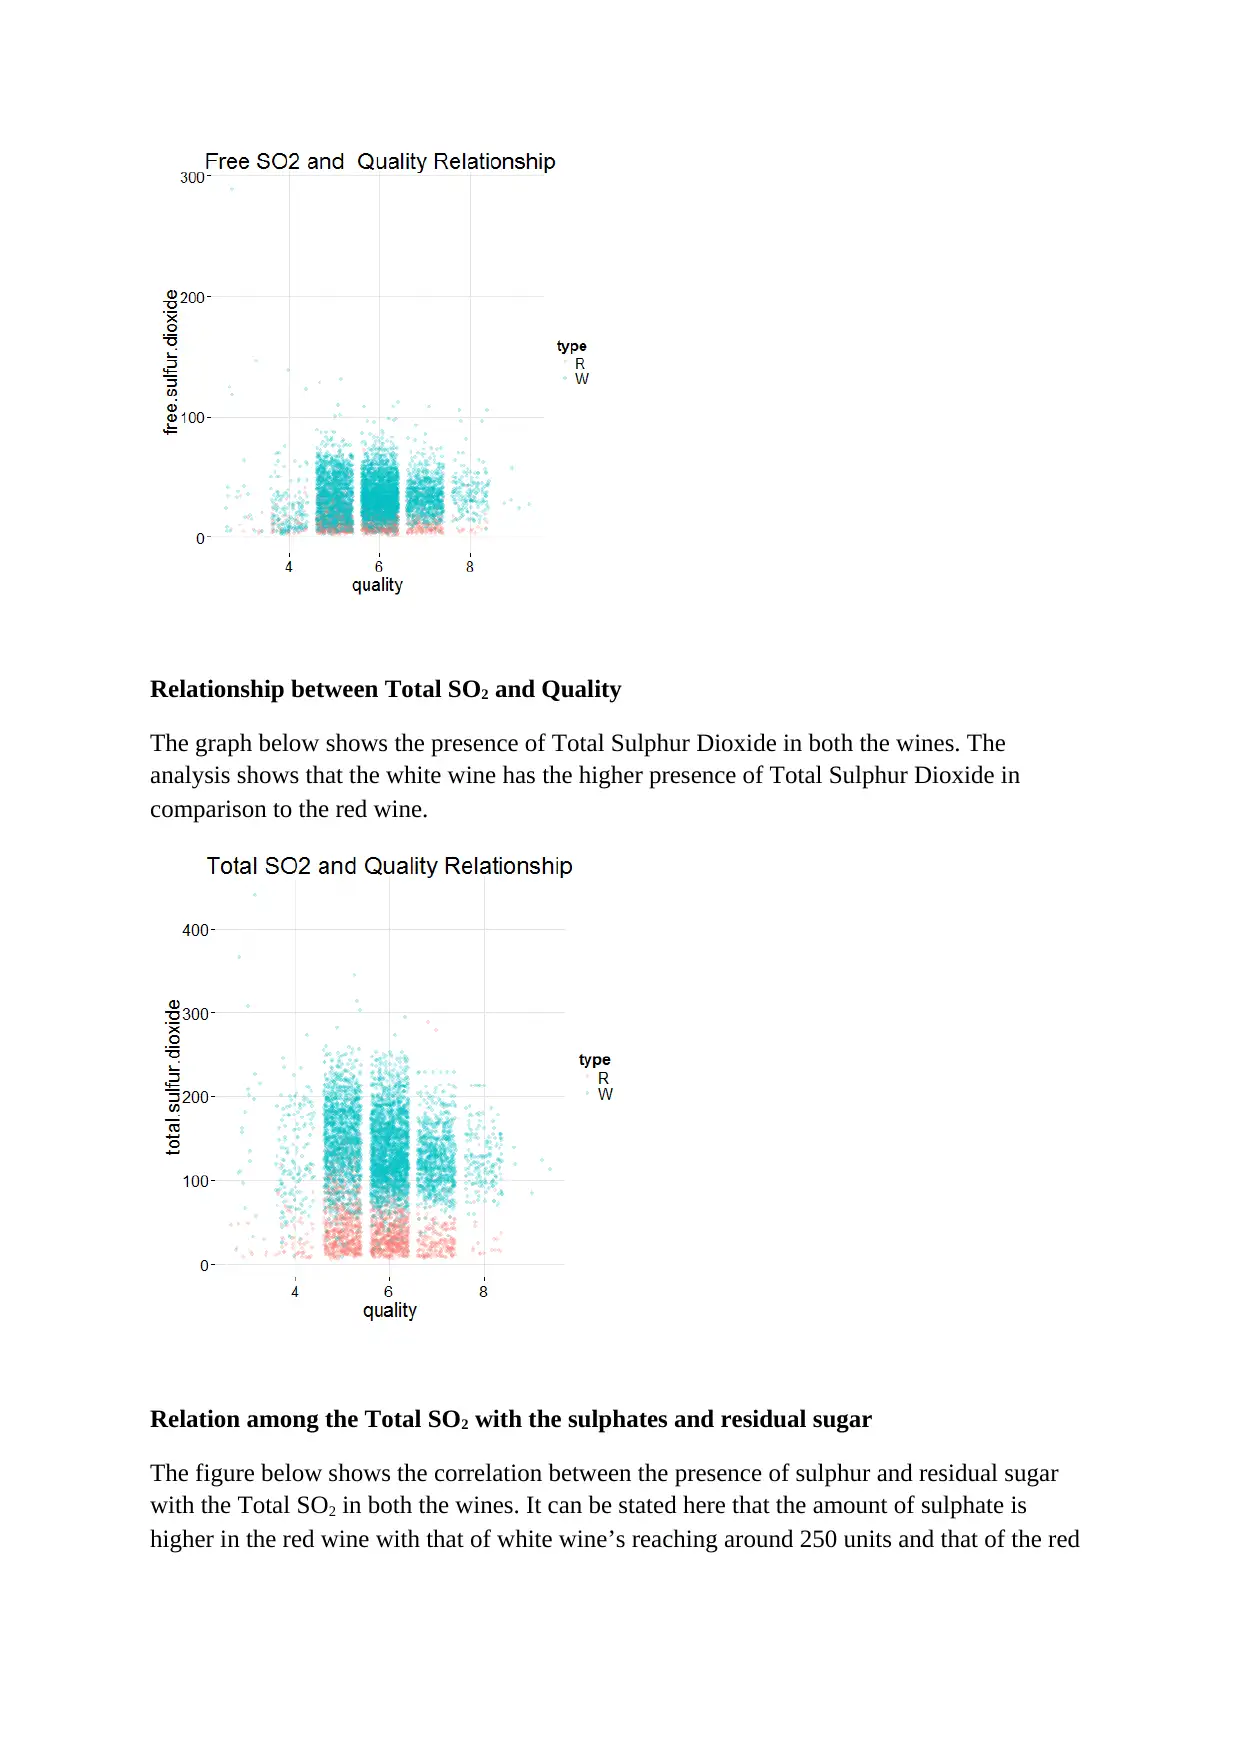
Relationship between Total SO2 and Quality
The graph below shows the presence of Total Sulphur Dioxide in both the wines. The
analysis shows that the white wine has the higher presence of Total Sulphur Dioxide in
comparison to the red wine.
Relation among the Total SO2 with the sulphates and residual sugar
The figure below shows the correlation between the presence of sulphur and residual sugar
with the Total SO2 in both the wines. It can be stated here that the amount of sulphate is
higher in the red wine with that of white wine’s reaching around 250 units and that of the red
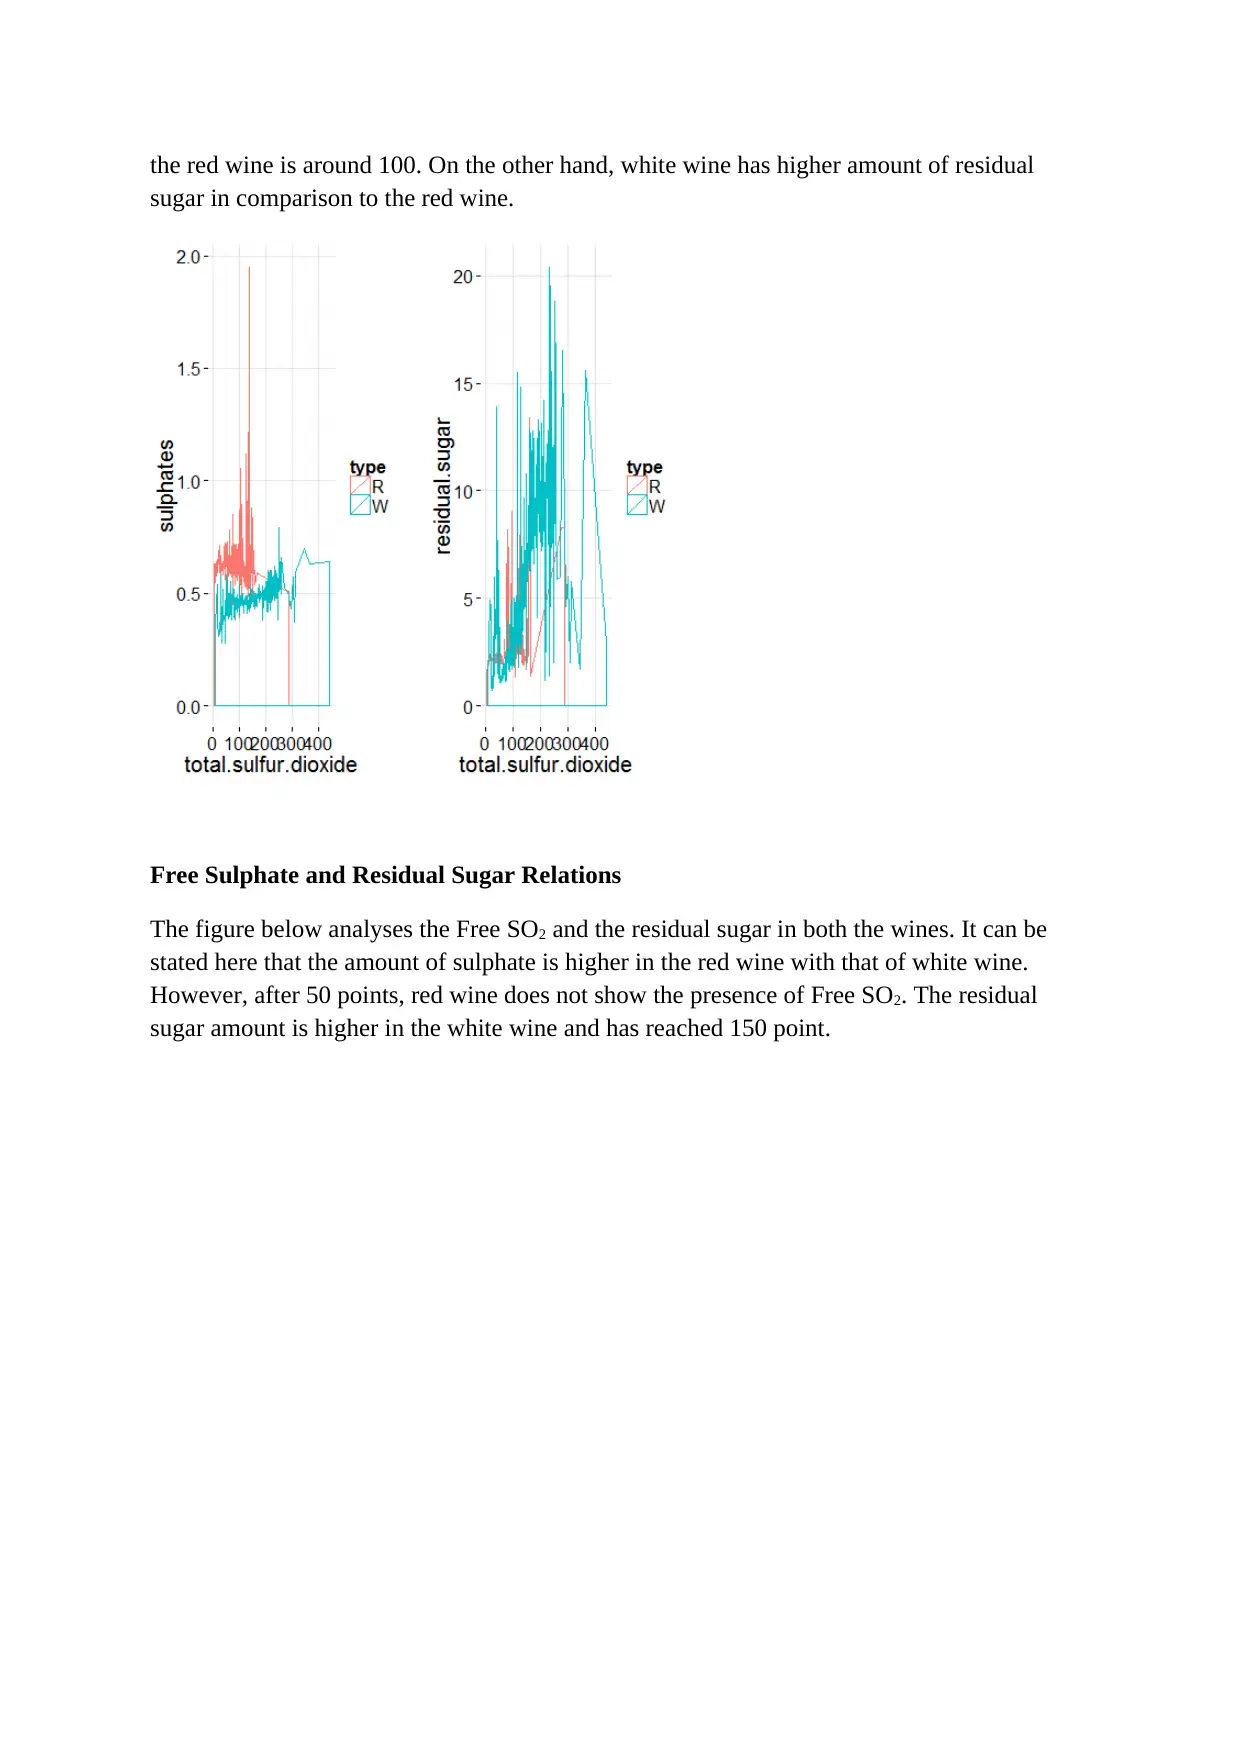
the red wine is around 100. On the other hand, white wine has higher amount of residual
sugar in comparison to the red wine.
Free Sulphate and Residual Sugar Relations
The figure below analyses the Free SO2 and the residual sugar in both the wines. It can be
stated here that the amount of sulphate is higher in the red wine with that of white wine.
However, after 50 points, red wine does not show the presence of Free SO2. The residual
sugar amount is higher in the white wine and has reached 150 point.
⊘ This is a preview!⊘
Do you want full access?
Subscribe today to unlock all pages.
Trusted by 1+ million students worldwide
1 out of 18


Your All-in-One AI-Powered Toolkit for Academic Success.
+13062052269
info@desklib.com
Available 24*7 on WhatsApp / Email
![[object Object]](/_next/static/media/star-bottom.7253800d.svg)
Unlock your academic potential
Copyright © 2020–2026 A2Z Services. All Rights Reserved. Developed and managed by ZUCOL.