Business Intelligence Report: Visual DSS and Power BI Applications

Verified

Added on  2023/06/13

|11
|1116
|453
Report
AI Summary
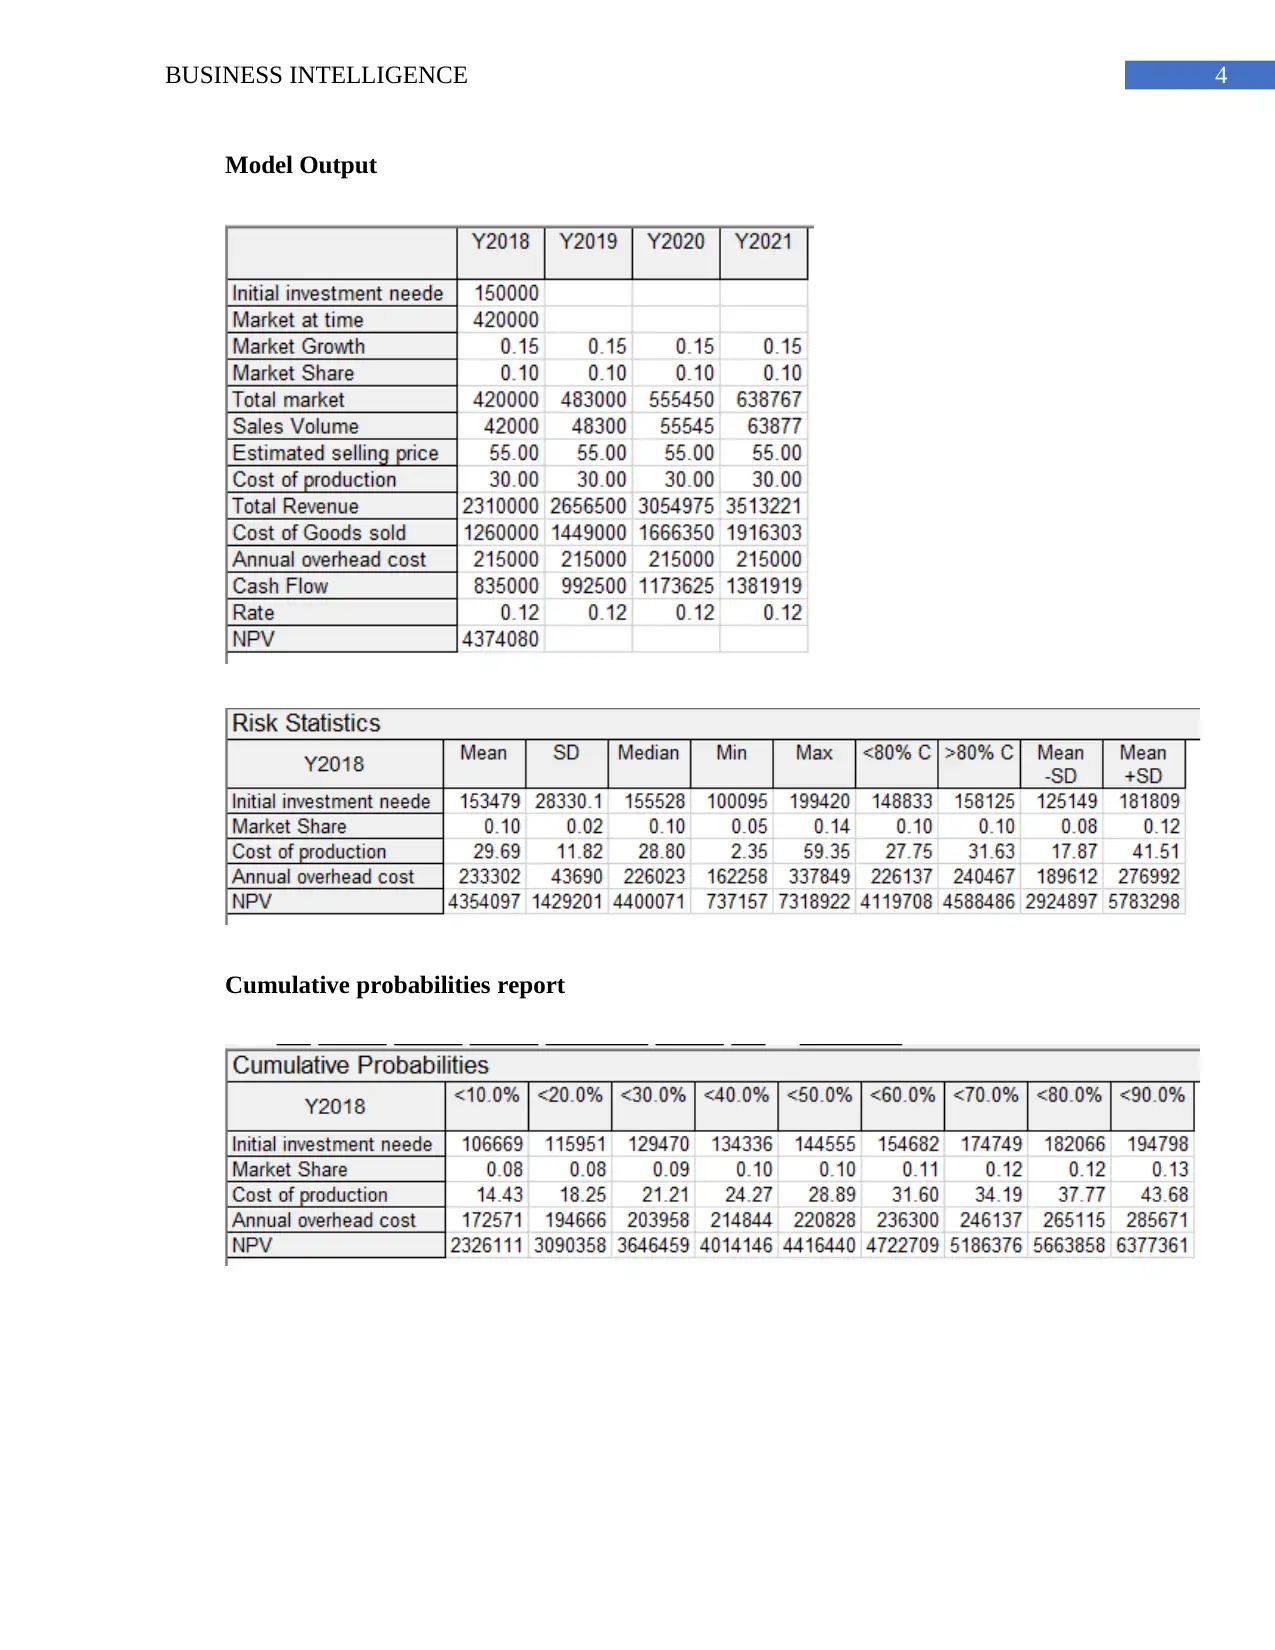
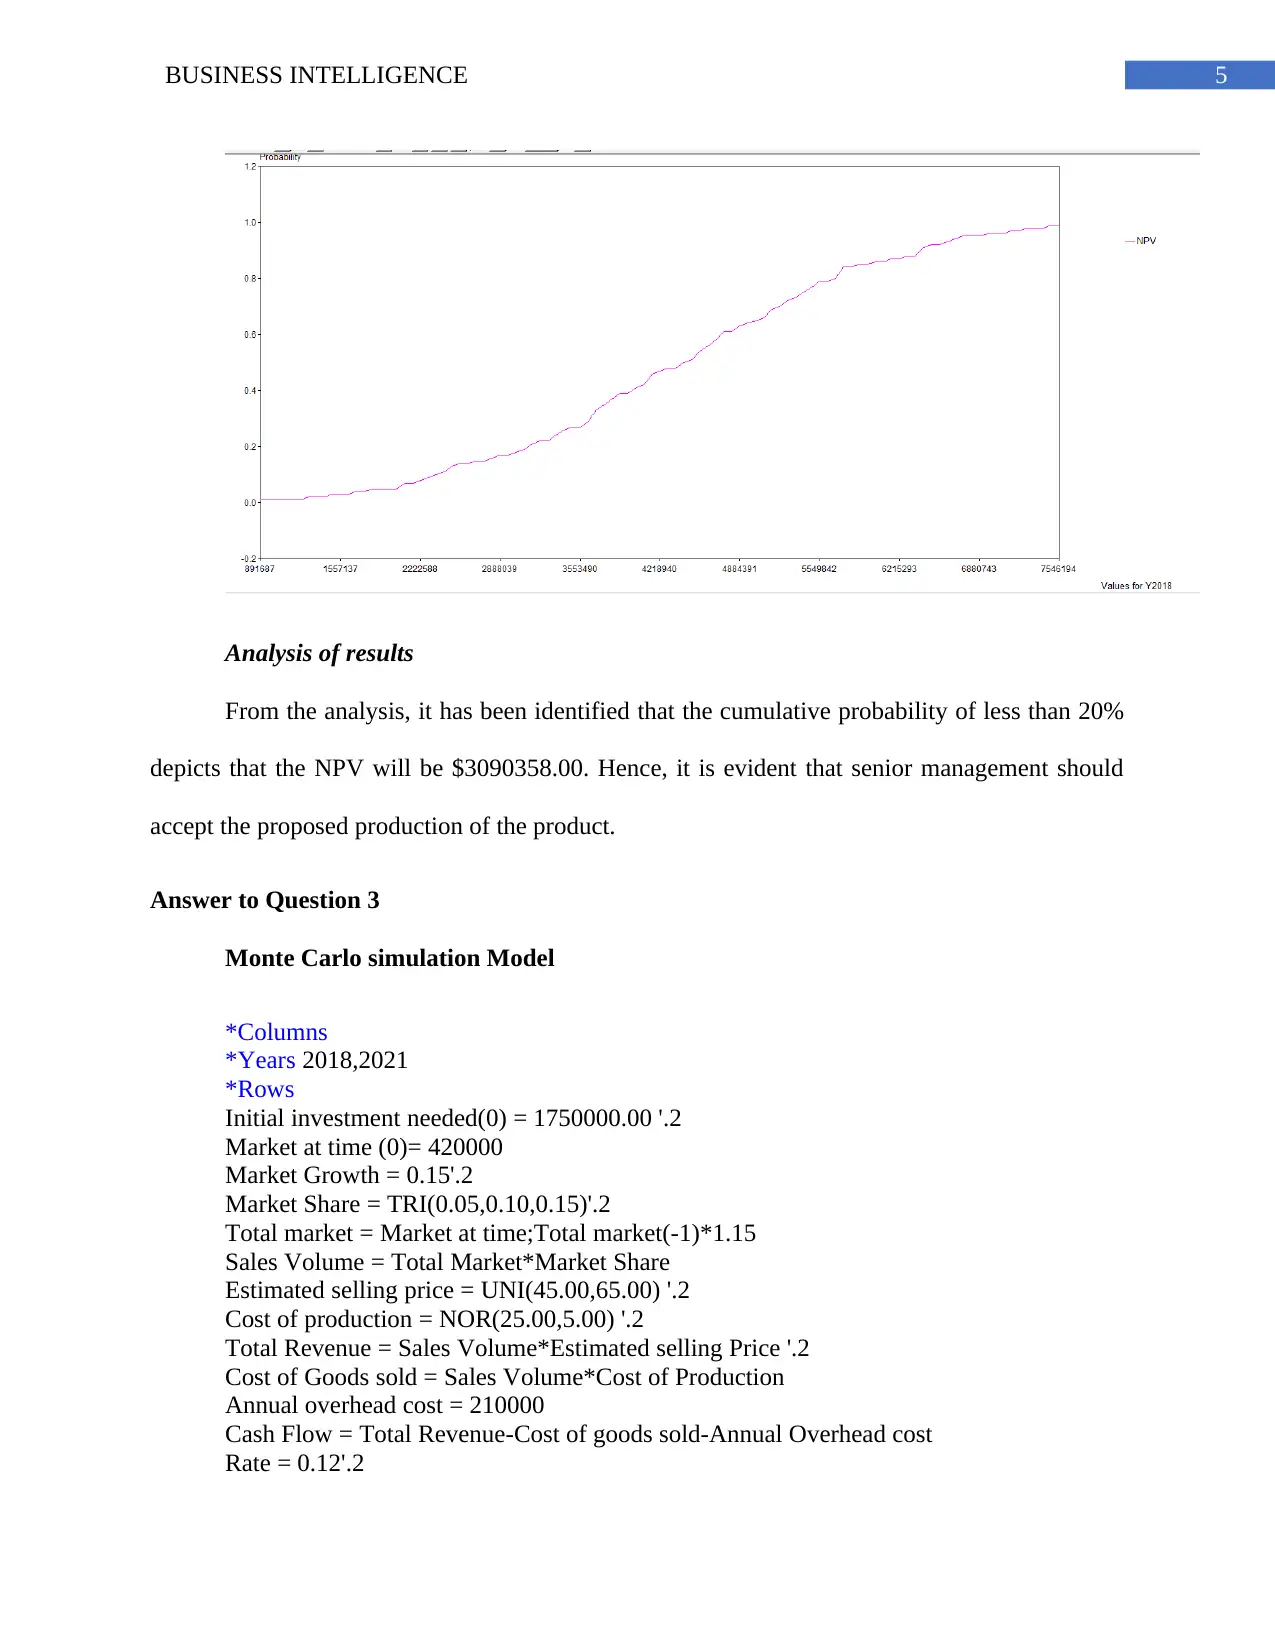
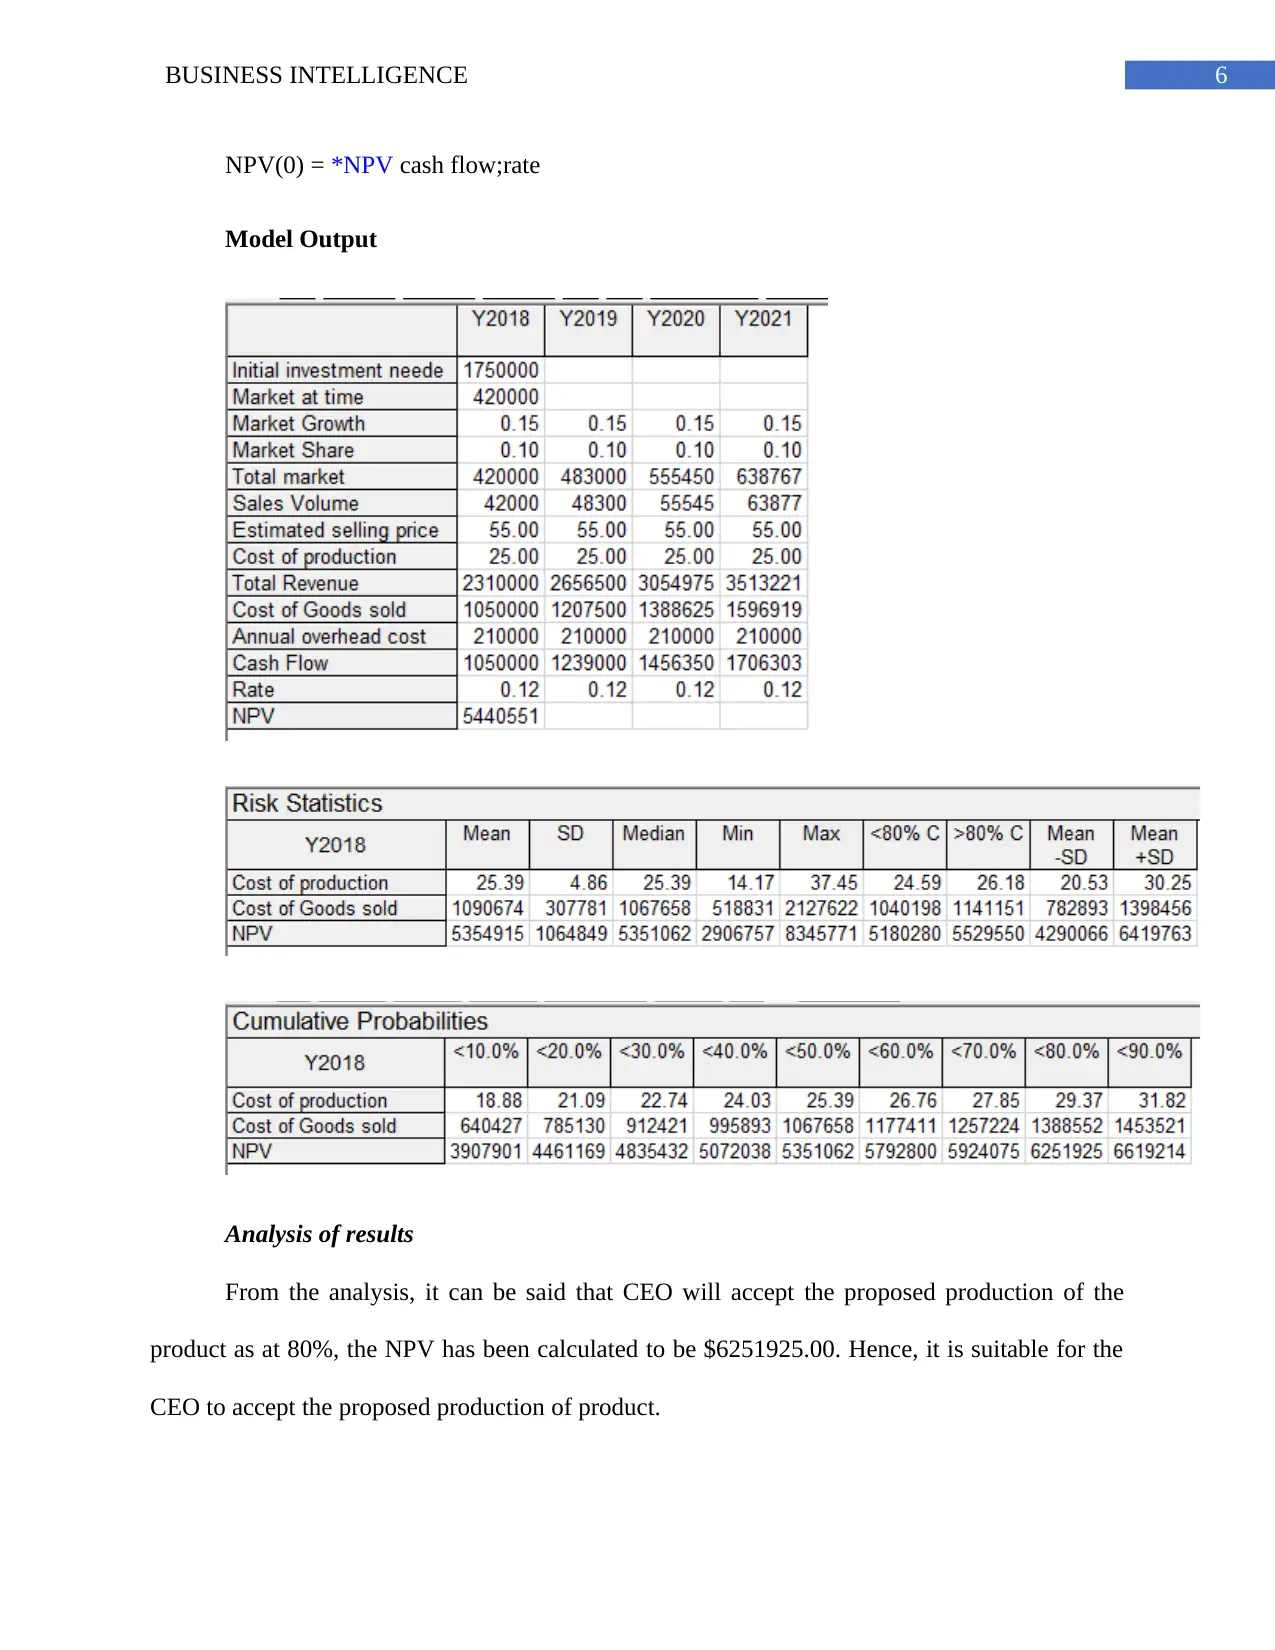
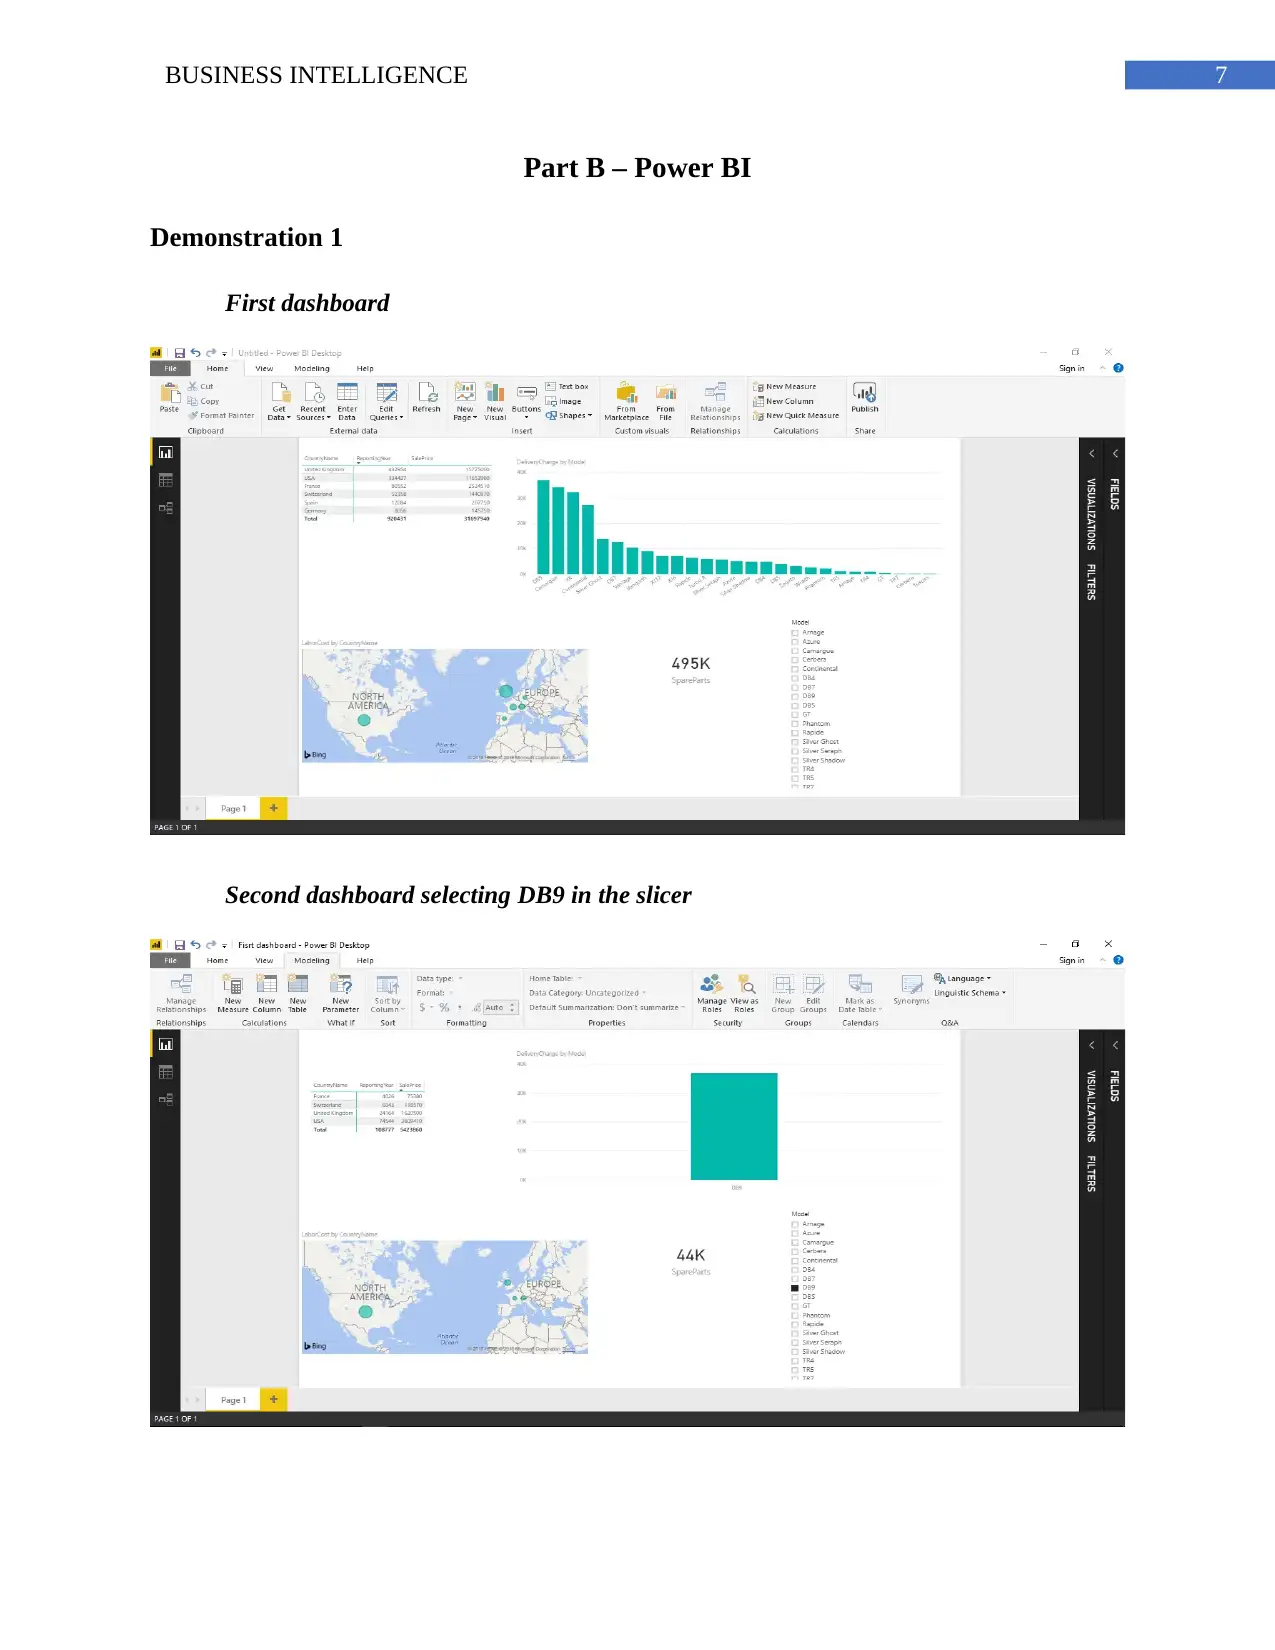
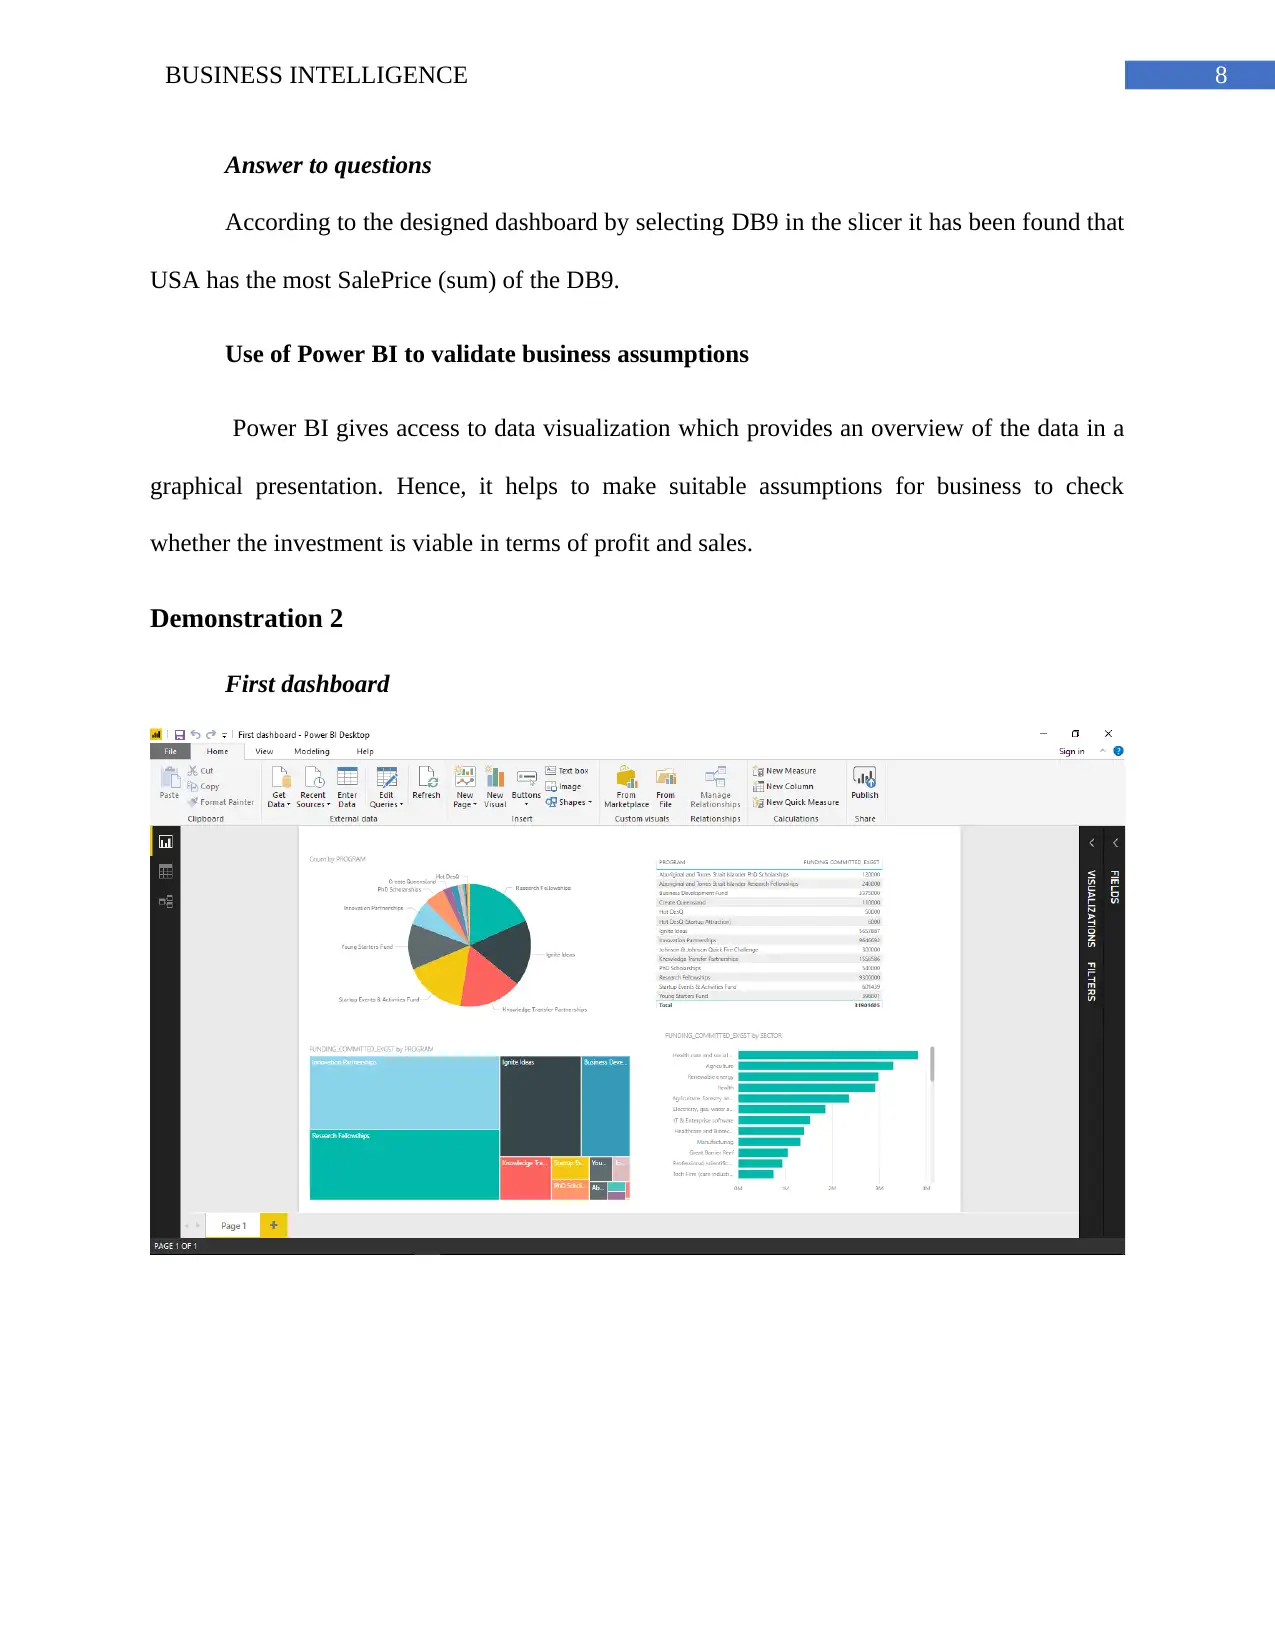
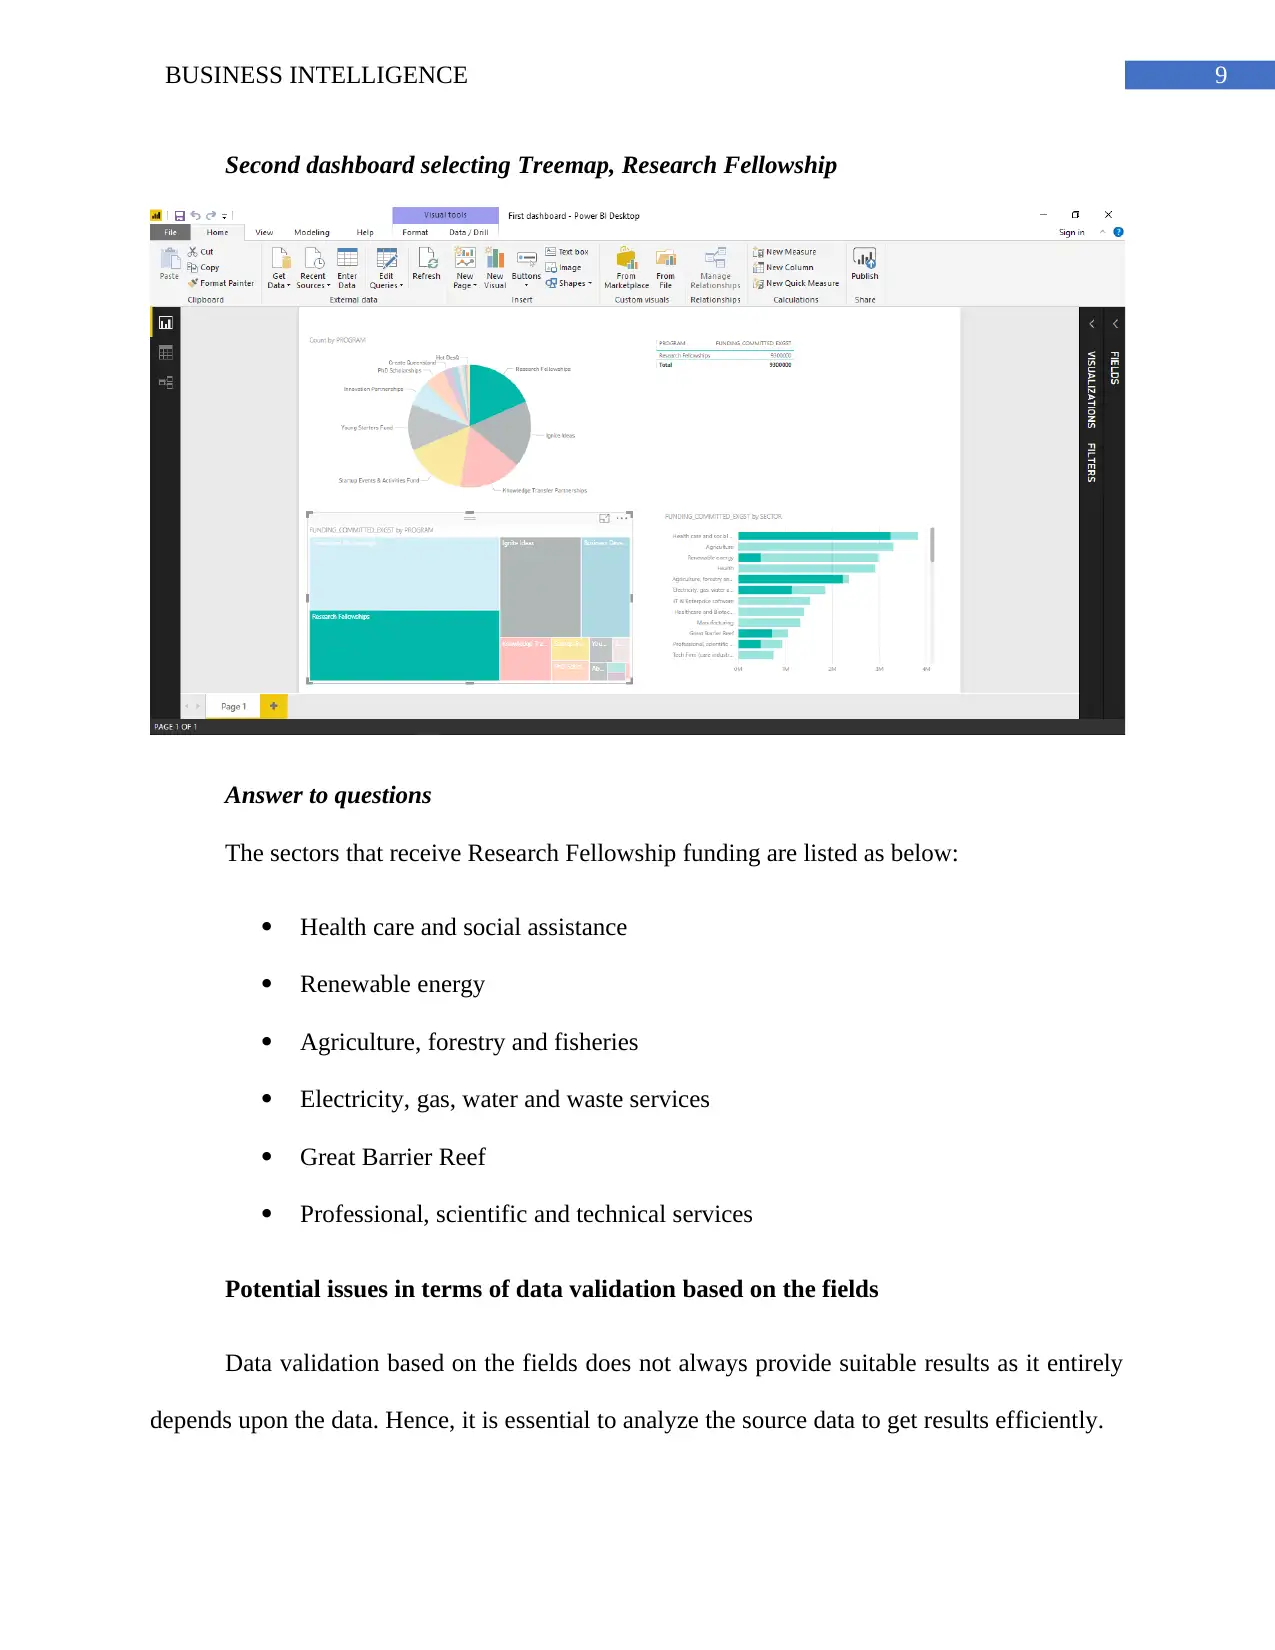
This assignment solution demonstrates the application of Visual DSS and Power BI for business intelligence. Part A involves using Visual DSS to perform NPV analysis and Monte Carlo simulations to evaluate the feasibility of a new cloud-based software application, assessing the potential for senior management to make informed decisions. Part B utilizes Power BI to create interactive dashboards for data visualization, validating business assumptions through graphical presentations and analyzing sectors receiving research fellowship funding. The analysis highlights the importance of data validation and the potential issues arising from relying solely on field data, emphasizing the need for thorough source data analysis to achieve efficient and reliable results. Desklib offers a wealth of similar solved assignments and past papers for students.
Document Page
Running head: BUSINESS INTELLIGENCE
Business Intelligence
Assessment item 1 – Assignment 1
Student Name:
University Name:
tabler-icon-diamond-filled.svg

Secure Best Marks with AI Grader

Need help grading? Try our AI Grader for instant feedback on your assignments.
Document Page
1BUSINESS INTELLIGENCE
Table of Contents
Part A – Visual DSS........................................................................................................................2
Answer to Question 1..................................................................................................................2
Analysis of results....................................................................................................................3
Answer to Question 2..................................................................................................................3
Analysis of results....................................................................................................................5
Answer to Question 3..................................................................................................................5
Analysis of results....................................................................................................................6
Part B – Power BI............................................................................................................................7
Demonstration 1...........................................................................................................................7
First dashboard.........................................................................................................................7
Second dashboard selecting DB9 in the slicer.........................................................................7
Answer to questions.................................................................................................................8
Demonstration 2...........................................................................................................................8
First dashboard.........................................................................................................................8
Second dashboard selecting Treemap, Research Fellowship..................................................9
Answer to questions.................................................................................................................9
Bibliography..................................................................................................................................10
Document Page
2BUSINESS INTELLIGENCE
Part A – Visual DSS
Answer to Question 1
NPV model
*Columns
*Years 2018,2021
*Rows
Initial investment needed(0) = 1750000.00 '.2
Market at time (0)= 420000
Market Growth = 0.15'.2
Market Share = 0.10'.2
Total market = Market at time;Total market(-1)*1.15
Sales Volume = Total Market*Market Share
Estimated selling price = 55.00 '.2
Cost of production = 25.00 '.2
Total Revenue = Sales Volume*Estimated selling Price '.2
Cost of Goods sold = Sales Volume*Cost of Production
Annual overhead cost = 210000
Cash Flow = Total Revenue-Cost of goods sold-Annual Overhead cost
Rate = 0.12'.2
NPV(0) = *NPV cash flow;rate
Model Output
Document Page
3BUSINESS INTELLIGENCE
Analysis of results
Based on the result of the model, the net present value (NPV) is $5440551.00. The claim
regarding the NPV is correct as in the developed model, the NPV has been calculated for the first
period that is 2018 and it is essential for decision making. The initial investment needed is
$1,750,000 and the claim that has been made for the new product line is over $2 million so from
the calculated NPV it has been found that the claim is correct.
Answer to Question 2
Monte Carlo Simulation Model
*Columns
*Years 2018,2021
*Rows
Initial investment needed(0) = UNI(100000.00,200000.00) '.2
Market at time (0)= 420000
Market Growth = 0.15'.2
Market Share = TRI(0.05,0.10,0.15)'.2
Total market = Market at time;Total market(-1)*1.15
Sales Volume = Total Market*Market Share
Estimated selling price = 55.00 '.2
Cost of production = NOR(30.00,12.00) '.2
Total Revenue = Sales Volume*Estimated selling Price '.2
Cost of Goods sold = Sales Volume*Cost of Production
Annual overhead cost = TRI(150000,215000,350000)
Cash Flow = Total Revenue-Cost of goods sold-Annual Overhead cost
Rate = 0.12'.2
NPV(0) = *NPV cash flow;rate
tabler-icon-diamond-filled.svg

Secure Best Marks with AI Grader

Need help grading? Try our AI Grader for instant feedback on your assignments.
Document Page
4BUSINESS INTELLIGENCE
Model Output
Cumulative probabilities report
Document Page
5BUSINESS INTELLIGENCE
Analysis of results
From the analysis, it has been identified that the cumulative probability of less than 20%
depicts that the NPV will be $3090358.00. Hence, it is evident that senior management should
accept the proposed production of the product.
Answer to Question 3
Monte Carlo simulation Model
*Columns
*Years 2018,2021
*Rows
Initial investment needed(0) = 1750000.00 '.2
Market at time (0)= 420000
Market Growth = 0.15'.2
Market Share = TRI(0.05,0.10,0.15)'.2
Total market = Market at time;Total market(-1)*1.15
Sales Volume = Total Market*Market Share
Estimated selling price = UNI(45.00,65.00) '.2
Cost of production = NOR(25.00,5.00) '.2
Total Revenue = Sales Volume*Estimated selling Price '.2
Cost of Goods sold = Sales Volume*Cost of Production
Annual overhead cost = 210000
Cash Flow = Total Revenue-Cost of goods sold-Annual Overhead cost
Rate = 0.12'.2
Document Page
6BUSINESS INTELLIGENCE
NPV(0) = *NPV cash flow;rate
Model Output
Analysis of results
From the analysis, it can be said that CEO will accept the proposed production of the
product as at 80%, the NPV has been calculated to be $6251925.00. Hence, it is suitable for the
CEO to accept the proposed production of product.
tabler-icon-diamond-filled.svg

Paraphrase This Document

Need a fresh take? Get an instant paraphrase of this document with our AI Paraphraser
Document Page
7BUSINESS INTELLIGENCE
Part B – Power BI
Demonstration 1
First dashboard
Second dashboard selecting DB9 in the slicer
Document Page
8BUSINESS INTELLIGENCE
Answer to questions
According to the designed dashboard by selecting DB9 in the slicer it has been found that
USA has the most SalePrice (sum) of the DB9.
Use of Power BI to validate business assumptions
Power BI gives access to data visualization which provides an overview of the data in a
graphical presentation. Hence, it helps to make suitable assumptions for business to check
whether the investment is viable in terms of profit and sales.
Demonstration 2
First dashboard
Document Page
9BUSINESS INTELLIGENCE
Second dashboard selecting Treemap, Research Fellowship
Answer to questions
The sectors that receive Research Fellowship funding are listed as below:
Health care and social assistance
Renewable energy
Agriculture, forestry and fisheries
Electricity, gas, water and waste services
Great Barrier Reef
Professional, scientific and technical services
Potential issues in terms of data validation based on the fields
Data validation based on the fields does not always provide suitable results as it entirely
depends upon the data. Hence, it is essential to analyze the source data to get results efficiently.
tabler-icon-diamond-filled.svg

Secure Best Marks with AI Grader

Need help grading? Try our AI Grader for instant feedback on your assignments.
Document Page
10BUSINESS INTELLIGENCE
Bibliography
Bacic, D., & Fadlalla, A. (2016). Business information visualization intellectual contributions: an
integrative framework of visualization capabilities and dimensions of visual
intelligence. Decision Support Systems, 89, 77-86.
Gendron, M., Yeoh, W., & Swarr, R. (2014, January). Supporting Decision Making: The BI
Sweet Spot. In DSS (pp. 279-290).
Power, D. J., Sharda, R., & Burstein, F. (2015). Decision support systems. John Wiley & Sons,
Ltd.
Ruppert, T. (2018). Visual Analytics to Support Evidence-Based Decision Making (Doctoral
dissertation, Technische Universität).
Zheng, H. Y. (2015). BUSINESS INTELLIGENCE ASA DATA-BASED DECISION
SUPPORT SYSTEM AND ITS ROLES IN SUPPORT OF INSTITUTIONAL
RESEARCH AND PLANNING. Institutional Research and Planning in Higher
Education: Global Contexts and Themes, 159.
chevron_up_icon
1 out of 11
circle_padding
hide_on_mobile
zoom_out_icon
[object Object]