Investigating Vitamin D and RA Effects on HLA-DR Expression KG-1 Cells
VerifiedAdded on 2023/04/23
|12
|1655
|170
Report
AI Summary
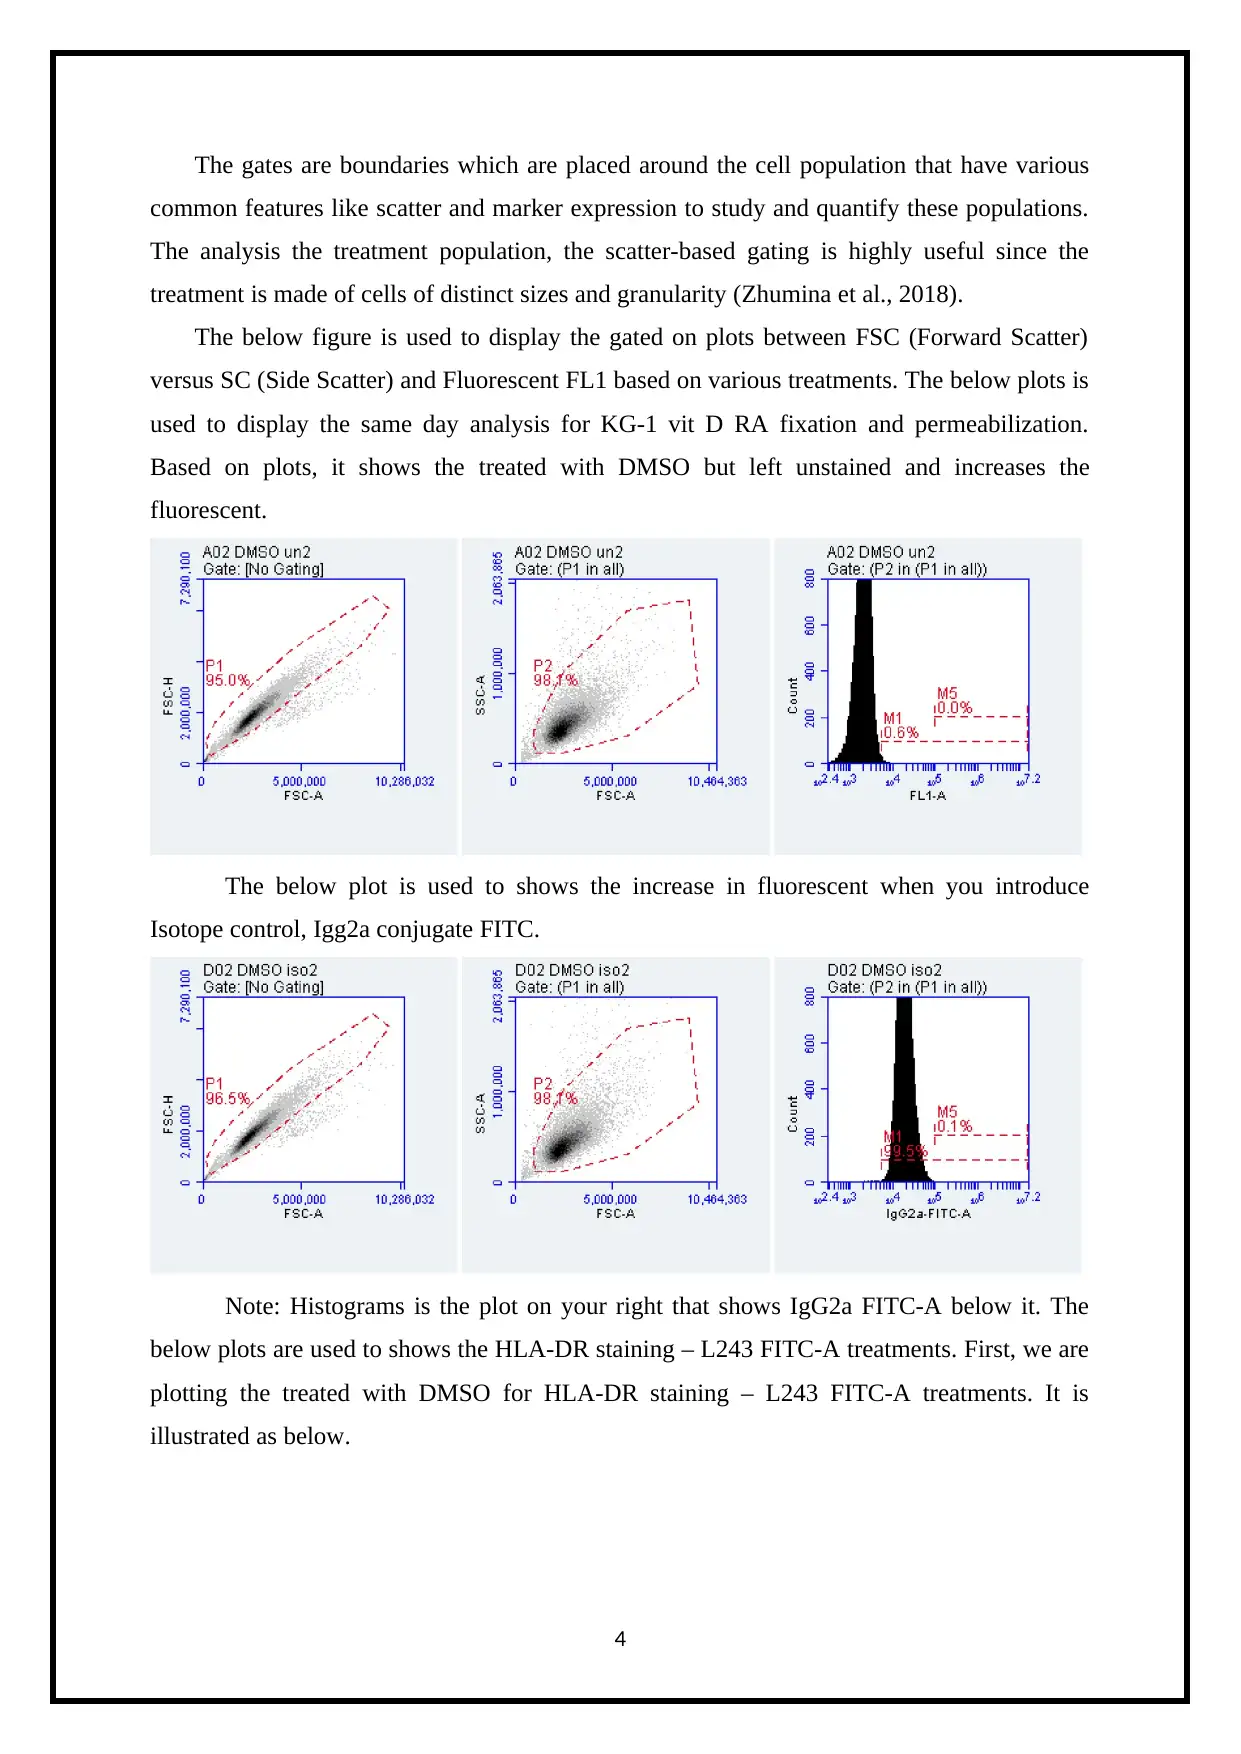
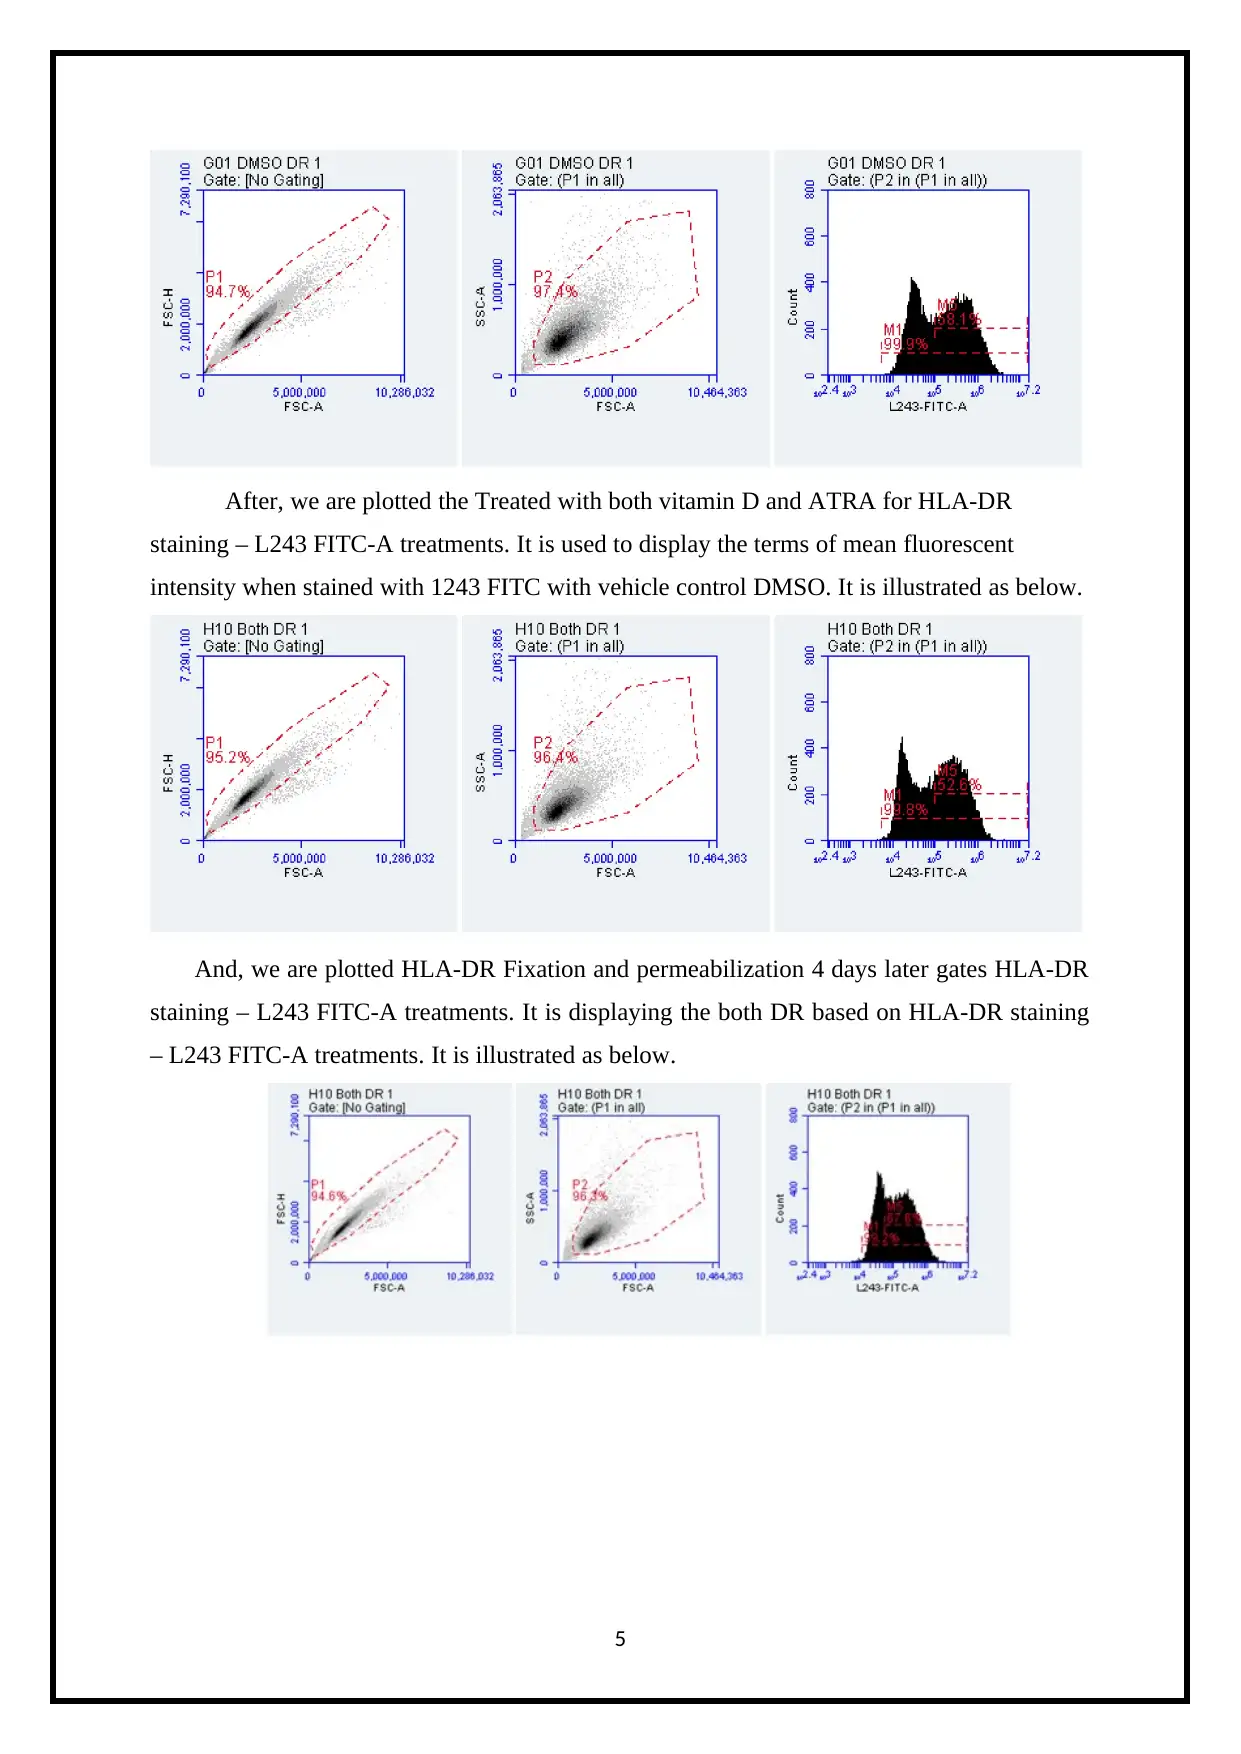
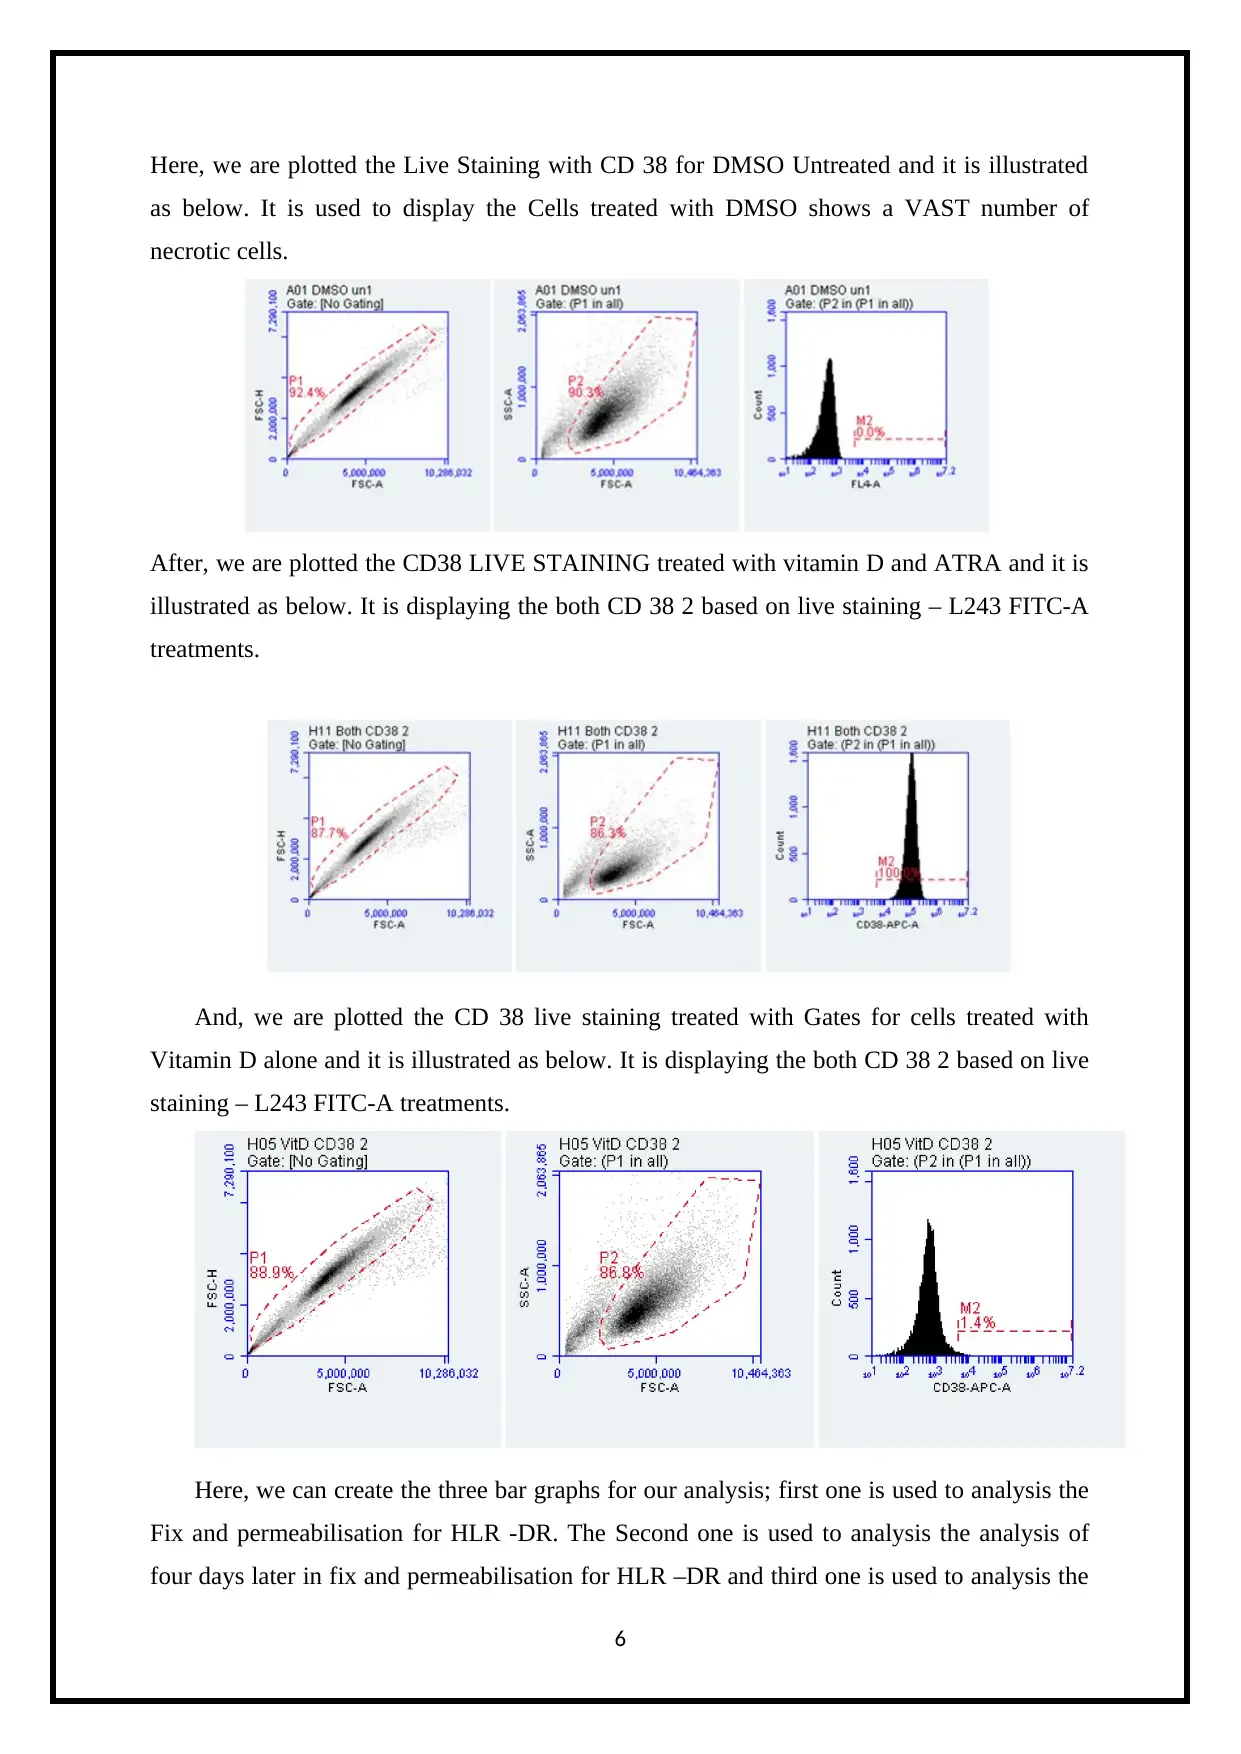
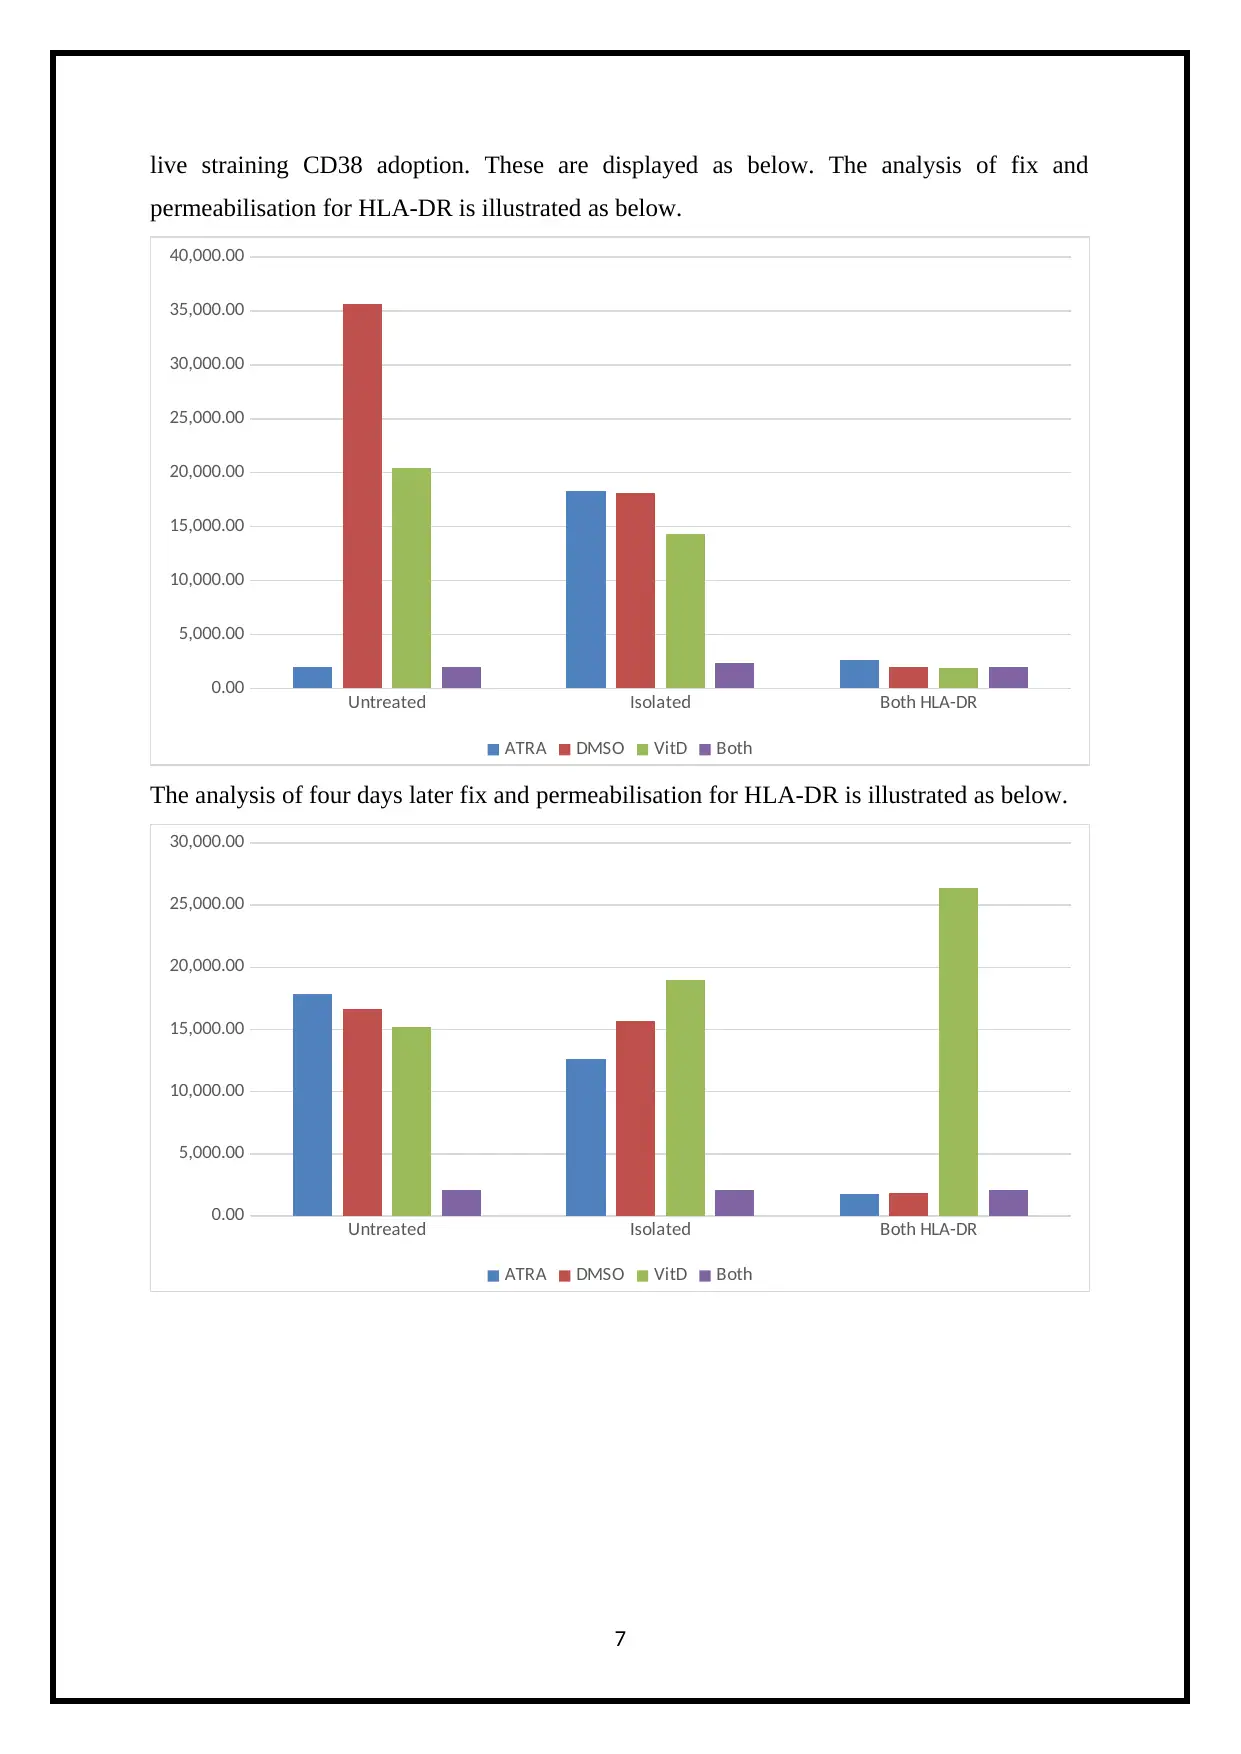
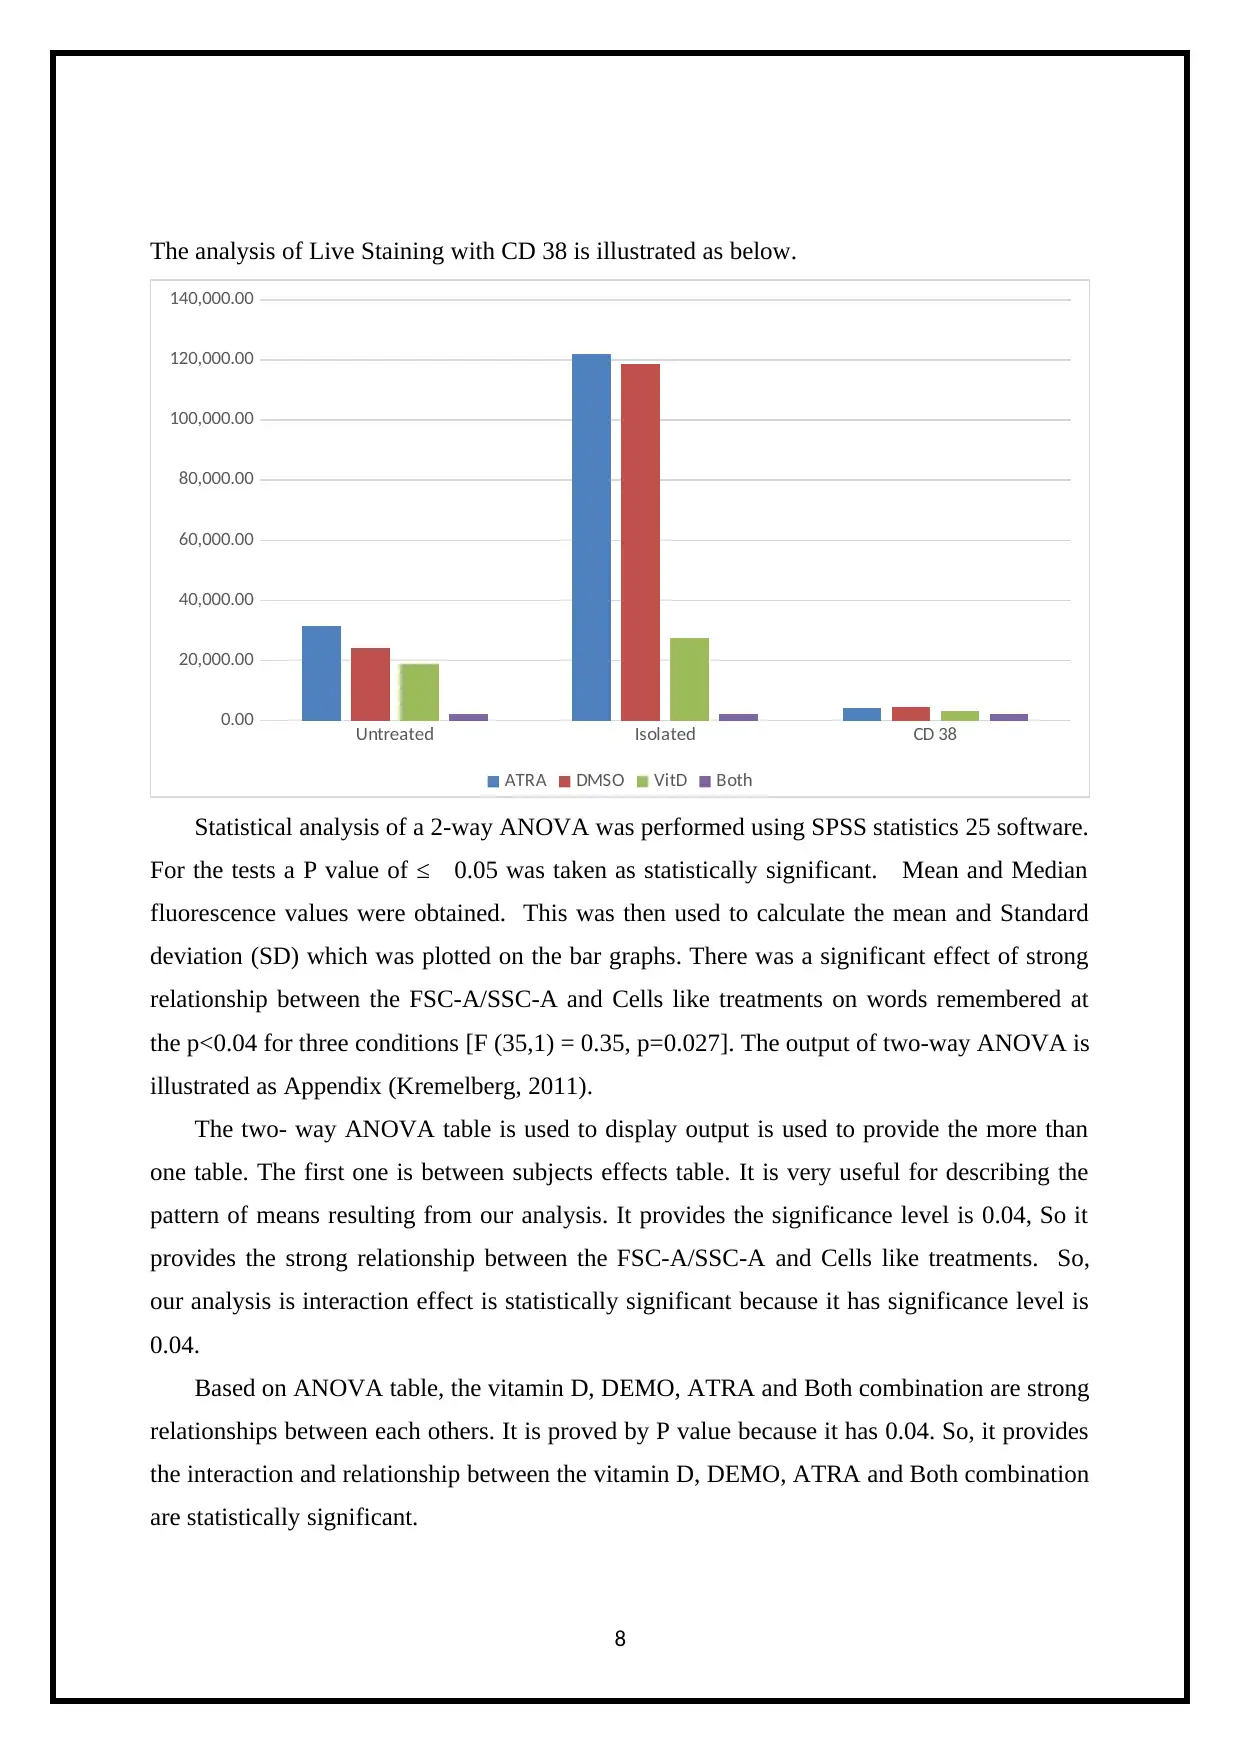
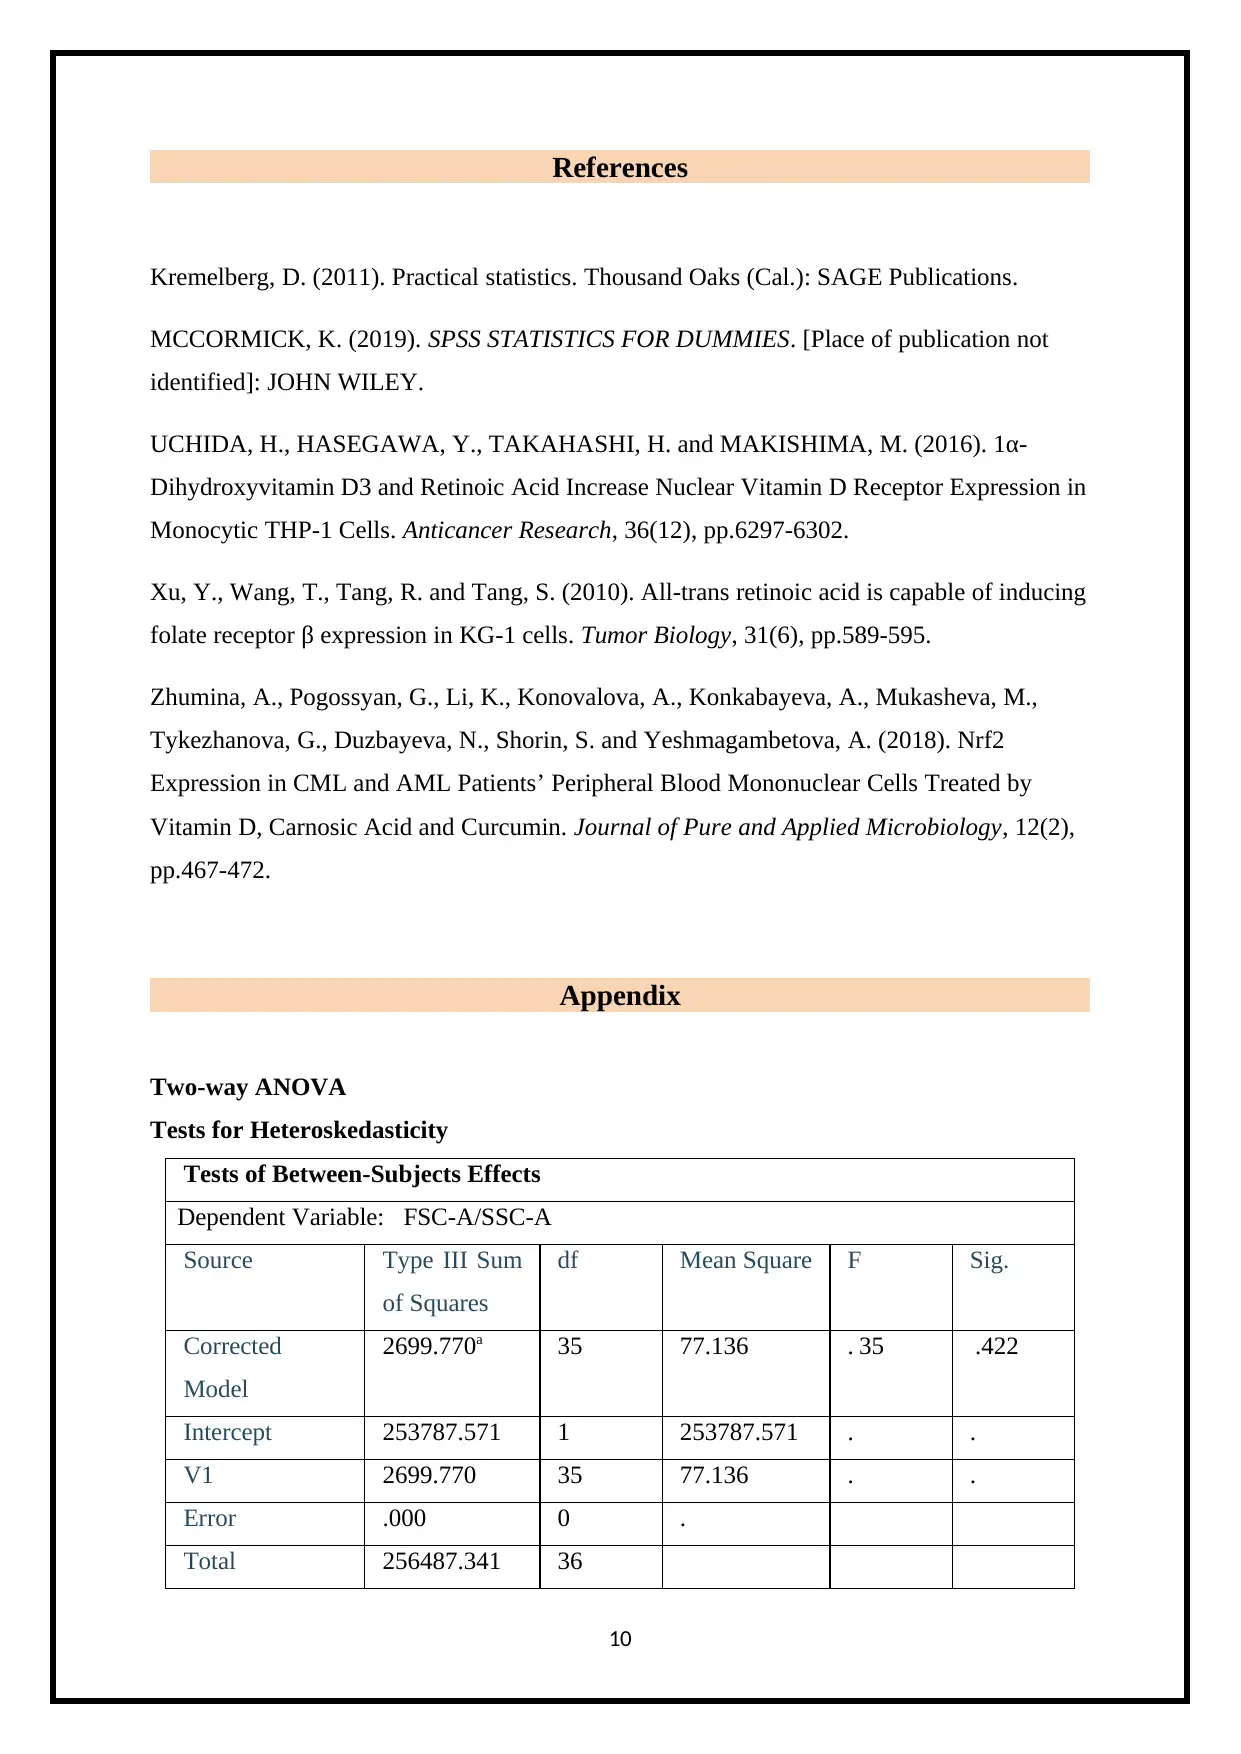
This report investigates the combined effects of vitamin D and retinoic acid (RA) on HLA-DR expression in KG-1 cell lines, focusing on the mutual competition for the RXR transcription factor. The study uses flow cytometry to analyze the impact of vitamin D and RA, both individually and in combination, on HLA-DR expression, utilizing gating plots to distinguish cell populations based on forward and side scatter properties. The results indicate that vitamin D and RA have opposing effects, with each reversing the effects of the other, while combined treatment leads to decreased HLA-DR expression. Statistical analysis using ANOVA confirms a significant relationship between treatments and cell characteristics, highlighting the interaction between vitamin D, RA, and HLA-DR expression. The report includes detailed plots and graphs illustrating the effects of different treatments on HLA-DR and CD38 expression, along with statistical analysis outputs.

University
Semester
PROJECT – RESULT SECTION
Student ID
Student Name
Submission Date
1
Semester
PROJECT – RESULT SECTION
Student ID
Student Name
Submission Date
1
Secure Best Marks with AI Grader
Need help grading? Try our AI Grader for instant feedback on your assignments.

Table of Contents
Results...................................................................................................................................................3
References...........................................................................................................................................10
Appendix.............................................................................................................................................10
2

Results
Both vitamin D and RA exert their cellular effects via nuclear receptors, which bind to
the promoters of their response genes to facilitate transcription. Vitamin D effects were
reversed by RA and vice-versa consistent for mutual competition for shared RXR
transcription factor. In contrast, the combined treatment of vitamin D and RA resulted in
decreased HLA-DR expression. The result confirms previous finding that vitamin D has
allele dependent and independent effects of HLA-DR protein expression which are modest in
size and involved of several different mechanisms and are further modulated by RA. The
main objective of this chapter was to examine the effect of vitamin D and / or RA on the
HLA-DR expression in the model cell lines.
So, we are Investigates the combined effect of vitamin D and RA on the total HLA-DR
expression in similar cell system but expanding the panel of cell lines in a systematic way to
include majority of the UK population. KG-1 cells were also selected because they have
more active turnover of HLA-DR molecules and they are heterozygous in the expression of
HLA-DR. Based on our analysis, the gating plot is used to display the gated-on plots between
FSC (Forward Scatter) versus SC (Side Scatter) and Fluorescent FL1. It is used to measure
the light emission then matches the fluorophore.
The gating is often to distinguishing the cells population depends on the forward and
side scatter properties. The forward and side scatter is used to provide the size estimation
and cells granularity respectively. The forward and side scatter size and cells are based
on various factors. The distinguishing the cell populations can be relatively straight
forward cell lines where there are is only a cell type and it can be more complex for
sample where there are multiple cell types (UCHIDA et al., 2016).
Basically, the gating is does not requires the process of daunting and by following
just a few simple steps by user can easily begin to analysis the specific cell populations.
If user can increase the fluorophores and stains number, user will be able to classify the
more specific cells populations (Xu et al., 2010). All the plots represented here below
and it have first had the dead cells excluded using the viability dye doublet
discrimination performed by plotting FSC-H versus FSC-A. All cells were stained in the
presence of a block.
3

The gates are boundaries which are placed around the cell population that have various
common features like scatter and marker expression to study and quantify these populations.
The analysis the treatment population, the scatter-based gating is highly useful since the
treatment is made of cells of distinct sizes and granularity (Zhumina et al., 2018).
The below figure is used to display the gated on plots between FSC (Forward Scatter)
versus SC (Side Scatter) and Fluorescent FL1 based on various treatments. The below plots is
used to display the same day analysis for KG-1 vit D RA fixation and permeabilization.
Based on plots, it shows the treated with DMSO but left unstained and increases the
fluorescent.
The below plot is used to shows the increase in fluorescent when you introduce
Isotope control, Igg2a conjugate FITC.
Note: Histograms is the plot on your right that shows IgG2a FITC-A below it. The
below plots are used to shows the HLA-DR staining – L243 FITC-A treatments. First, we are
plotting the treated with DMSO for HLA-DR staining – L243 FITC-A treatments. It is
illustrated as below.
4
Secure Best Marks with AI Grader
Need help grading? Try our AI Grader for instant feedback on your assignments.

After, we are plotted the Treated with both vitamin D and ATRA for HLA-DR
staining – L243 FITC-A treatments. It is used to display the terms of mean fluorescent
intensity when stained with 1243 FITC with vehicle control DMSO. It is illustrated as below.
And, we are plotted HLA-DR Fixation and permeabilization 4 days later gates HLA-DR
staining – L243 FITC-A treatments. It is displaying the both DR based on HLA-DR staining
– L243 FITC-A treatments. It is illustrated as below.
5

Here, we are plotted the Live Staining with CD 38 for DMSO Untreated and it is illustrated
as below. It is used to display the Cells treated with DMSO shows a VAST number of
necrotic cells.
After, we are plotted the CD38 LIVE STAINING treated with vitamin D and ATRA and it is
illustrated as below. It is displaying the both CD 38 2 based on live staining – L243 FITC-A
treatments.
And, we are plotted the CD 38 live staining treated with Gates for cells treated with
Vitamin D alone and it is illustrated as below. It is displaying the both CD 38 2 based on live
staining – L243 FITC-A treatments.
Here, we can create the three bar graphs for our analysis; first one is used to analysis the
Fix and permeabilisation for HLR -DR. The Second one is used to analysis the analysis of
four days later in fix and permeabilisation for HLR –DR and third one is used to analysis the
6

live straining CD38 adoption. These are displayed as below. The analysis of fix and
permeabilisation for HLA-DR is illustrated as below.
Untreated Isolated Both HLA-DR
0.00
5,000.00
10,000.00
15,000.00
20,000.00
25,000.00
30,000.00
35,000.00
40,000.00
ATRA DMSO VitD Both
The analysis of four days later fix and permeabilisation for HLA-DR is illustrated as below.
Untreated Isolated Both HLA-DR
0.00
5,000.00
10,000.00
15,000.00
20,000.00
25,000.00
30,000.00
ATRA DMSO VitD Both
7
Paraphrase This Document
Need a fresh take? Get an instant paraphrase of this document with our AI Paraphraser

The analysis of Live Staining with CD 38 is illustrated as below.
Untreated Isolated CD 38
0.00
20,000.00
40,000.00
60,000.00
80,000.00
100,000.00
120,000.00
140,000.00
ATRA DMSO VitD Both
Statistical analysis of a 2-way ANOVA was performed using SPSS statistics 25 software.
For the tests a P value of ≤ 0.05 was taken as statistically significant. Mean and Median
fluorescence values were obtained. This was then used to calculate the mean and Standard
deviation (SD) which was plotted on the bar graphs. There was a significant effect of strong
relationship between the FSC-A/SSC-A and Cells like treatments on words remembered at
the p<0.04 for three conditions [F (35,1) = 0.35, p=0.027]. The output of two-way ANOVA is
illustrated as Appendix (Kremelberg, 2011).
The two- way ANOVA table is used to display output is used to provide the more than
one table. The first one is between subjects effects table. It is very useful for describing the
pattern of means resulting from our analysis. It provides the significance level is 0.04, So it
provides the strong relationship between the FSC-A/SSC-A and Cells like treatments. So,
our analysis is interaction effect is statistically significant because it has significance level is
0.04.
Based on ANOVA table, the vitamin D, DEMO, ATRA and Both combination are strong
relationships between each others. It is proved by P value because it has 0.04. So, it provides
the interaction and relationship between the vitamin D, DEMO, ATRA and Both combination
are statistically significant.
8

Well, this will become clear if we understand what our interaction effect really means
and statistically significant. So, inspect our profile plots. It is used to shows how treatment
and Plot FSC-A/SSC-A affect these means.
And, also uses Tests for Heteroskedasticity to conform the relationship between the
between the FSC-A/SSC-A and treatments are statistically significant. Based on Tests for
Heteroskedasticity, it also has significance level is 0.04, so it also provides the strong
relationship between the FSC-A/SSC-A and treatments.
9

References
Kremelberg, D. (2011). Practical statistics. Thousand Oaks (Cal.): SAGE Publications.
MCCORMICK, K. (2019). SPSS STATISTICS FOR DUMMIES. [Place of publication not
identified]: JOHN WILEY.
UCHIDA, H., HASEGAWA, Y., TAKAHASHI, H. and MAKISHIMA, M. (2016). 1α-
Dihydroxyvitamin D3 and Retinoic Acid Increase Nuclear Vitamin D Receptor Expression in
Monocytic THP-1 Cells. Anticancer Research, 36(12), pp.6297-6302.
Xu, Y., Wang, T., Tang, R. and Tang, S. (2010). All-trans retinoic acid is capable of inducing
folate receptor β expression in KG-1 cells. Tumor Biology, 31(6), pp.589-595.
Zhumina, A., Pogossyan, G., Li, K., Konovalova, A., Konkabayeva, A., Mukasheva, M.,
Tykezhanova, G., Duzbayeva, N., Shorin, S. and Yeshmagambetova, A. (2018). Nrf2
Expression in CML and AML Patients’ Peripheral Blood Mononuclear Cells Treated by
Vitamin D, Carnosic Acid and Curcumin. Journal of Pure and Applied Microbiology, 12(2),
pp.467-472.
Appendix
Two-way ANOVA
Tests for Heteroskedasticity
Tests of Between-Subjects Effects
Dependent Variable: FSC-A/SSC-A
Source Type III Sum
of Squares
df Mean Square F Sig.
Corrected
Model
2699.770a 35 77.136 . 35 .422
Intercept 253787.571 1 253787.571 . .
V1 2699.770 35 77.136 . .
Error .000 0 .
Total 256487.341 36
10
Secure Best Marks with AI Grader
Need help grading? Try our AI Grader for instant feedback on your assignments.

Corrected Total 2699.770 35
a. R Squared = 1.000 (Adjusted R Squared = .0)
11
a. R Squared = 1.000 (Adjusted R Squared = .0)
11

12
1 out of 12

Your All-in-One AI-Powered Toolkit for Academic Success.
+13062052269
info@desklib.com
Available 24*7 on WhatsApp / Email
Unlock your academic potential
© 2024 | Zucol Services PVT LTD | All rights reserved.