University of Greenwich: Comparison of VO2max Values Lab Report
VerifiedAdded on 2023/01/17
|13
|2830
|80
Report
AI Summary
This lab report investigates the comparison between actual and predicted oxygen consumption (VO2max) values. The study involved six participants undergoing various exercise protocols, including walking, running, and cycling, to measure their VO2. Actual VO2 values were determined through expired gas analysis, while predicted VO2 values were calculated using the ACSM equations. The report details the methodology, including the conversion of VE(ATPS) to VE(STPD) and the use of prediction formulas. Results were analyzed, and the accuracy of the prediction equations was evaluated by comparing actual and predicted values and performing a t-test. The discussion section explores potential sources of error and the relevance of predictive formulas. The report concludes with a statistical analysis comparing the actual and predicted VO2 values, along with a discussion of the results.
Running Head: COMPARISON OF ACTUAL AND PREDICTED OXYGEN CONSUMPTION VALUES
Comparison of Actual and Predicted Oxygen Consumption Values Lab Report
By(Name)
Institutional Affiliation
Comparison of Actual and Predicted Oxygen Consumption Values Lab Report
By(Name)
Institutional Affiliation
Paraphrase This Document
Need a fresh take? Get an instant paraphrase of this document with our AI Paraphraser
COMPARISON OF ACTUAL AND PREDICTED OXYGEN CONSUMPTION VALUES 2
INTRODUCTION
VO2max, the maximum oxygen consumption is the measure of the maximal capacity
of the cardiorespiratory system to not only acquire but also to circulate oxygen to the
functioning muscles (Montero & Díaz-Cañestro, 2015). The circulated oxygen is then extracted
to the mitochondria for respiration. This quantity is thus crucial in quantifying, fitness,
cardio-respiratory characteristics, muscular fitness for both the athletes and patients.
According to Tanner & Navalta (2019) cardiopulmonary exercise test forms a standard basis
of evaluating exercise intolerance for patients with cardiac and pulmonary diseases.
Measurement of VO2 max requires a person to exercise to the volition fatigue. The
method is however not suitable for testing large population or in scenarios where the
participant may be placed in unacceptable health risks as he/she exercises to maximal
exertion (McGawley & Bishop, 2015). The VO2 max measurement used in this report
involves anaerobic exercise test which is an essential component in the establishment of
fitness profiles and exercise prescription (Keteyian et al., 2016). In sports, both the trained
and untrained persons are must establish fitness as well as exercise prescription. In an ideal
case, a maximal test should be applied in the establishment of a full range capacity. The
maximum test is however inherent risks.
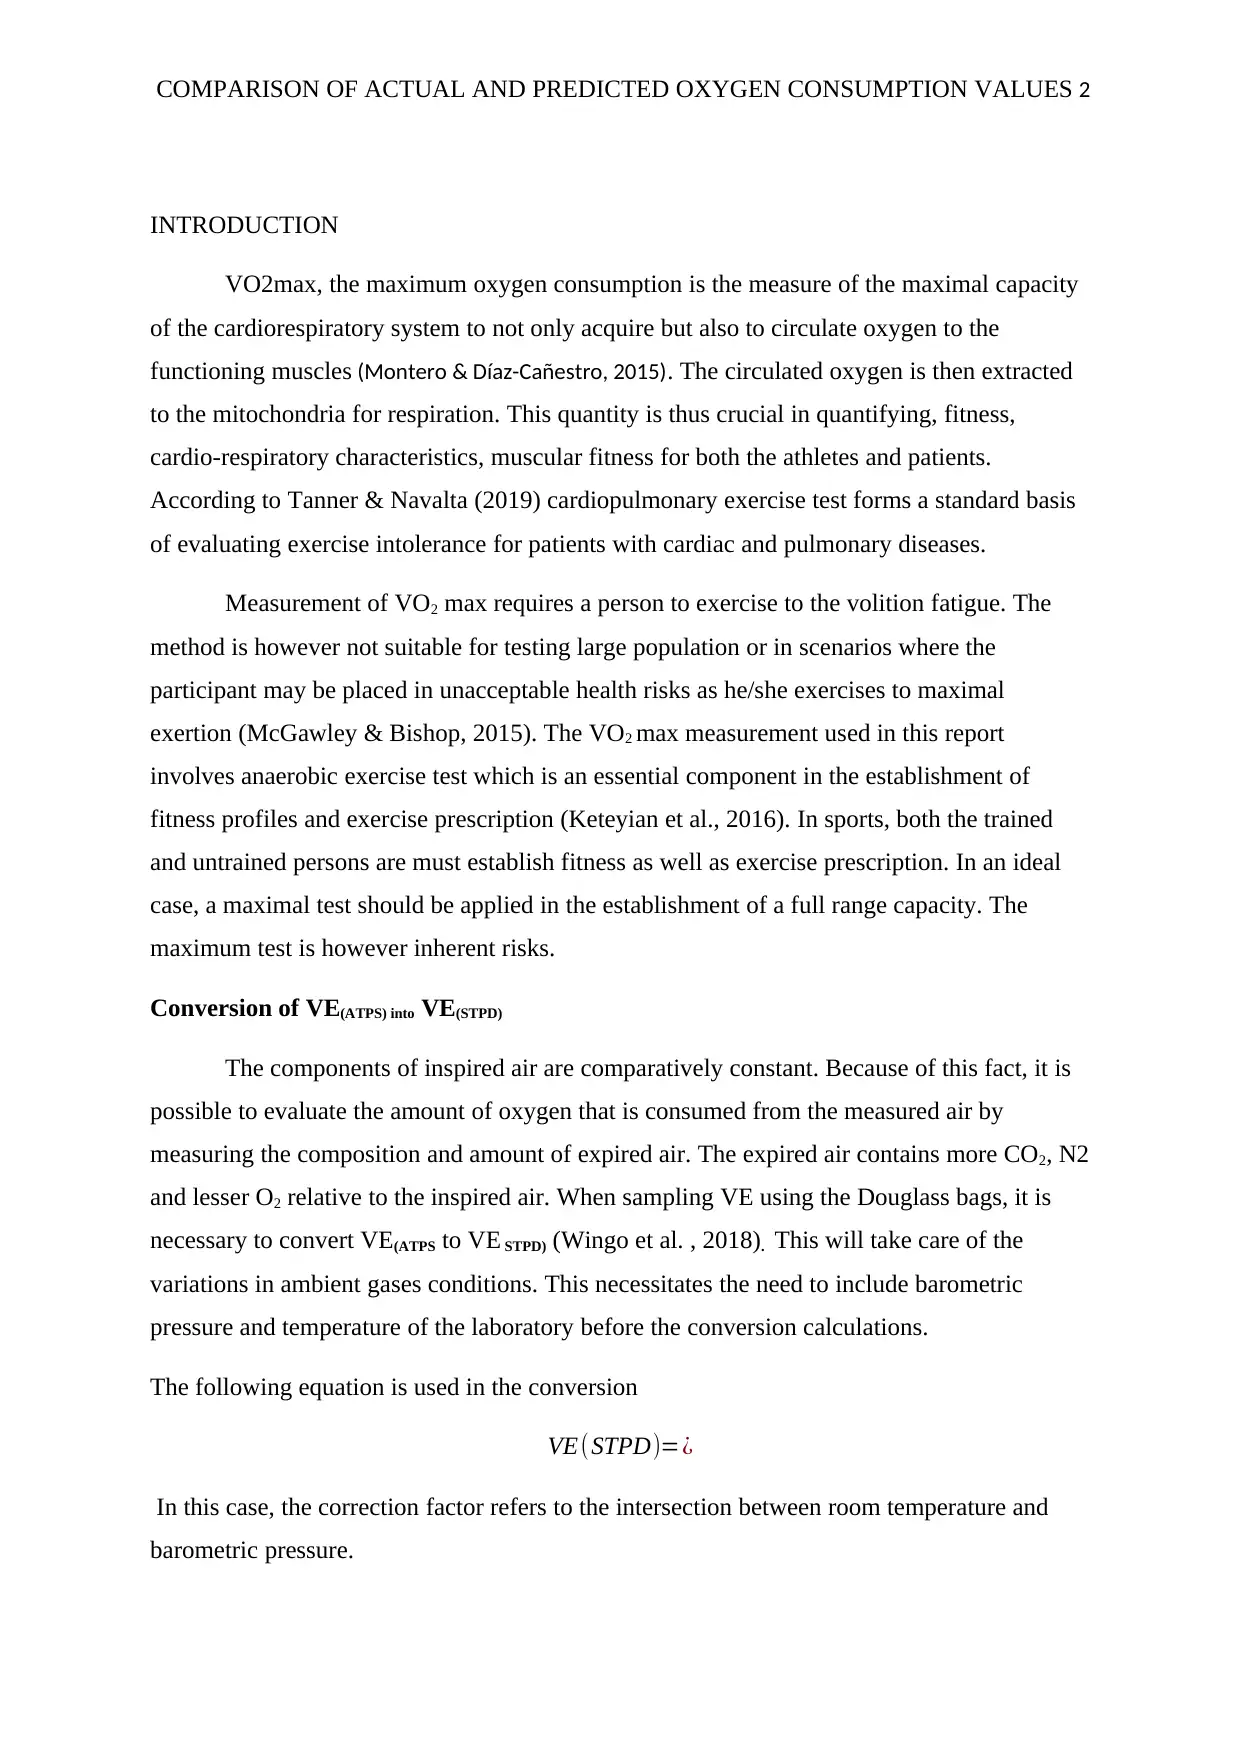
Conversion of VE(ATPS) into VE(STPD)
The components of inspired air are comparatively constant. Because of this fact, it is
possible to evaluate the amount of oxygen that is consumed from the measured air by
measuring the composition and amount of expired air. The expired air contains more CO2, N2
and lesser O2 relative to the inspired air. When sampling VE using the Douglass bags, it is
necessary to convert VE(ATPS to VE STPD) (Wingo et al. , 2018). This will take care of the
variations in ambient gases conditions. This necessitates the need to include barometric
pressure and temperature of the laboratory before the conversion calculations.
The following equation is used in the conversion
VE(STPD)=¿
In this case, the correction factor refers to the intersection between room temperature and
barometric pressure.
INTRODUCTION
VO2max, the maximum oxygen consumption is the measure of the maximal capacity
of the cardiorespiratory system to not only acquire but also to circulate oxygen to the
functioning muscles (Montero & Díaz-Cañestro, 2015). The circulated oxygen is then extracted
to the mitochondria for respiration. This quantity is thus crucial in quantifying, fitness,
cardio-respiratory characteristics, muscular fitness for both the athletes and patients.
According to Tanner & Navalta (2019) cardiopulmonary exercise test forms a standard basis
of evaluating exercise intolerance for patients with cardiac and pulmonary diseases.
Measurement of VO2 max requires a person to exercise to the volition fatigue. The
method is however not suitable for testing large population or in scenarios where the
participant may be placed in unacceptable health risks as he/she exercises to maximal
exertion (McGawley & Bishop, 2015). The VO2 max measurement used in this report
involves anaerobic exercise test which is an essential component in the establishment of
fitness profiles and exercise prescription (Keteyian et al., 2016). In sports, both the trained
and untrained persons are must establish fitness as well as exercise prescription. In an ideal
case, a maximal test should be applied in the establishment of a full range capacity. The
maximum test is however inherent risks.
Conversion of VE(ATPS) into VE(STPD)
The components of inspired air are comparatively constant. Because of this fact, it is
possible to evaluate the amount of oxygen that is consumed from the measured air by
measuring the composition and amount of expired air. The expired air contains more CO2, N2
and lesser O2 relative to the inspired air. When sampling VE using the Douglass bags, it is
necessary to convert VE(ATPS to VE STPD) (Wingo et al. , 2018). This will take care of the
variations in ambient gases conditions. This necessitates the need to include barometric
pressure and temperature of the laboratory before the conversion calculations.
The following equation is used in the conversion
VE(STPD)=¿
In this case, the correction factor refers to the intersection between room temperature and
barometric pressure.
COMPARISON OF ACTUAL AND PREDICTED OXYGEN CONSUMPTION VALUES 3
For example
Prediction of VO2 (Predicted VO2)
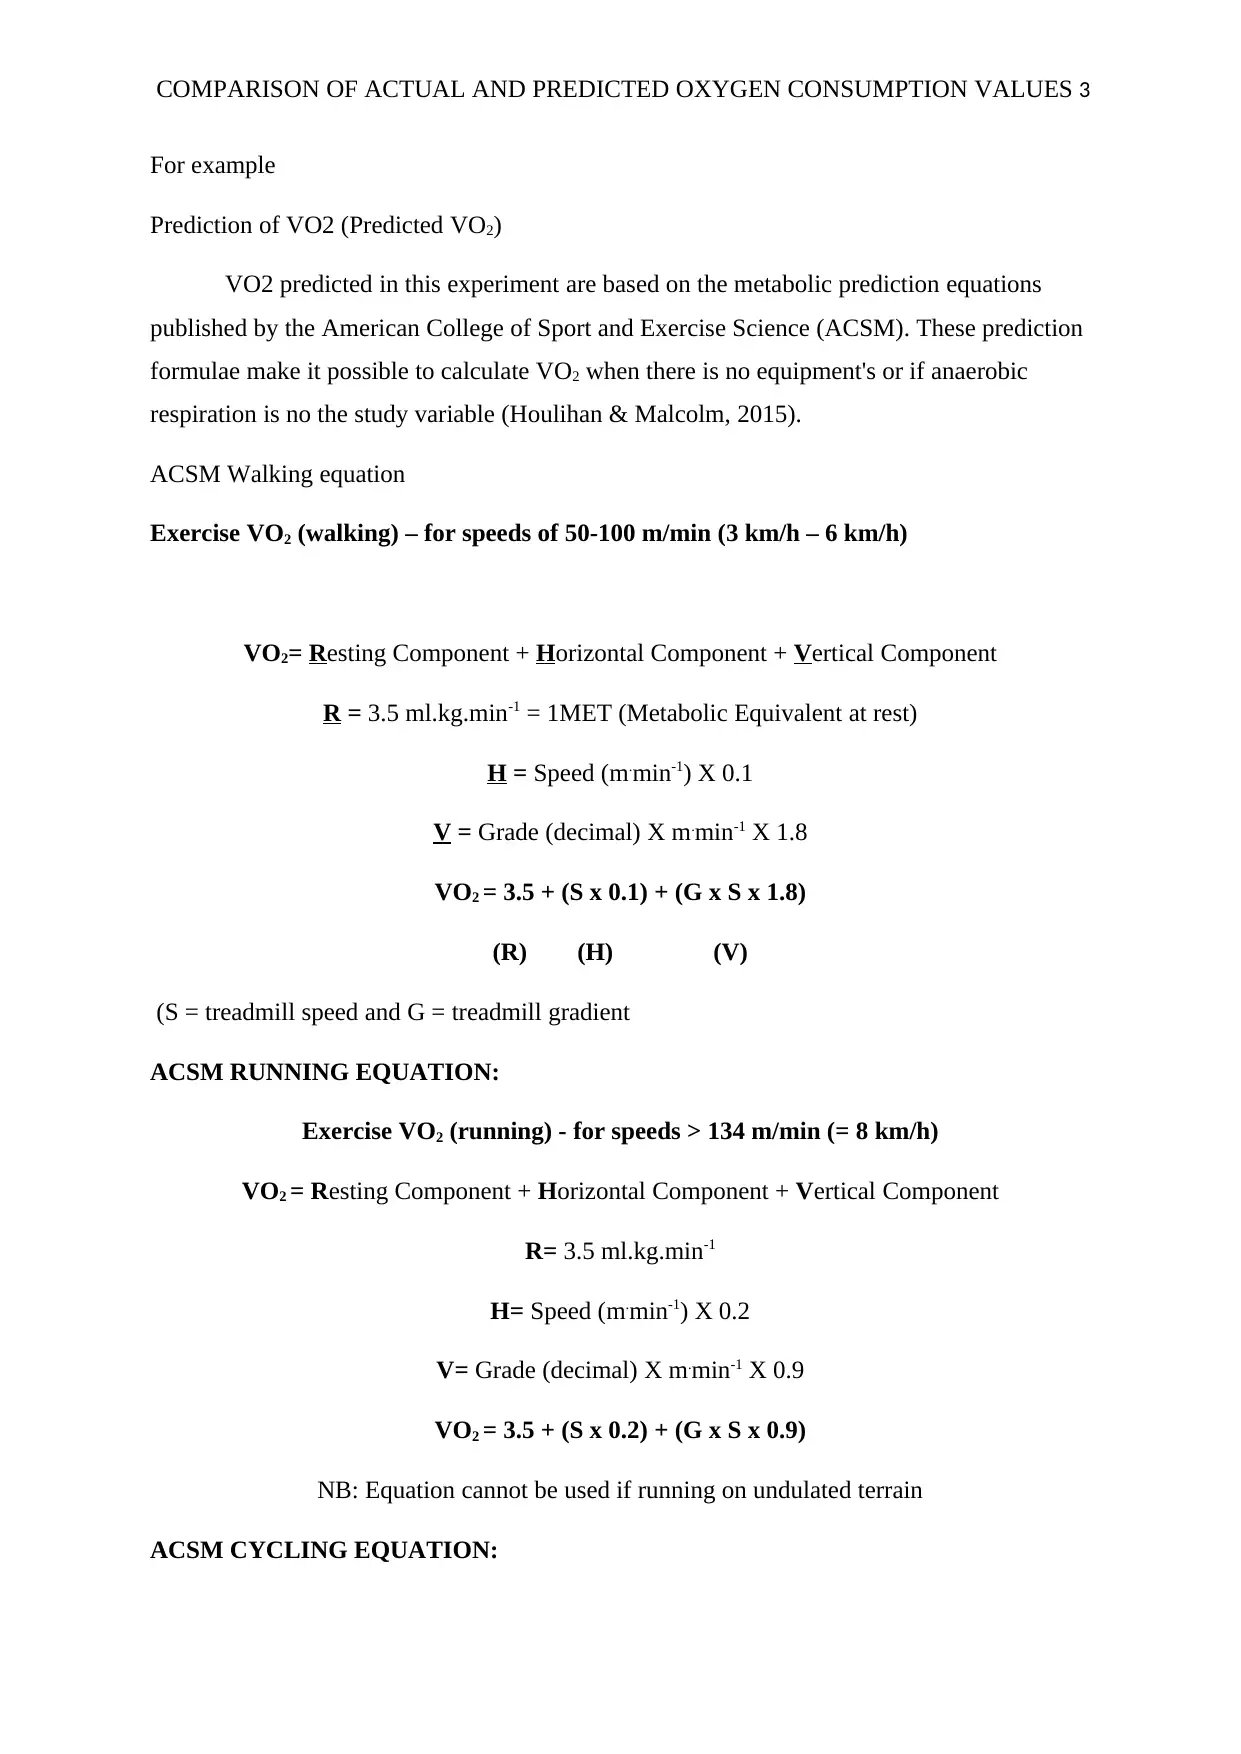
VO2 predicted in this experiment are based on the metabolic prediction equations
published by the American College of Sport and Exercise Science (ACSM). These prediction
formulae make it possible to calculate VO2 when there is no equipment's or if anaerobic
respiration is no the study variable (Houlihan & Malcolm, 2015).
ACSM Walking equation
Exercise VO2 (walking) – for speeds of 50-100 m/min (3 km/h – 6 km/h)
VO2= Resting Component + Horizontal Component + Vertical Component
R = 3.5 ml.kg.min-1 = 1MET (Metabolic Equivalent at rest)
H = Speed (m.min-1) X 0.1
V = Grade (decimal) X m.min-1 X 1.8
VO2 = 3.5 + (S x 0.1) + (G x S x 1.8)
(R) (H) (V)
(S = treadmill speed and G = treadmill gradient
ACSM RUNNING EQUATION:
Exercise VO2 (running) - for speeds > 134 m/min (= 8 km/h)
VO2 = Resting Component + Horizontal Component + Vertical Component
R= 3.5 ml.kg.min-1
H= Speed (m.min-1) X 0.2
V= Grade (decimal) X m.min-1 X 0.9
VO2 = 3.5 + (S x 0.2) + (G x S x 0.9)
NB: Equation cannot be used if running on undulated terrain
ACSM CYCLING EQUATION:
For example
Prediction of VO2 (Predicted VO2)
VO2 predicted in this experiment are based on the metabolic prediction equations
published by the American College of Sport and Exercise Science (ACSM). These prediction
formulae make it possible to calculate VO2 when there is no equipment's or if anaerobic
respiration is no the study variable (Houlihan & Malcolm, 2015).
ACSM Walking equation
Exercise VO2 (walking) – for speeds of 50-100 m/min (3 km/h – 6 km/h)
VO2= Resting Component + Horizontal Component + Vertical Component
R = 3.5 ml.kg.min-1 = 1MET (Metabolic Equivalent at rest)
H = Speed (m.min-1) X 0.1
V = Grade (decimal) X m.min-1 X 1.8
VO2 = 3.5 + (S x 0.1) + (G x S x 1.8)
(R) (H) (V)
(S = treadmill speed and G = treadmill gradient
ACSM RUNNING EQUATION:
Exercise VO2 (running) - for speeds > 134 m/min (= 8 km/h)
VO2 = Resting Component + Horizontal Component + Vertical Component
R= 3.5 ml.kg.min-1
H= Speed (m.min-1) X 0.2
V= Grade (decimal) X m.min-1 X 0.9
VO2 = 3.5 + (S x 0.2) + (G x S x 0.9)
NB: Equation cannot be used if running on undulated terrain
ACSM CYCLING EQUATION:
⊘ This is a preview!⊘
Do you want full access?
Subscribe today to unlock all pages.
Trusted by 1+ million students worldwide
COMPARISON OF ACTUAL AND PREDICTED OXYGEN CONSUMPTION VALUES 4
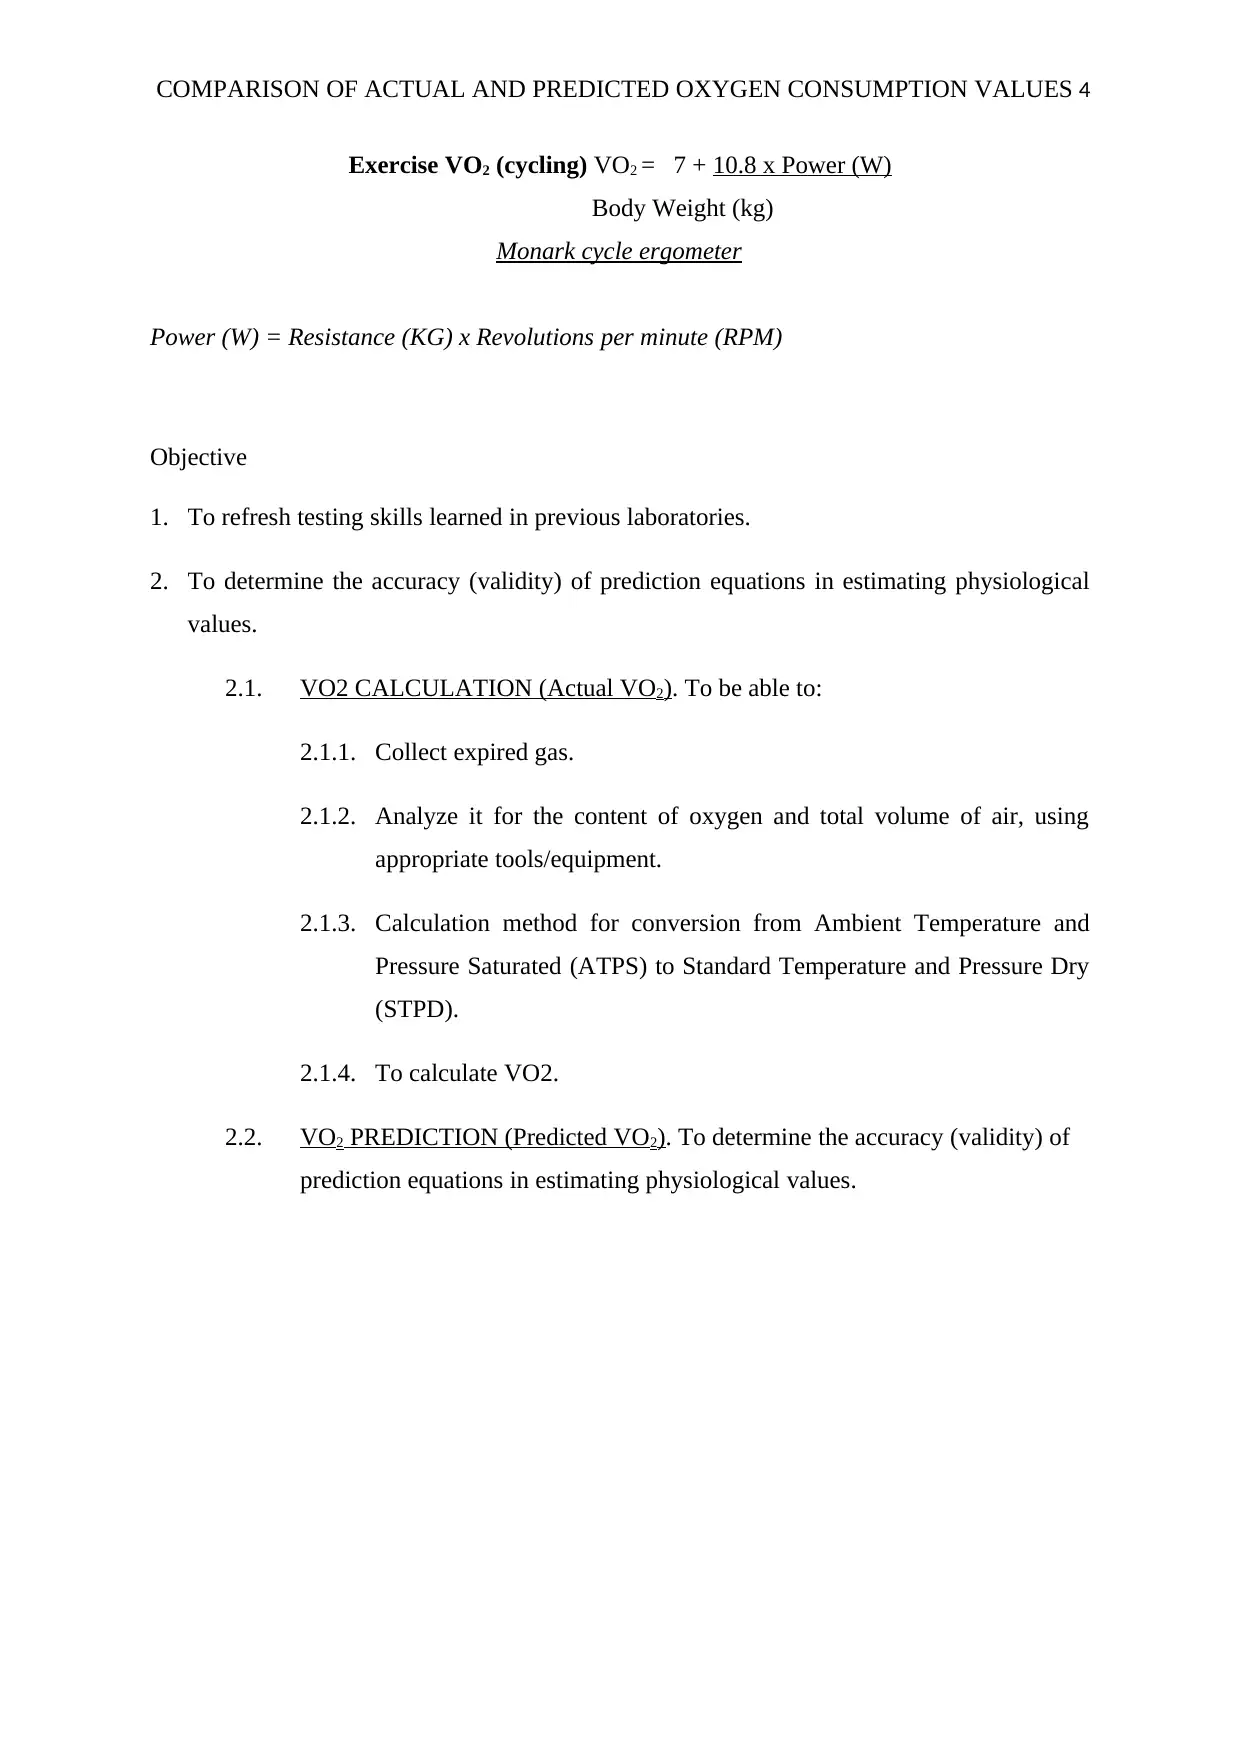
Exercise VO2 (cycling) VO2 = 7 + 10.8 x Power (W)
Body Weight (kg)
Monark cycle ergometer
Power (W) = Resistance (KG) x Revolutions per minute (RPM)
Objective
1. To refresh testing skills learned in previous laboratories.
2. To determine the accuracy (validity) of prediction equations in estimating physiological
values.
2.1. VO2 CALCULATION (Actual VO2). To be able to:
2.1.1. Collect expired gas.
2.1.2. Analyze it for the content of oxygen and total volume of air, using
appropriate tools/equipment.
2.1.3. Calculation method for conversion from Ambient Temperature and
Pressure Saturated (ATPS) to Standard Temperature and Pressure Dry
(STPD).
2.1.4. To calculate VO2.
2.2. VO2 PREDICTION (Predicted VO2). To determine the accuracy (validity) of
prediction equations in estimating physiological values.
Paraphrase This Document
Need a fresh take? Get an instant paraphrase of this document with our AI Paraphraser
COMPARISON OF ACTUAL AND PREDICTED OXYGEN CONSUMPTION VALUES 5
METHODOLOGY
At rest
The height, weight after a 10 min passive resting period were recorded. The resting heart
rate was recorded and then the expired gas samples collected during the 1-minute resting minute
ventilation (VE). The resting oxygen for the 6 participants was then recorded.
During performance
.
Participants recorded their height and weight measurement. After 10 minutes of a passive
resting period, resting heart rate was measured and the resting minutes’ ventilation (VE) and the
oxygen uptake (VO2) were obtained. The expired air sample was then collected for the 30s
following the resting period. All the exercises lasted for 7 minutes and involved the activities
shown below:
Walking on the treadmill at a comfortable pace of 100m-min-1 at a gradient of 1.0%
Running on a treadmill at a constant velocity of 150m-min at a gradient of 1.0%
Cycling at a continuous load of 150W with a constant pedal cadence of 75 RPM
30s sampled of expired gas was collected in Douglas bags and the Heart rate collected in the 3rd
and 6th minute. The sample was then analyzed for a fraction of expired oxygen and expired gas
using gas analyzer. The walking/running velocities and gradient and the resistance applied to the
cycle ergometer were also recorded to compute corresponding power outputs in watts (W
COMPARISON OF ACTUAL AND PREDICTED OXYGEN CONSUMPTION VALUES 6
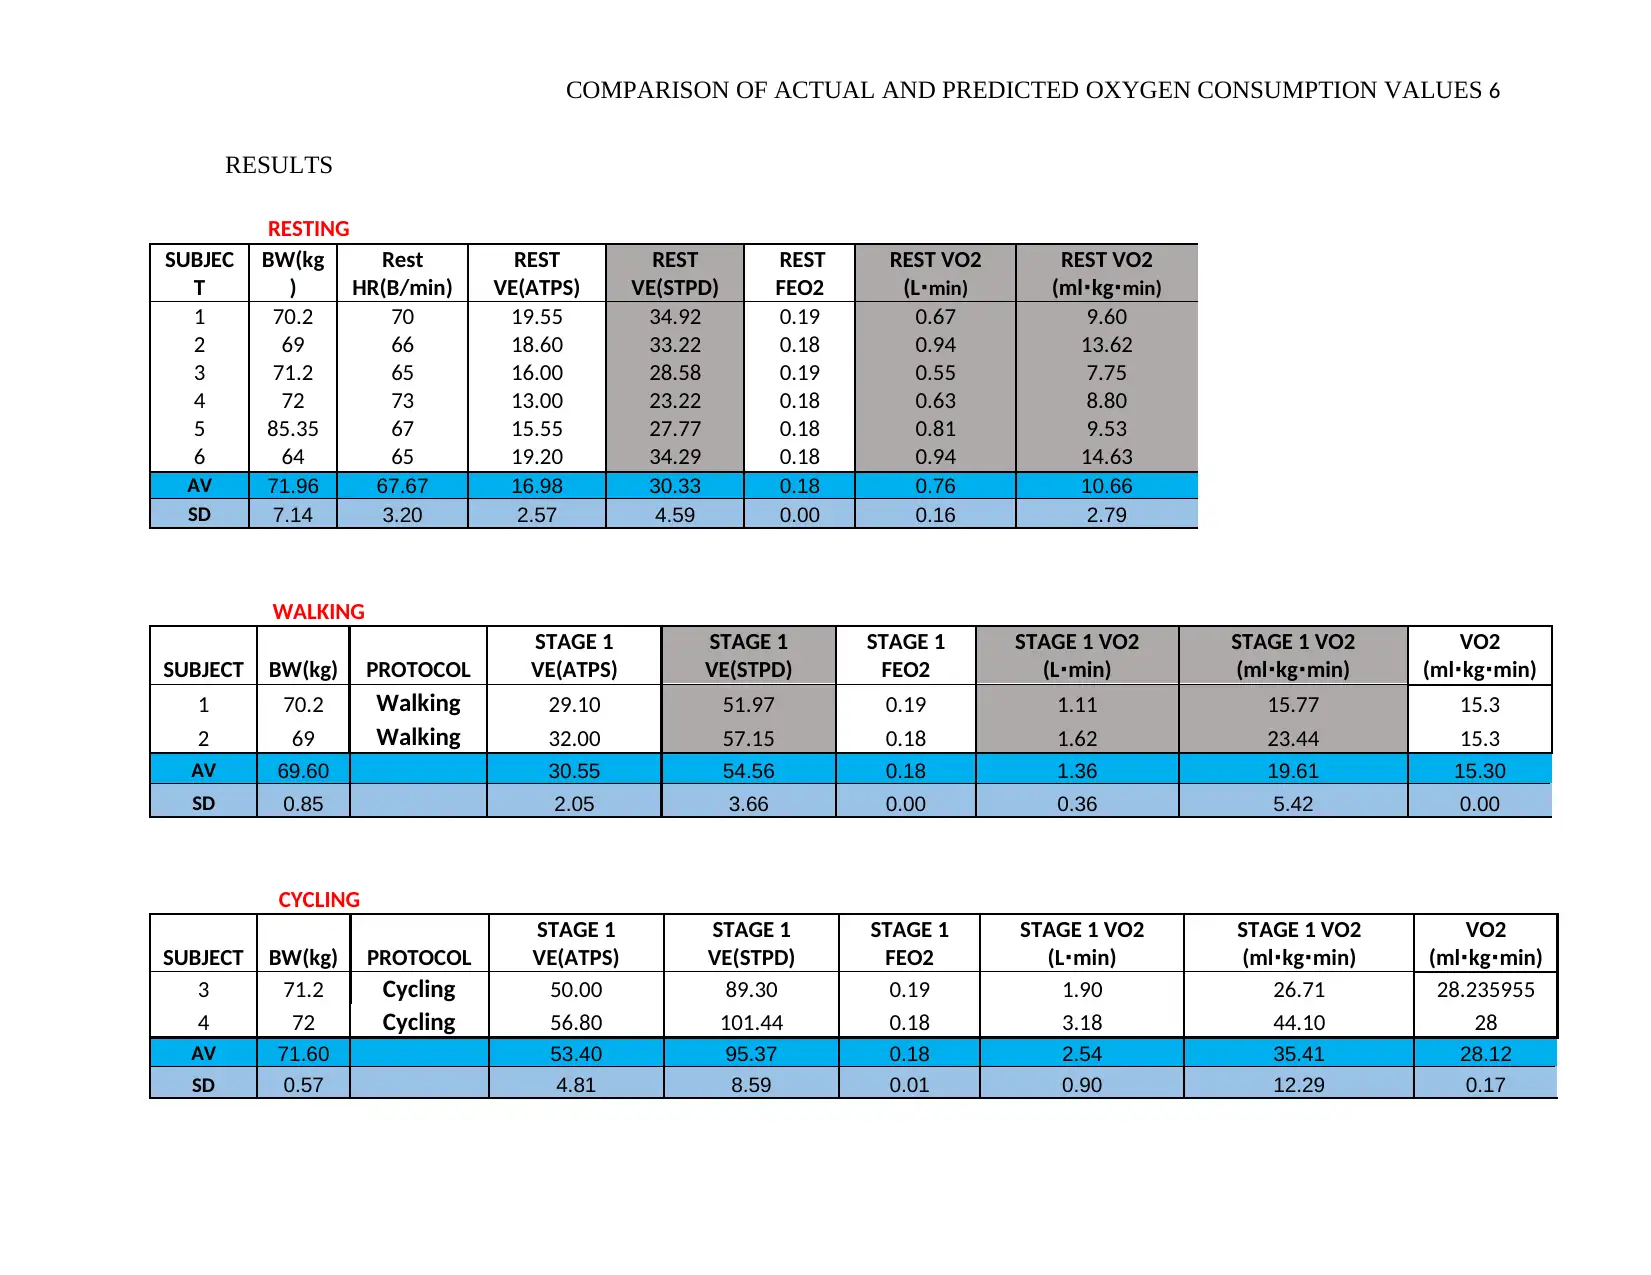
RESULTS
RESTING
SUBJEC
T
BW(kg
)
Rest
HR(B/min)
REST
VE(ATPS)
REST
VE(STPD)
REST
FEO2
REST VO2
(L∙min)
REST VO2
(ml kg∙ ∙min)
1 70.2 70 19.55 34.92 0.19 0.67 9.60
2 69 66 18.60 33.22 0.18 0.94 13.62
3 71.2 65 16.00 28.58 0.19 0.55 7.75
4 72 73 13.00 23.22 0.18 0.63 8.80
5 85.35 67 15.55 27.77 0.18 0.81 9.53
6 64 65 19.20 34.29 0.18 0.94 14.63
AV 71.96 67.67 16.98 30.33 0.18 0.76 10.66
SD 7.14 3.20 2.57 4.59 0.00 0.16 2.79
WALKING
SUBJECT BW(kg) PROTOCOL
STAGE 1
VE(ATPS)
STAGE 1
VE(STPD)
STAGE 1
FEO2
STAGE 1 VO2
(L min)∙
STAGE 1 VO2
(ml kg min)∙ ∙
VO2
(ml kg min)∙ ∙
1 70.2 Walking 29.10 51.97 0.19 1.11 15.77 15.3
2 69 Walking 32.00 57.15 0.18 1.62 23.44 15.3
AV 69.60 30.55 54.56 0.18 1.36 19.61 15.30
SD 0.85 2.05 3.66 0.00 0.36 5.42 0.00
CYCLING
SUBJECT BW(kg) PROTOCOL
STAGE 1
VE(ATPS)
STAGE 1
VE(STPD)
STAGE 1
FEO2
STAGE 1 VO2
(L min)∙
STAGE 1 VO2
(ml kg min)∙ ∙
VO2
(ml kg min)∙ ∙
3 71.2 Cycling 50.00 89.30 0.19 1.90 26.71 28.235955
4 72 Cycling 56.80 101.44 0.18 3.18 44.10 28
AV 71.60 53.40 95.37 0.18 2.54 35.41 28.12
SD 0.57 4.81 8.59 0.01 0.90 12.29 0.17
⊘ This is a preview!⊘
Do you want full access?
Subscribe today to unlock all pages.
Trusted by 1+ million students worldwide
COMPARISON OF ACTUAL AND PREDICTED OXYGEN CONSUMPTION VALUES 7
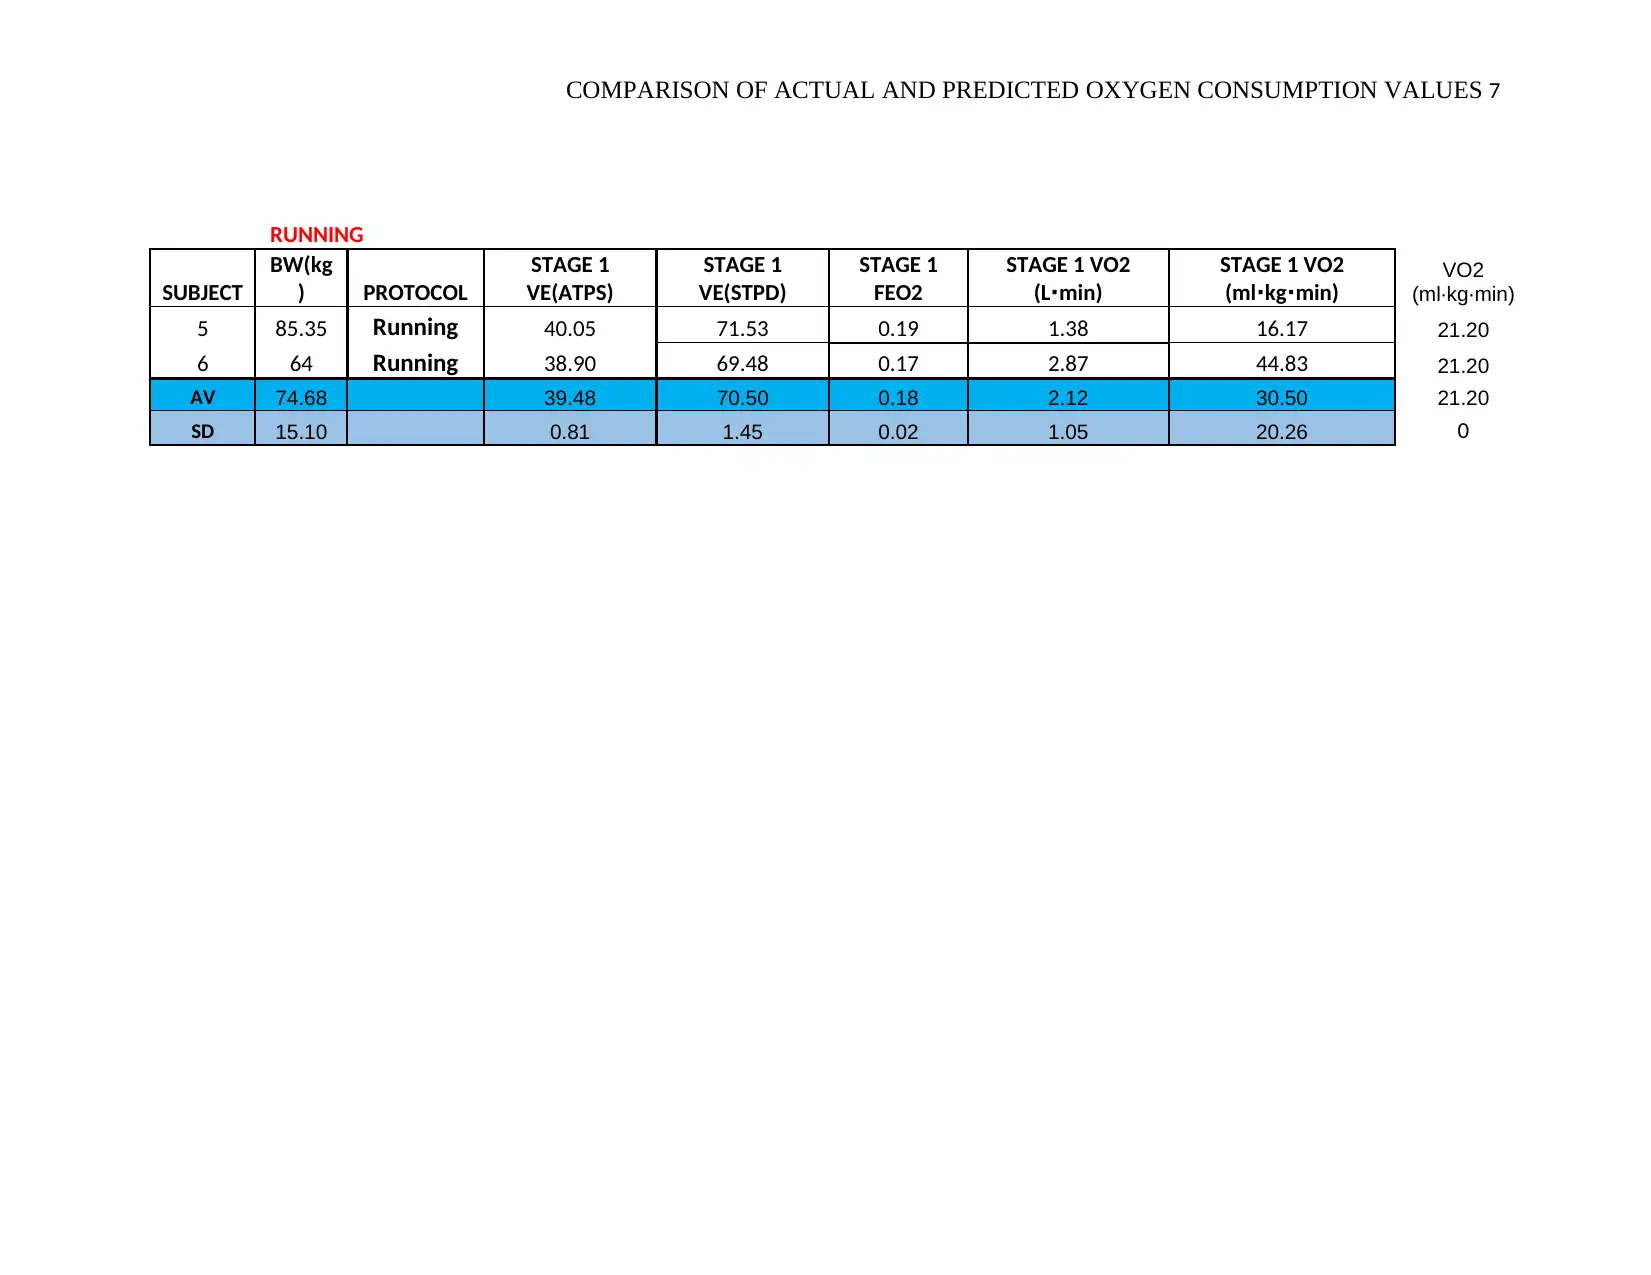
RUNNING
SUBJECT
BW(kg
) PROTOCOL
STAGE 1
VE(ATPS)
STAGE 1
VE(STPD)
STAGE 1
FEO2
STAGE 1 VO2
(L min)∙
STAGE 1 VO2
(ml kg min)∙ ∙ VO2
(ml∙kg∙min)
5 85.35 Running 40.05 71.53 0.19 1.38 16.17 21.20
6 64 Running 38.90 69.48 0.17 2.87 44.83 21.20
AV 74.68 39.48 70.50 0.18 2.12 30.50 21.20
SD 15.10 0.81 1.45 0.02 1.05 20.26 0
Paraphrase This Document
Need a fresh take? Get an instant paraphrase of this document with our AI Paraphraser
COMPARISON OF ACTUAL AND PREDICTED OXYGEN CONSUMPTION VALUES 8
DISCUSSION
Resting
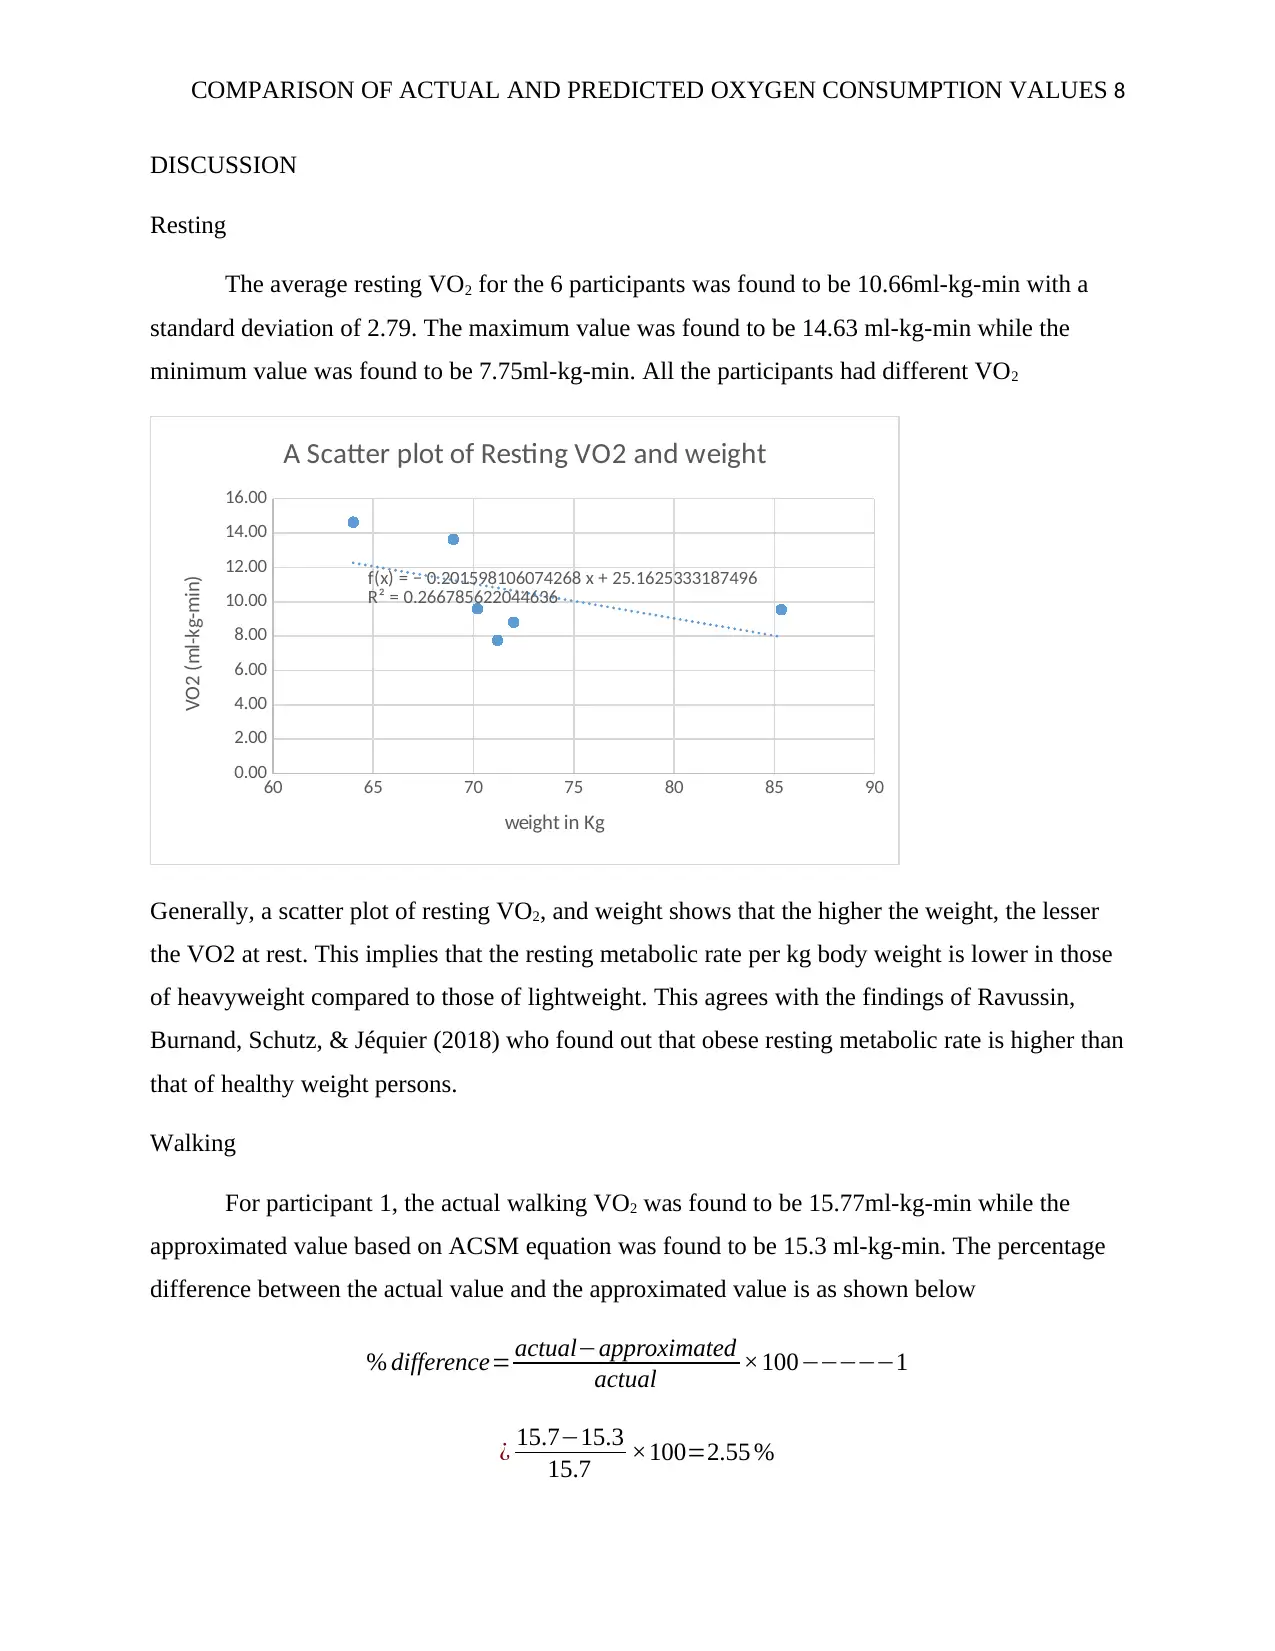
The average resting VO2 for the 6 participants was found to be 10.66ml-kg-min with a
standard deviation of 2.79. The maximum value was found to be 14.63 ml-kg-min while the
minimum value was found to be 7.75ml-kg-min. All the participants had different VO2
60 65 70 75 80 85 90
0.00
2.00
4.00
6.00
8.00
10.00
12.00
14.00
16.00
f(x) = − 0.201598106074268 x + 25.1625333187496
R² = 0.266785622044636
A Scatter plot of Resting VO2 and weight
weight in Kg
VO2 (ml-kg-min)
Generally, a scatter plot of resting VO2, and weight shows that the higher the weight, the lesser
the VO2 at rest. This implies that the resting metabolic rate per kg body weight is lower in those
of heavyweight compared to those of lightweight. This agrees with the findings of Ravussin,
Burnand, Schutz, & Jéquier (2018) who found out that obese resting metabolic rate is higher than
that of healthy weight persons.
Walking
For participant 1, the actual walking VO2 was found to be 15.77ml-kg-min while the
approximated value based on ACSM equation was found to be 15.3 ml-kg-min. The percentage
difference between the actual value and the approximated value is as shown below
% difference= actual−approximated
actual ×100−−−−−1
¿ 15.7−15.3
15.7 ×100=2.55 %
DISCUSSION
Resting
The average resting VO2 for the 6 participants was found to be 10.66ml-kg-min with a
standard deviation of 2.79. The maximum value was found to be 14.63 ml-kg-min while the
minimum value was found to be 7.75ml-kg-min. All the participants had different VO2
60 65 70 75 80 85 90
0.00
2.00
4.00
6.00
8.00
10.00
12.00
14.00
16.00
f(x) = − 0.201598106074268 x + 25.1625333187496
R² = 0.266785622044636
A Scatter plot of Resting VO2 and weight
weight in Kg
VO2 (ml-kg-min)
Generally, a scatter plot of resting VO2, and weight shows that the higher the weight, the lesser
the VO2 at rest. This implies that the resting metabolic rate per kg body weight is lower in those
of heavyweight compared to those of lightweight. This agrees with the findings of Ravussin,
Burnand, Schutz, & Jéquier (2018) who found out that obese resting metabolic rate is higher than
that of healthy weight persons.
Walking
For participant 1, the actual walking VO2 was found to be 15.77ml-kg-min while the
approximated value based on ACSM equation was found to be 15.3 ml-kg-min. The percentage
difference between the actual value and the approximated value is as shown below
% difference= actual−approximated
actual ×100−−−−−1
¿ 15.7−15.3
15.7 ×100=2.55 %
COMPARISON OF ACTUAL AND PREDICTED OXYGEN CONSUMPTION VALUES 9
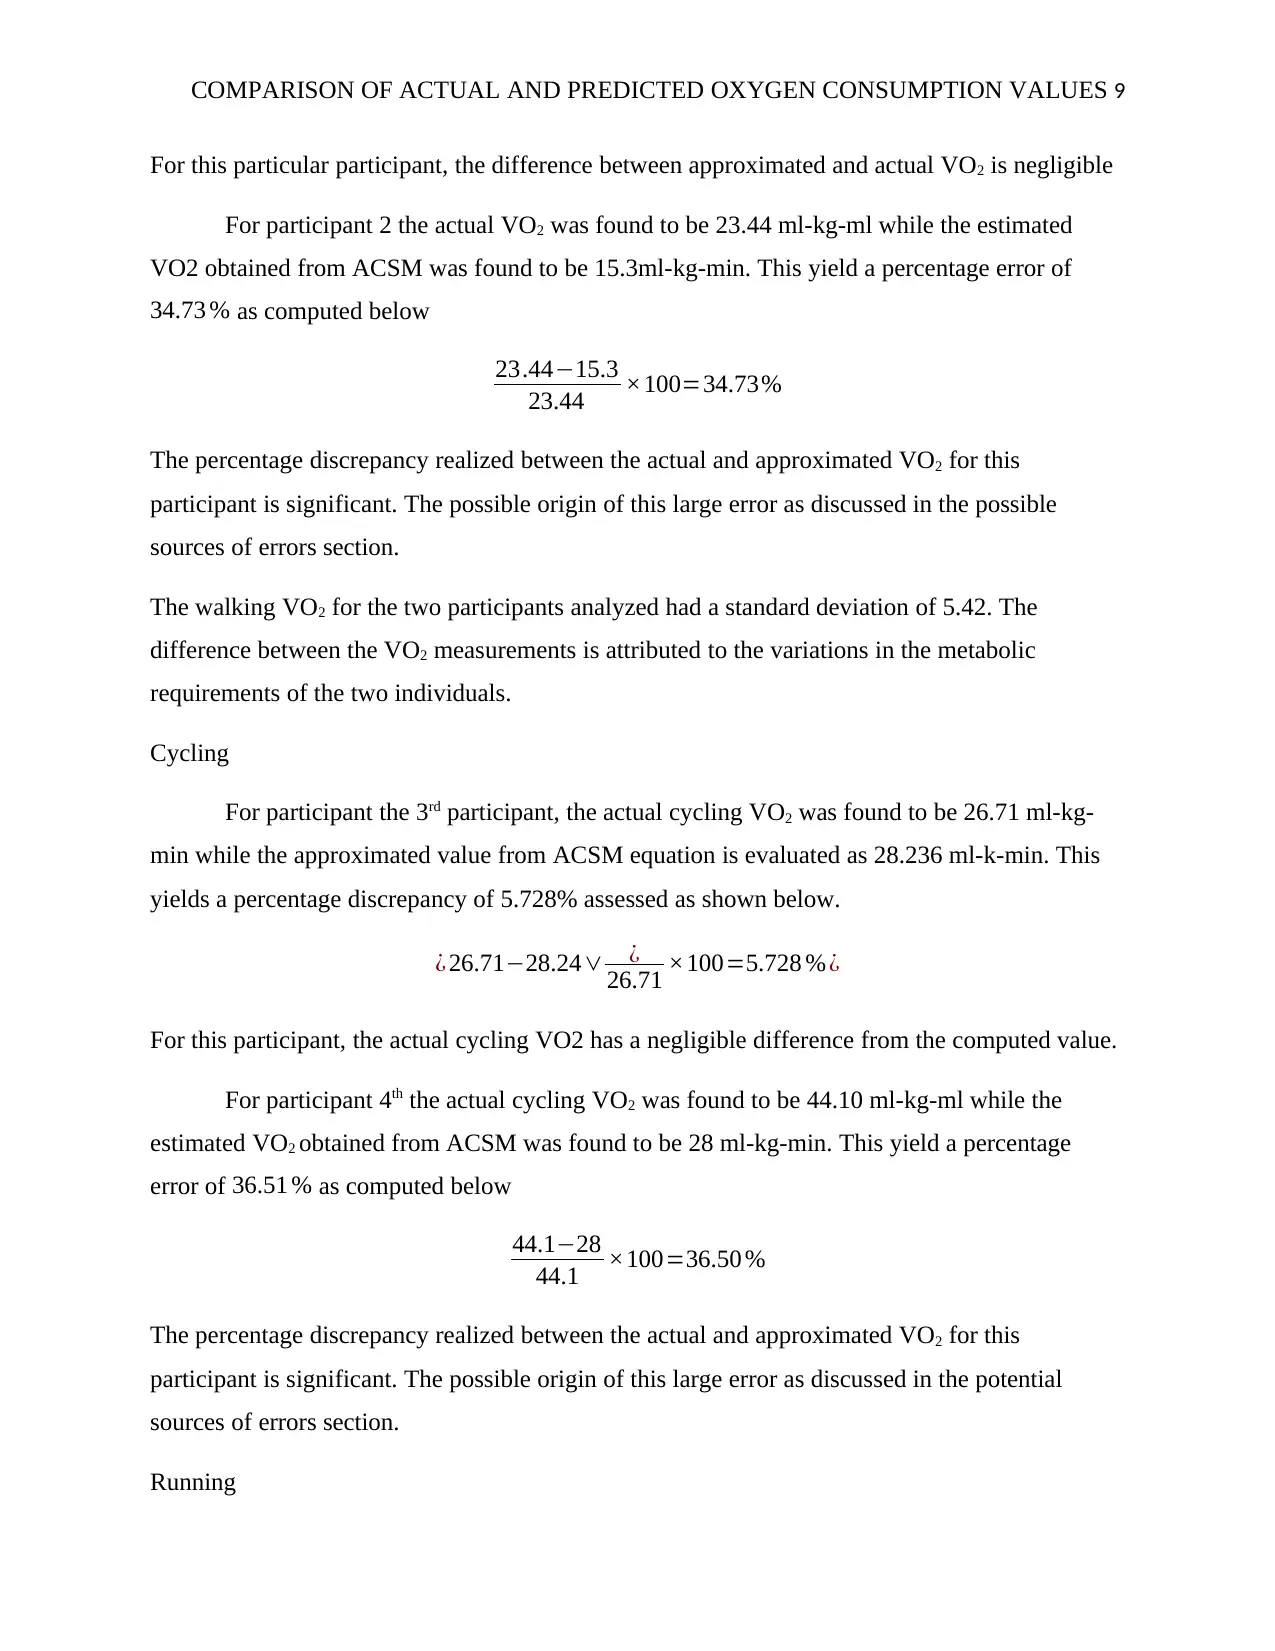
For this particular participant, the difference between approximated and actual VO2 is negligible
For participant 2 the actual VO2 was found to be 23.44 ml-kg-ml while the estimated
VO2 obtained from ACSM was found to be 15.3ml-kg-min. This yield a percentage error of
34.73 % as computed below
23.44−15.3
23.44 ×100=34.73%
The percentage discrepancy realized between the actual and approximated VO2 for this
participant is significant. The possible origin of this large error as discussed in the possible
sources of errors section.
The walking VO2 for the two participants analyzed had a standard deviation of 5.42. The
difference between the VO2 measurements is attributed to the variations in the metabolic
requirements of the two individuals.
Cycling
For participant the 3rd participant, the actual cycling VO2 was found to be 26.71 ml-kg-
min while the approximated value from ACSM equation is evaluated as 28.236 ml-k-min. This
yields a percentage discrepancy of 5.728% assessed as shown below.
¿ 26.71−28.24∨ ¿
26.71 ×100=5.728 % ¿
For this participant, the actual cycling VO2 has a negligible difference from the computed value.
For participant 4th the actual cycling VO2 was found to be 44.10 ml-kg-ml while the
estimated VO2 obtained from ACSM was found to be 28 ml-kg-min. This yield a percentage
error of 36.51 % as computed below
44.1−28
44.1 ×100=36.50 %
The percentage discrepancy realized between the actual and approximated VO2 for this
participant is significant. The possible origin of this large error as discussed in the potential
sources of errors section.
Running
⊘ This is a preview!⊘
Do you want full access?
Subscribe today to unlock all pages.
Trusted by 1+ million students worldwide
COMPARISON OF ACTUAL AND PREDICTED OXYGEN CONSUMPTION VALUES 10
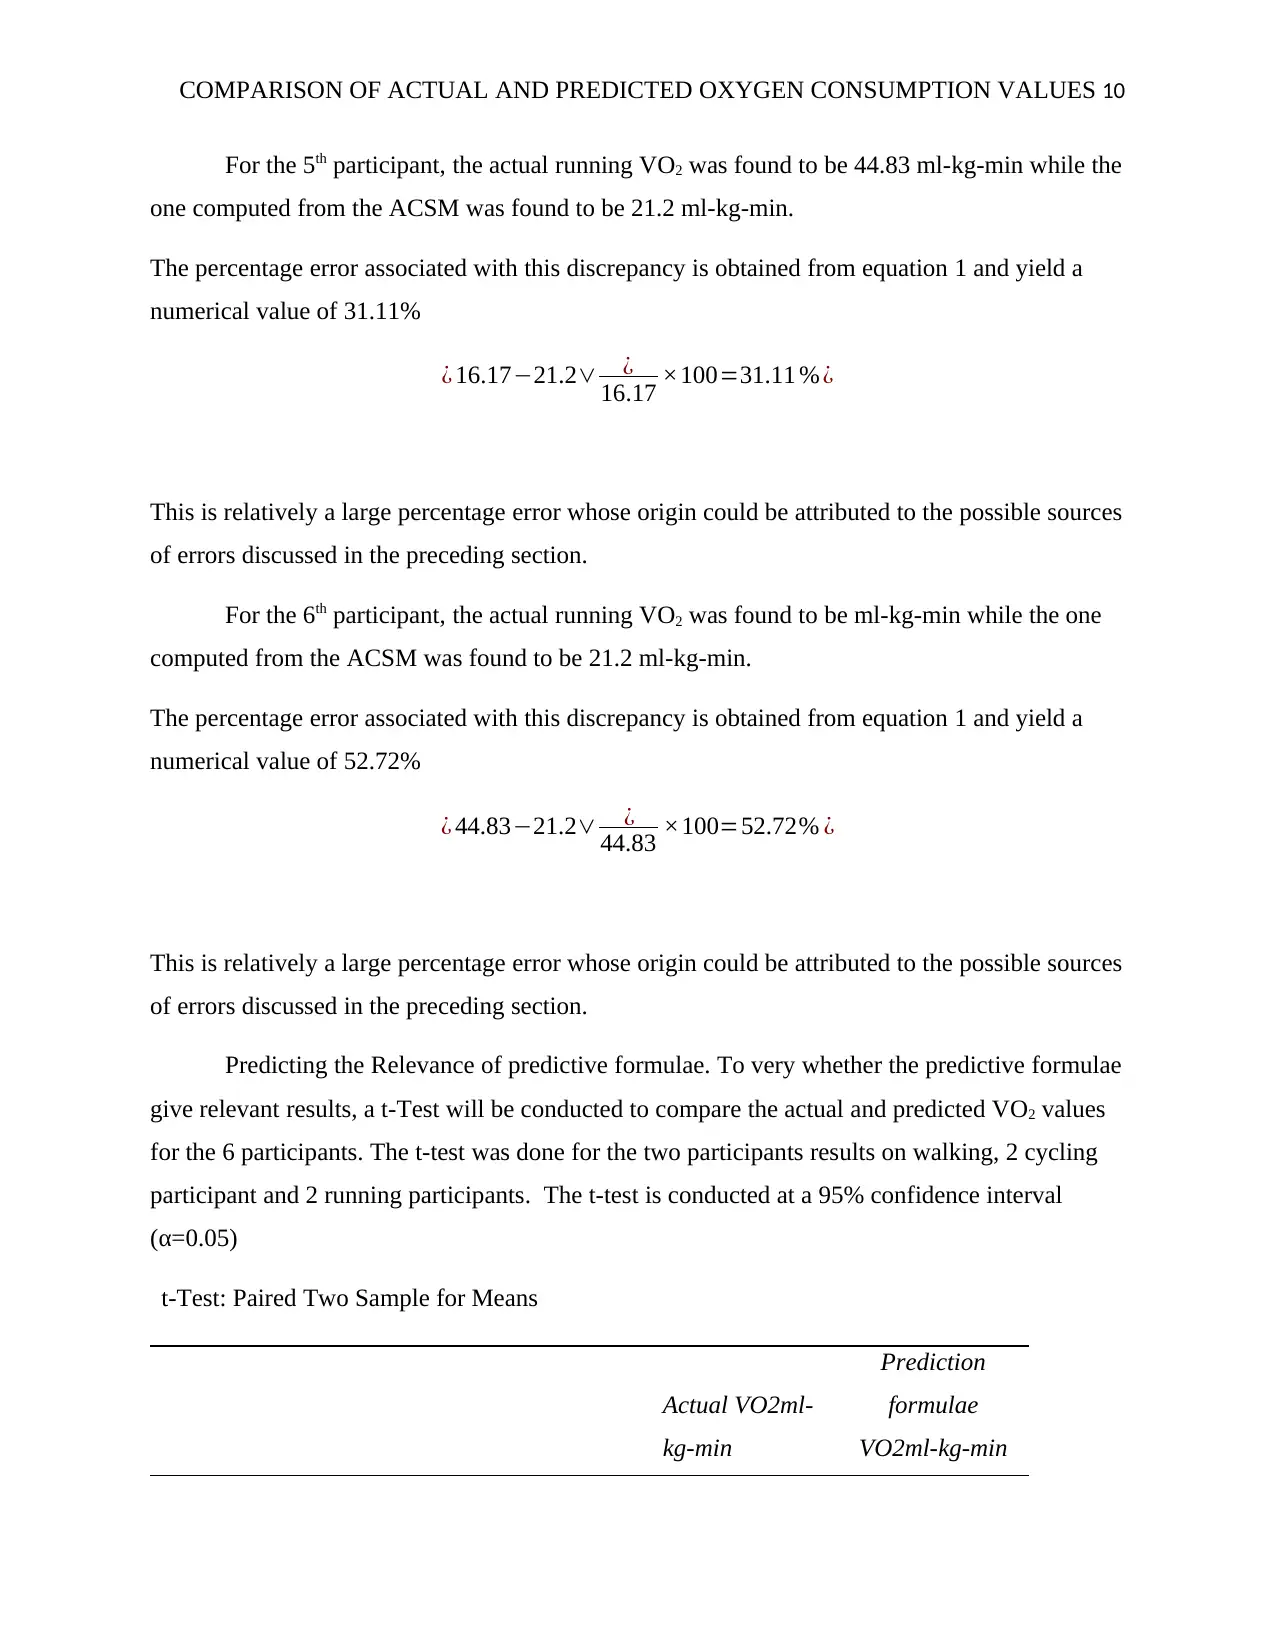
For the 5th participant, the actual running VO2 was found to be 44.83 ml-kg-min while the
one computed from the ACSM was found to be 21.2 ml-kg-min.
The percentage error associated with this discrepancy is obtained from equation 1 and yield a
numerical value of 31.11%
¿ 16.17−21.2∨ ¿
16.17 ×100=31.11 % ¿
This is relatively a large percentage error whose origin could be attributed to the possible sources
of errors discussed in the preceding section.
For the 6th participant, the actual running VO2 was found to be ml-kg-min while the one
computed from the ACSM was found to be 21.2 ml-kg-min.
The percentage error associated with this discrepancy is obtained from equation 1 and yield a
numerical value of 52.72%
¿ 44.83−21.2∨ ¿
44.83 ×100=52.72% ¿
This is relatively a large percentage error whose origin could be attributed to the possible sources
of errors discussed in the preceding section.
Predicting the Relevance of predictive formulae. To very whether the predictive formulae
give relevant results, a t-Test will be conducted to compare the actual and predicted VO2 values
for the 6 participants. The t-test was done for the two participants results on walking, 2 cycling
participant and 2 running participants. The t-test is conducted at a 95% confidence interval
(α=0.05)
t-Test: Paired Two Sample for Means
Actual VO2ml-
kg-min
Prediction
formulae
VO2ml-kg-min
Paraphrase This Document
Need a fresh take? Get an instant paraphrase of this document with our AI Paraphraser
COMPARISON OF ACTUAL AND PREDICTED OXYGEN CONSUMPTION VALUES 11
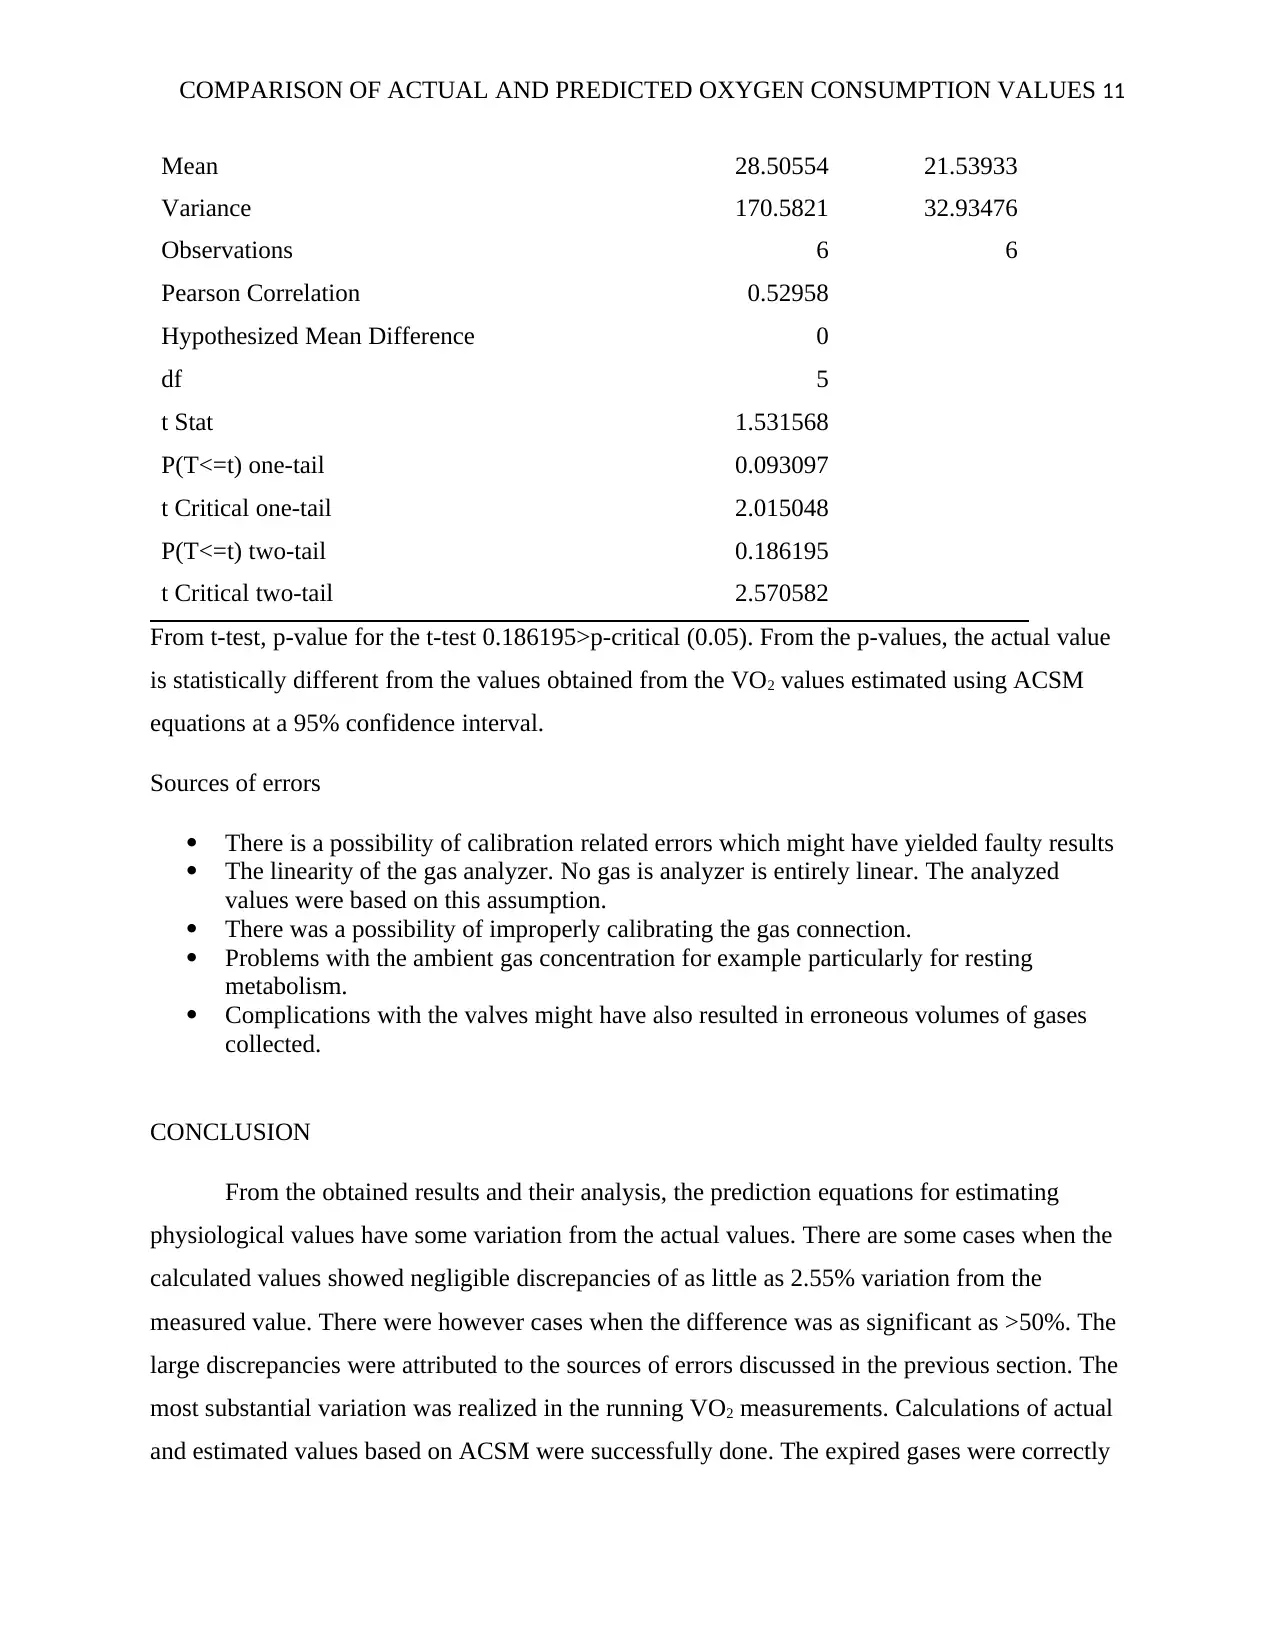
Mean 28.50554 21.53933
Variance 170.5821 32.93476
Observations 6 6
Pearson Correlation 0.52958
Hypothesized Mean Difference 0
df 5
t Stat 1.531568
P(T<=t) one-tail 0.093097
t Critical one-tail 2.015048
P(T<=t) two-tail 0.186195
t Critical two-tail 2.570582
From t-test, p-value for the t-test 0.186195>p-critical (0.05). From the p-values, the actual value
is statistically different from the values obtained from the VO2 values estimated using ACSM
equations at a 95% confidence interval.
Sources of errors
There is a possibility of calibration related errors which might have yielded faulty results
The linearity of the gas analyzer. No gas is analyzer is entirely linear. The analyzed
values were based on this assumption.
There was a possibility of improperly calibrating the gas connection.
Problems with the ambient gas concentration for example particularly for resting
metabolism.
Complications with the valves might have also resulted in erroneous volumes of gases
collected.
CONCLUSION
From the obtained results and their analysis, the prediction equations for estimating
physiological values have some variation from the actual values. There are some cases when the
calculated values showed negligible discrepancies of as little as 2.55% variation from the
measured value. There were however cases when the difference was as significant as >50%. The
large discrepancies were attributed to the sources of errors discussed in the previous section. The
most substantial variation was realized in the running VO2 measurements. Calculations of actual
and estimated values based on ACSM were successfully done. The expired gases were correctly
COMPARISON OF ACTUAL AND PREDICTED OXYGEN CONSUMPTION VALUES 12
collected, and the content analyzed for the computation of actual VO2 making. The experiment
was thus a success because all the experimental objectives were met.
References
Houlihan, B., & Malcolm, D. (2015). Sport and society: a student introduction. Sage.
collected, and the content analyzed for the computation of actual VO2 making. The experiment
was thus a success because all the experimental objectives were met.
References
Houlihan, B., & Malcolm, D. (2015). Sport and society: a student introduction. Sage.
⊘ This is a preview!⊘
Do you want full access?
Subscribe today to unlock all pages.
Trusted by 1+ million students worldwide
1 out of 13

Your All-in-One AI-Powered Toolkit for Academic Success.
+13062052269
info@desklib.com
Available 24*7 on WhatsApp / Email
![[object Object]](/_next/static/media/star-bottom.7253800d.svg)
Unlock your academic potential
Copyright © 2020–2026 A2Z Services. All Rights Reserved. Developed and managed by ZUCOL.