Vodafone PLC: Financial Performance, Ratio Analysis, and Comparison
VerifiedAdded on 2022/11/26
|11
|2538
|416
Report
AI Summary
This report presents a comprehensive financial analysis of Vodafone PLC, examining its performance from 2014 to 2016 using various financial ratios. The analysis covers profitability, liquidity, solvency, and efficiency ratios, highlighting trends and key insights into Vodafone's financial health. The report includes a detailed breakdown of Vodafone's financial statements, calculating and interpreting ratios such as ROCE, ROS, current ratio, gearing ratio, and inventory days. A comparative analysis of Vodafone's performance against Deutsche Telekom AG and the broader telecom industry is also conducted, discussing the causes of any deviations and differences in the ratios. The report concludes with an assessment of Vodafone's overall financial performance, identifying areas of strength and weakness and offering insights into potential market opportunities.
Running head: MBA ASSIGNMENT
MBA Assignment
Name of the University
Name of Student
Authors’ Note
MBA Assignment
Name of the University
Name of Student
Authors’ Note
Paraphrase This Document
Need a fresh take? Get an instant paraphrase of this document with our AI Paraphraser
2MBA ASSIGNMENT
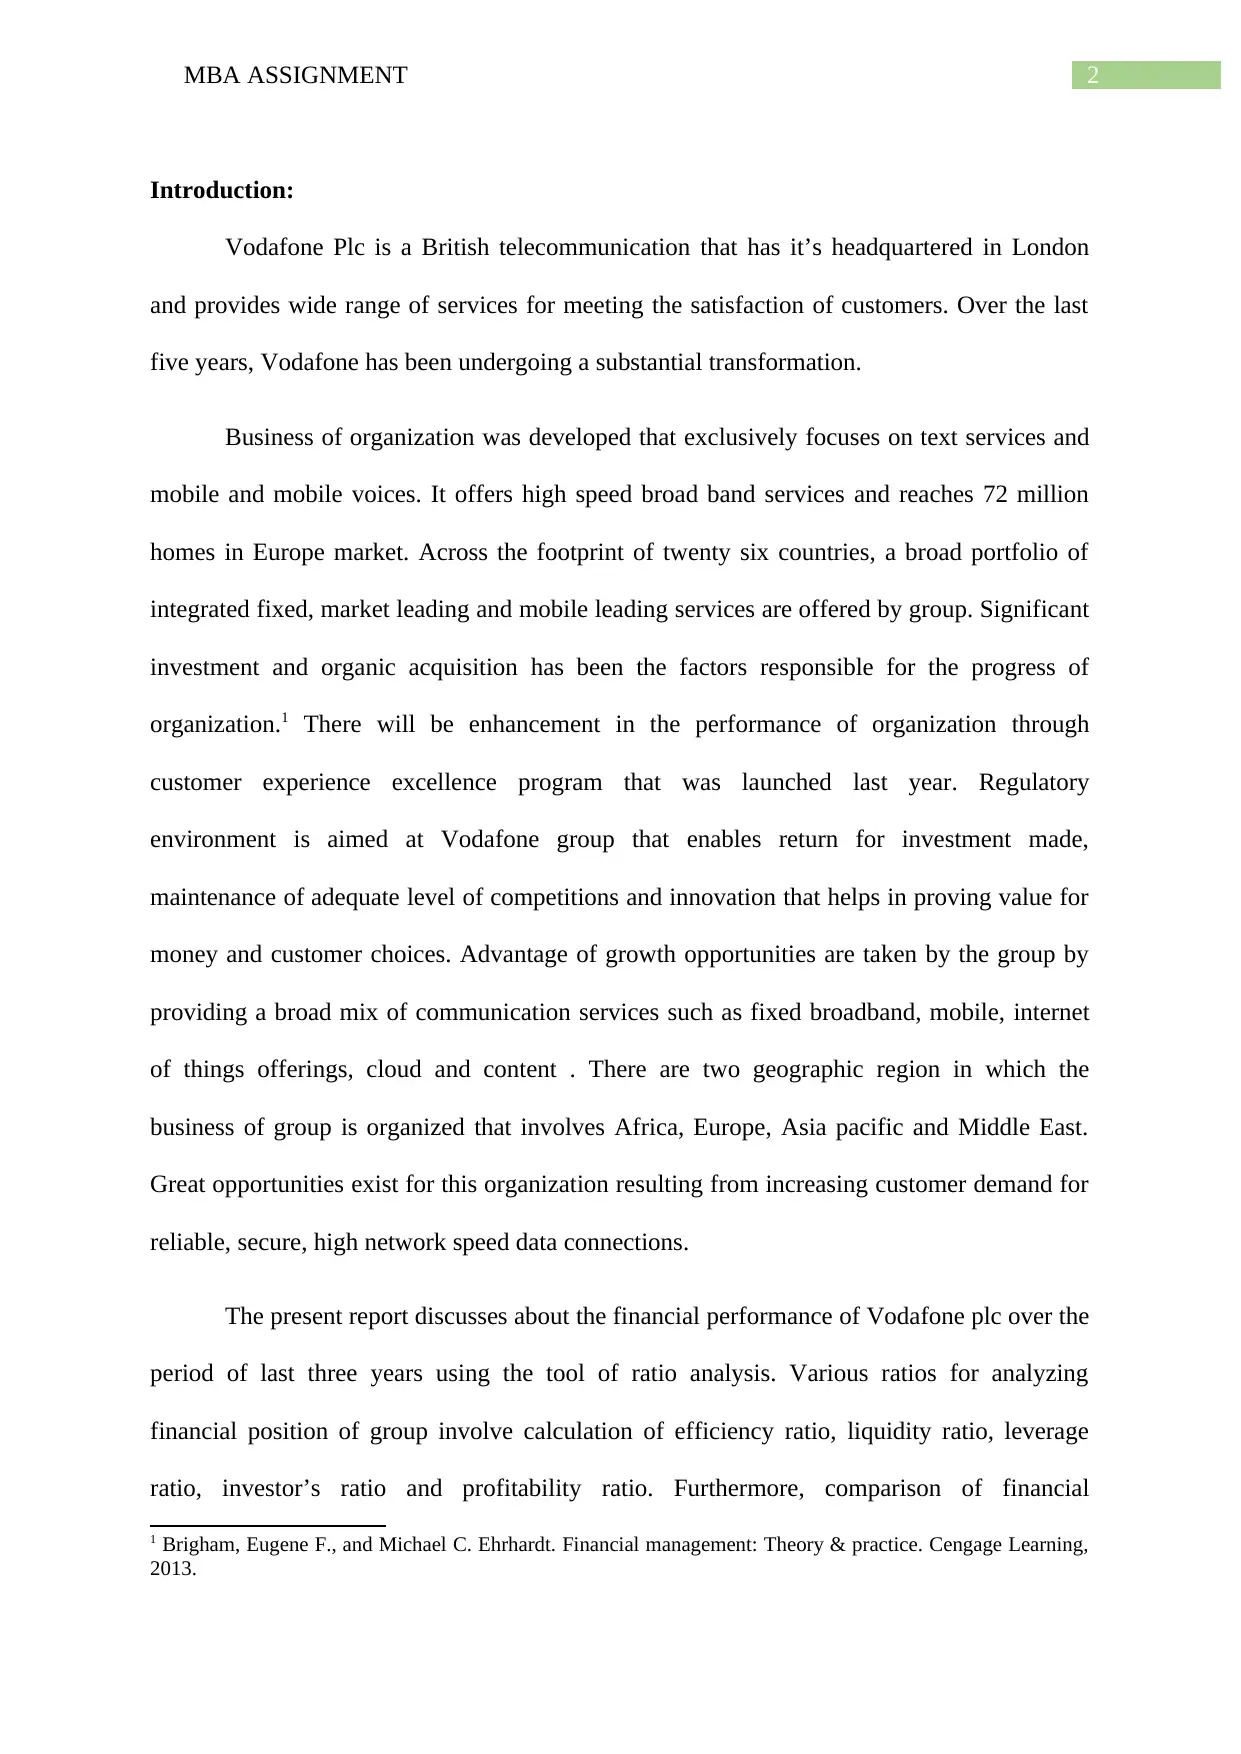
Introduction:
Vodafone Plc is a British telecommunication that has it’s headquartered in London
and provides wide range of services for meeting the satisfaction of customers. Over the last
five years, Vodafone has been undergoing a substantial transformation.
Business of organization was developed that exclusively focuses on text services and
mobile and mobile voices. It offers high speed broad band services and reaches 72 million
homes in Europe market. Across the footprint of twenty six countries, a broad portfolio of
integrated fixed, market leading and mobile leading services are offered by group. Significant
investment and organic acquisition has been the factors responsible for the progress of
organization.1 There will be enhancement in the performance of organization through
customer experience excellence program that was launched last year. Regulatory
environment is aimed at Vodafone group that enables return for investment made,
maintenance of adequate level of competitions and innovation that helps in proving value for
money and customer choices. Advantage of growth opportunities are taken by the group by
providing a broad mix of communication services such as fixed broadband, mobile, internet
of things offerings, cloud and content . There are two geographic region in which the
business of group is organized that involves Africa, Europe, Asia pacific and Middle East.
Great opportunities exist for this organization resulting from increasing customer demand for
reliable, secure, high network speed data connections.
The present report discusses about the financial performance of Vodafone plc over the
period of last three years using the tool of ratio analysis. Various ratios for analyzing
financial position of group involve calculation of efficiency ratio, liquidity ratio, leverage
ratio, investor’s ratio and profitability ratio. Furthermore, comparison of financial
1 Brigham, Eugene F., and Michael C. Ehrhardt. Financial management: Theory & practice. Cengage Learning,
2013.
3MBA ASSIGNMENT
performance of Vodafone Plc with Deutsche telecom AG and telecom industry have been
demonstrated in the report. The possible causes for deviation and differences in the ratio have
been discussed.
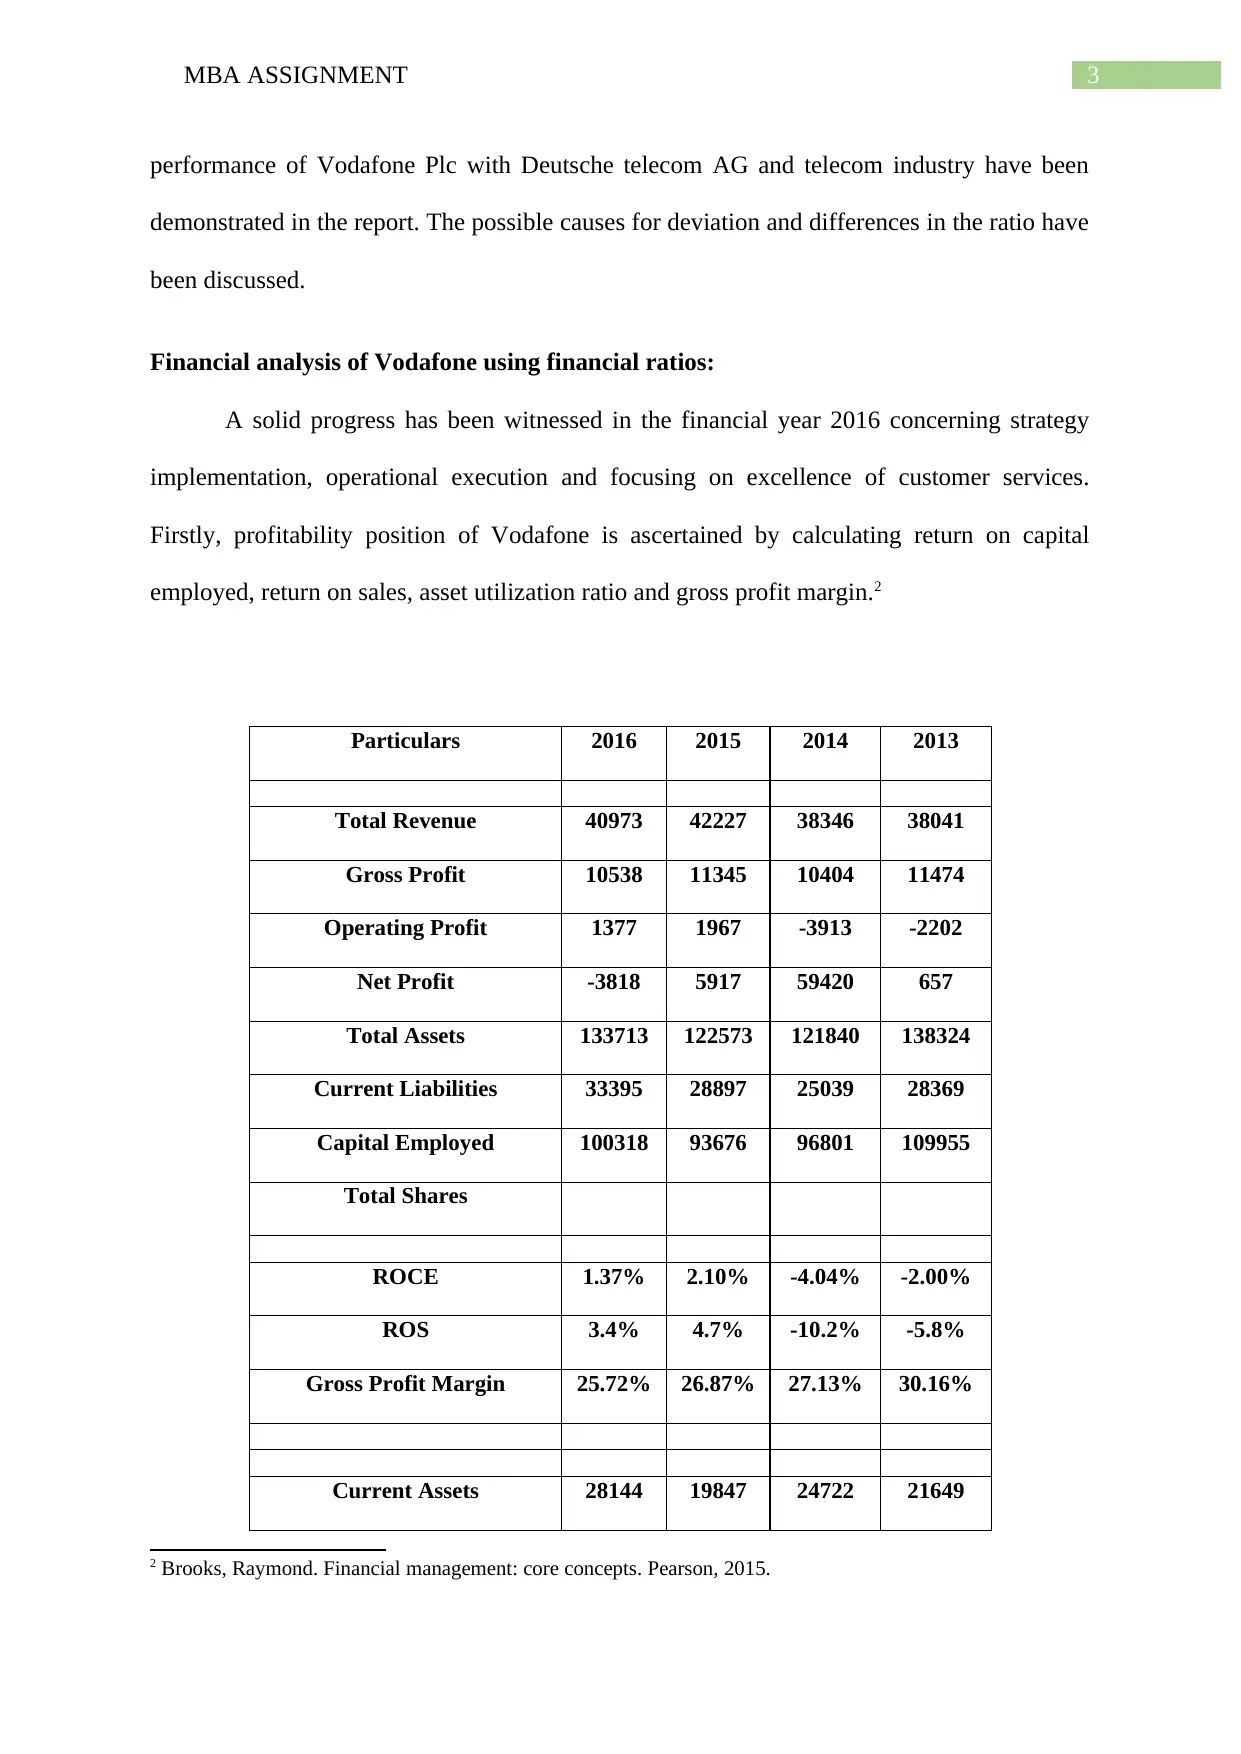
Financial analysis of Vodafone using financial ratios:
A solid progress has been witnessed in the financial year 2016 concerning strategy
implementation, operational execution and focusing on excellence of customer services.
Firstly, profitability position of Vodafone is ascertained by calculating return on capital
employed, return on sales, asset utilization ratio and gross profit margin.2
Particulars 2016 2015 2014 2013
Total Revenue 40973 42227 38346 38041
Gross Profit 10538 11345 10404 11474
Operating Profit 1377 1967 -3913 -2202
Net Profit -3818 5917 59420 657
Total Assets 133713 122573 121840 138324
Current Liabilities 33395 28897 25039 28369
Capital Employed 100318 93676 96801 109955
Total Shares
ROCE 1.37% 2.10% -4.04% -2.00%
ROS 3.4% 4.7% -10.2% -5.8%
Gross Profit Margin 25.72% 26.87% 27.13% 30.16%
Current Assets 28144 19847 24722 21649
2 Brooks, Raymond. Financial management: core concepts. Pearson, 2015.
performance of Vodafone Plc with Deutsche telecom AG and telecom industry have been
demonstrated in the report. The possible causes for deviation and differences in the ratio have
been discussed.
Financial analysis of Vodafone using financial ratios:
A solid progress has been witnessed in the financial year 2016 concerning strategy
implementation, operational execution and focusing on excellence of customer services.
Firstly, profitability position of Vodafone is ascertained by calculating return on capital
employed, return on sales, asset utilization ratio and gross profit margin.2
Particulars 2016 2015 2014 2013
Total Revenue 40973 42227 38346 38041
Gross Profit 10538 11345 10404 11474
Operating Profit 1377 1967 -3913 -2202
Net Profit -3818 5917 59420 657
Total Assets 133713 122573 121840 138324
Current Liabilities 33395 28897 25039 28369
Capital Employed 100318 93676 96801 109955
Total Shares
ROCE 1.37% 2.10% -4.04% -2.00%
ROS 3.4% 4.7% -10.2% -5.8%
Gross Profit Margin 25.72% 26.87% 27.13% 30.16%
Current Assets 28144 19847 24722 21649
2 Brooks, Raymond. Financial management: core concepts. Pearson, 2015.
⊘ This is a preview!⊘
Do you want full access?
Subscribe today to unlock all pages.
Trusted by 1+ million students worldwide
4MBA ASSIGNMENT
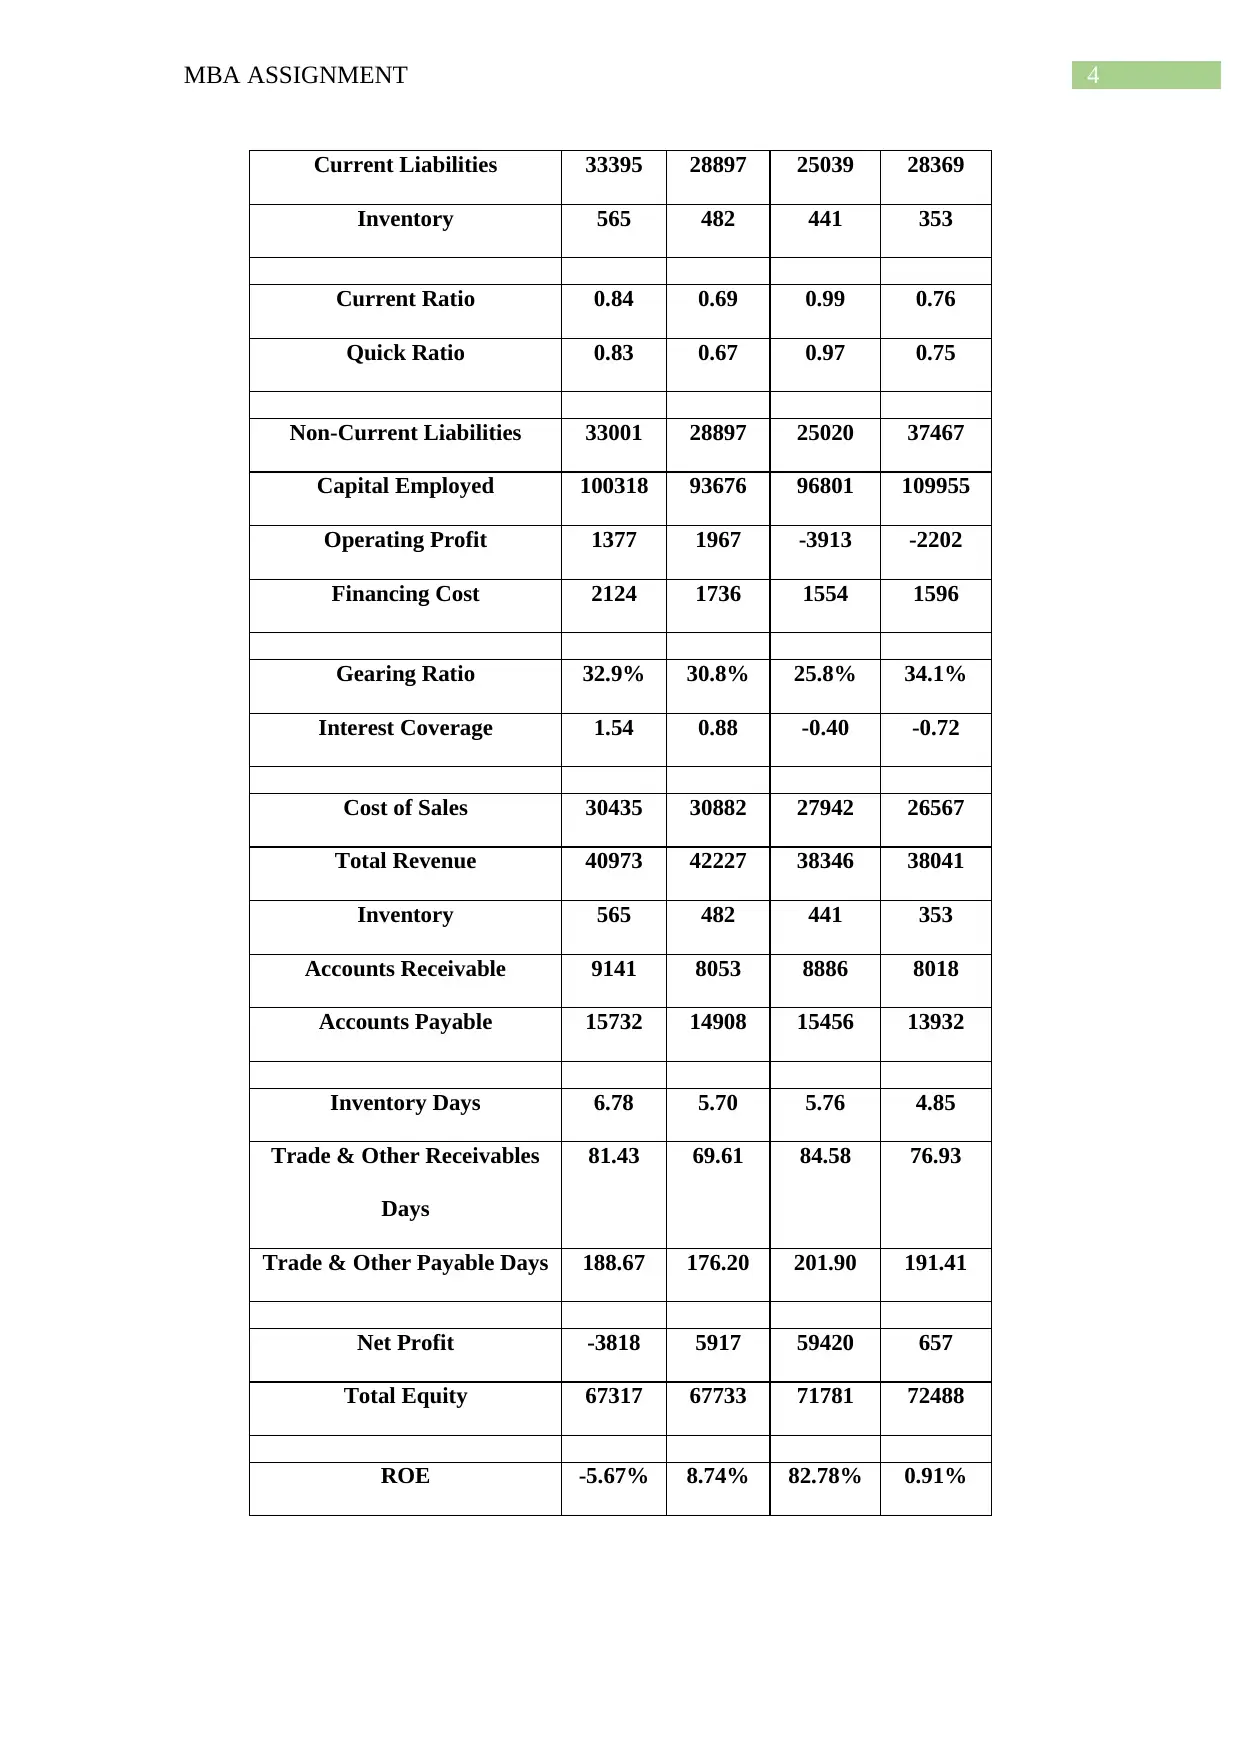
Current Liabilities 33395 28897 25039 28369
Inventory 565 482 441 353
Current Ratio 0.84 0.69 0.99 0.76
Quick Ratio 0.83 0.67 0.97 0.75
Non-Current Liabilities 33001 28897 25020 37467
Capital Employed 100318 93676 96801 109955
Operating Profit 1377 1967 -3913 -2202
Financing Cost 2124 1736 1554 1596
Gearing Ratio 32.9% 30.8% 25.8% 34.1%
Interest Coverage 1.54 0.88 -0.40 -0.72
Cost of Sales 30435 30882 27942 26567
Total Revenue 40973 42227 38346 38041
Inventory 565 482 441 353
Accounts Receivable 9141 8053 8886 8018
Accounts Payable 15732 14908 15456 13932
Inventory Days 6.78 5.70 5.76 4.85
Trade & Other Receivables
Days
81.43 69.61 84.58 76.93
Trade & Other Payable Days 188.67 176.20 201.90 191.41
Net Profit -3818 5917 59420 657
Total Equity 67317 67733 71781 72488
ROE -5.67% 8.74% 82.78% 0.91%
Paraphrase This Document
Need a fresh take? Get an instant paraphrase of this document with our AI Paraphraser
5MBA ASSIGNMENT
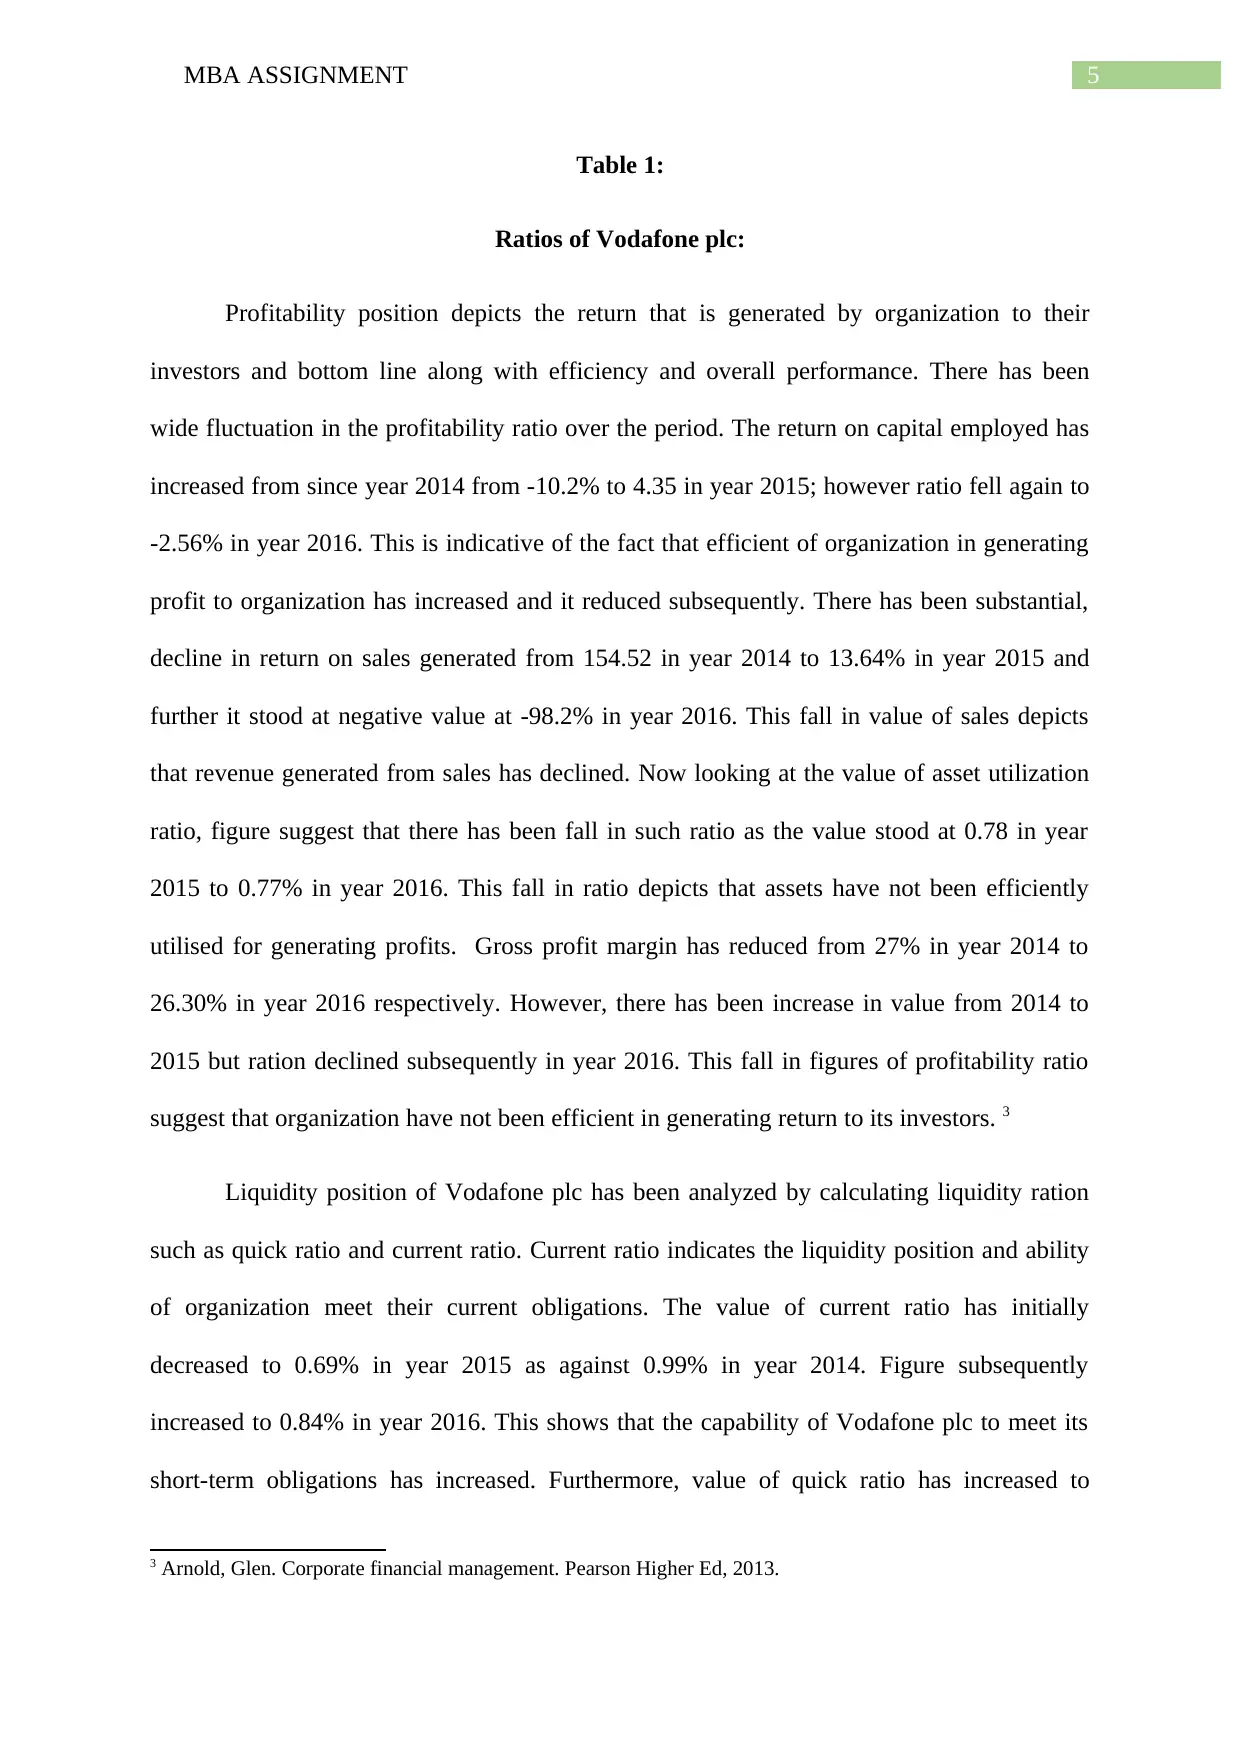
Table 1:
Ratios of Vodafone plc:
Profitability position depicts the return that is generated by organization to their
investors and bottom line along with efficiency and overall performance. There has been
wide fluctuation in the profitability ratio over the period. The return on capital employed has
increased from since year 2014 from -10.2% to 4.35 in year 2015; however ratio fell again to
-2.56% in year 2016. This is indicative of the fact that efficient of organization in generating
profit to organization has increased and it reduced subsequently. There has been substantial,
decline in return on sales generated from 154.52 in year 2014 to 13.64% in year 2015 and
further it stood at negative value at -98.2% in year 2016. This fall in value of sales depicts
that revenue generated from sales has declined. Now looking at the value of asset utilization
ratio, figure suggest that there has been fall in such ratio as the value stood at 0.78 in year
2015 to 0.77% in year 2016. This fall in ratio depicts that assets have not been efficiently
utilised for generating profits. Gross profit margin has reduced from 27% in year 2014 to
26.30% in year 2016 respectively. However, there has been increase in value from 2014 to
2015 but ration declined subsequently in year 2016. This fall in figures of profitability ratio
suggest that organization have not been efficient in generating return to its investors. 3
Liquidity position of Vodafone plc has been analyzed by calculating liquidity ration
such as quick ratio and current ratio. Current ratio indicates the liquidity position and ability
of organization meet their current obligations. The value of current ratio has initially
decreased to 0.69% in year 2015 as against 0.99% in year 2014. Figure subsequently
increased to 0.84% in year 2016. This shows that the capability of Vodafone plc to meet its
short-term obligations has increased. Furthermore, value of quick ratio has increased to
3 Arnold, Glen. Corporate financial management. Pearson Higher Ed, 2013.
6MBA ASSIGNMENT
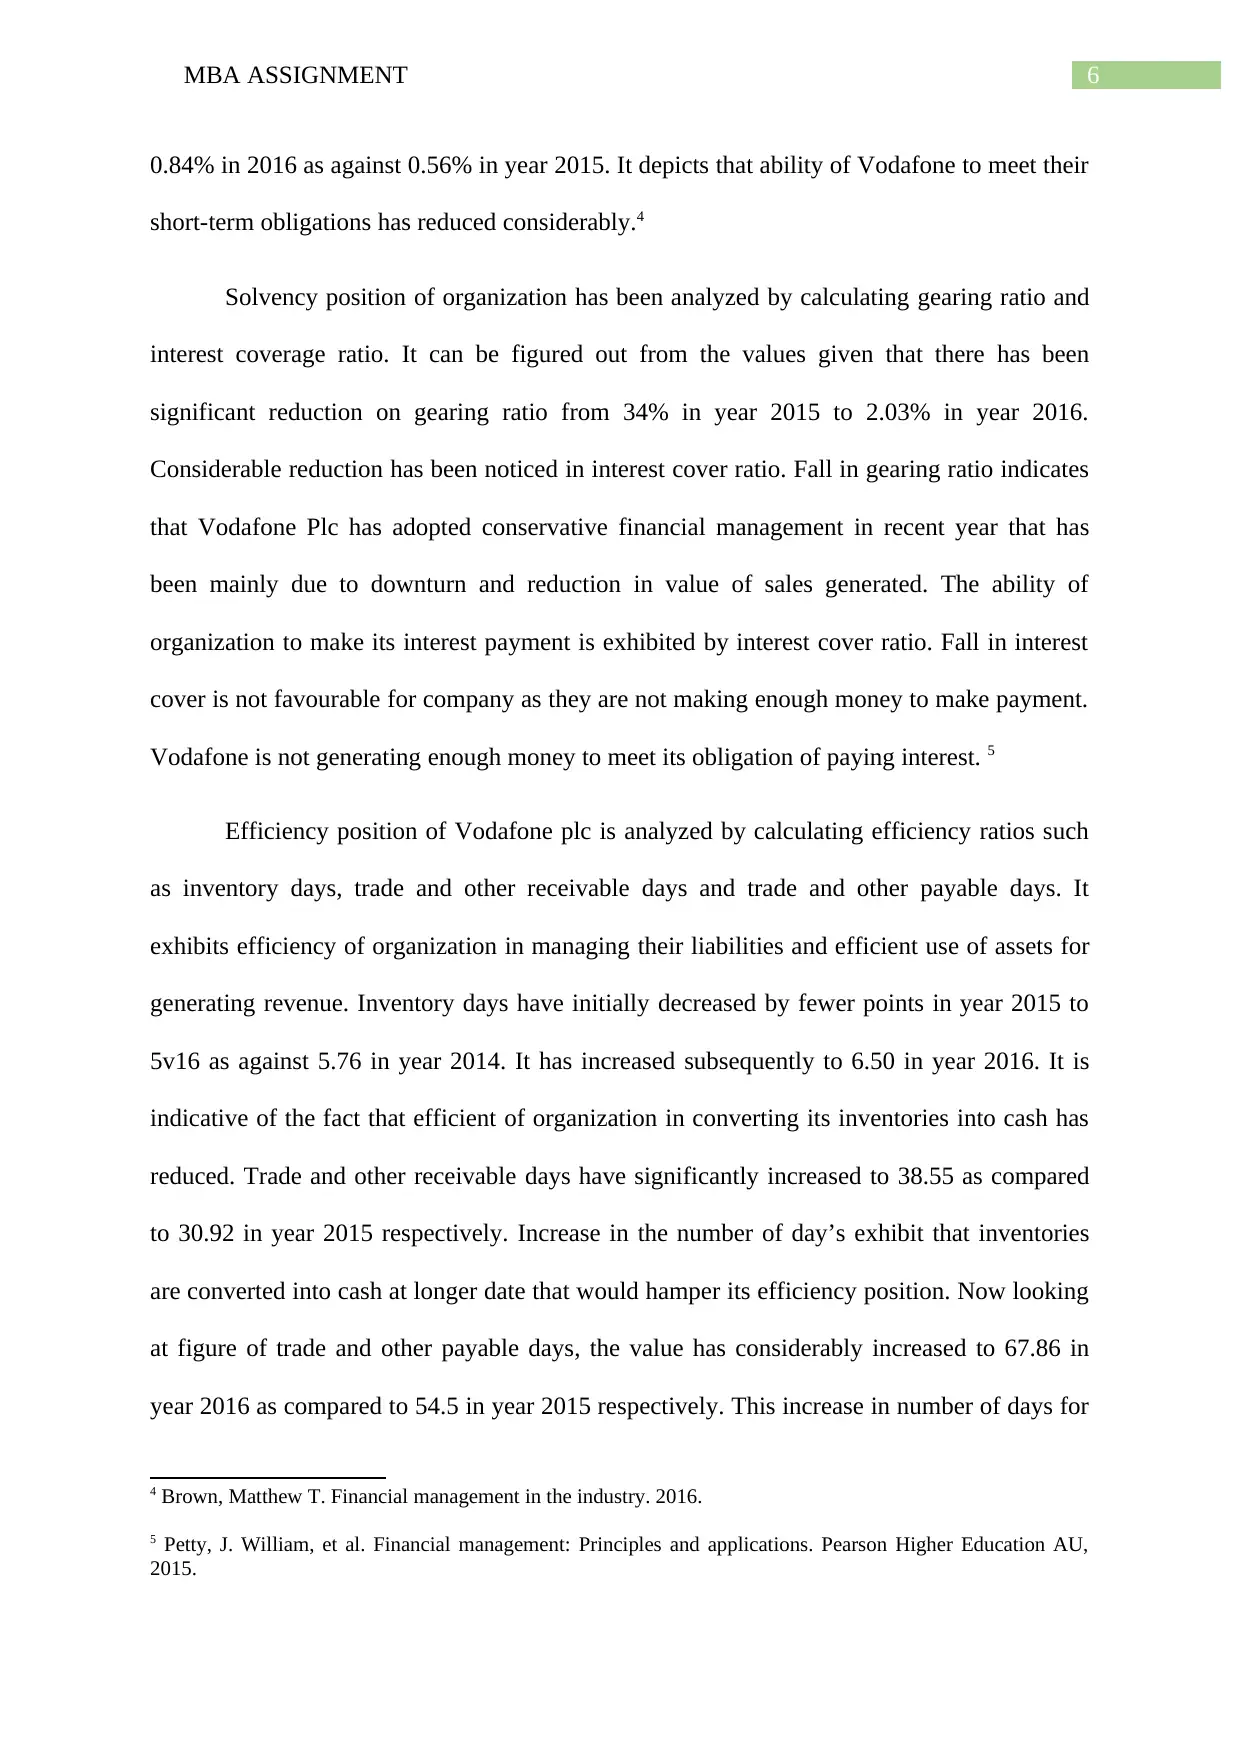
0.84% in 2016 as against 0.56% in year 2015. It depicts that ability of Vodafone to meet their
short-term obligations has reduced considerably.4
Solvency position of organization has been analyzed by calculating gearing ratio and
interest coverage ratio. It can be figured out from the values given that there has been
significant reduction on gearing ratio from 34% in year 2015 to 2.03% in year 2016.
Considerable reduction has been noticed in interest cover ratio. Fall in gearing ratio indicates
that Vodafone Plc has adopted conservative financial management in recent year that has
been mainly due to downturn and reduction in value of sales generated. The ability of
organization to make its interest payment is exhibited by interest cover ratio. Fall in interest
cover is not favourable for company as they are not making enough money to make payment.
Vodafone is not generating enough money to meet its obligation of paying interest. 5
Efficiency position of Vodafone plc is analyzed by calculating efficiency ratios such
as inventory days, trade and other receivable days and trade and other payable days. It
exhibits efficiency of organization in managing their liabilities and efficient use of assets for
generating revenue. Inventory days have initially decreased by fewer points in year 2015 to
5v16 as against 5.76 in year 2014. It has increased subsequently to 6.50 in year 2016. It is
indicative of the fact that efficient of organization in converting its inventories into cash has
reduced. Trade and other receivable days have significantly increased to 38.55 as compared
to 30.92 in year 2015 respectively. Increase in the number of day’s exhibit that inventories
are converted into cash at longer date that would hamper its efficiency position. Now looking
at figure of trade and other payable days, the value has considerably increased to 67.86 in
year 2016 as compared to 54.5 in year 2015 respectively. This increase in number of days for
4 Brown, Matthew T. Financial management in the industry. 2016.
5 Petty, J. William, et al. Financial management: Principles and applications. Pearson Higher Education AU,
2015.
⊘ This is a preview!⊘
Do you want full access?
Subscribe today to unlock all pages.
Trusted by 1+ million students worldwide
7MBA ASSIGNMENT
trade payable Vodafone plc is not generating enough cash for meeting their daily operations.6
7Therefore, from the above analysis, it can be said that overall, efficiency of organization has
declined considerably.
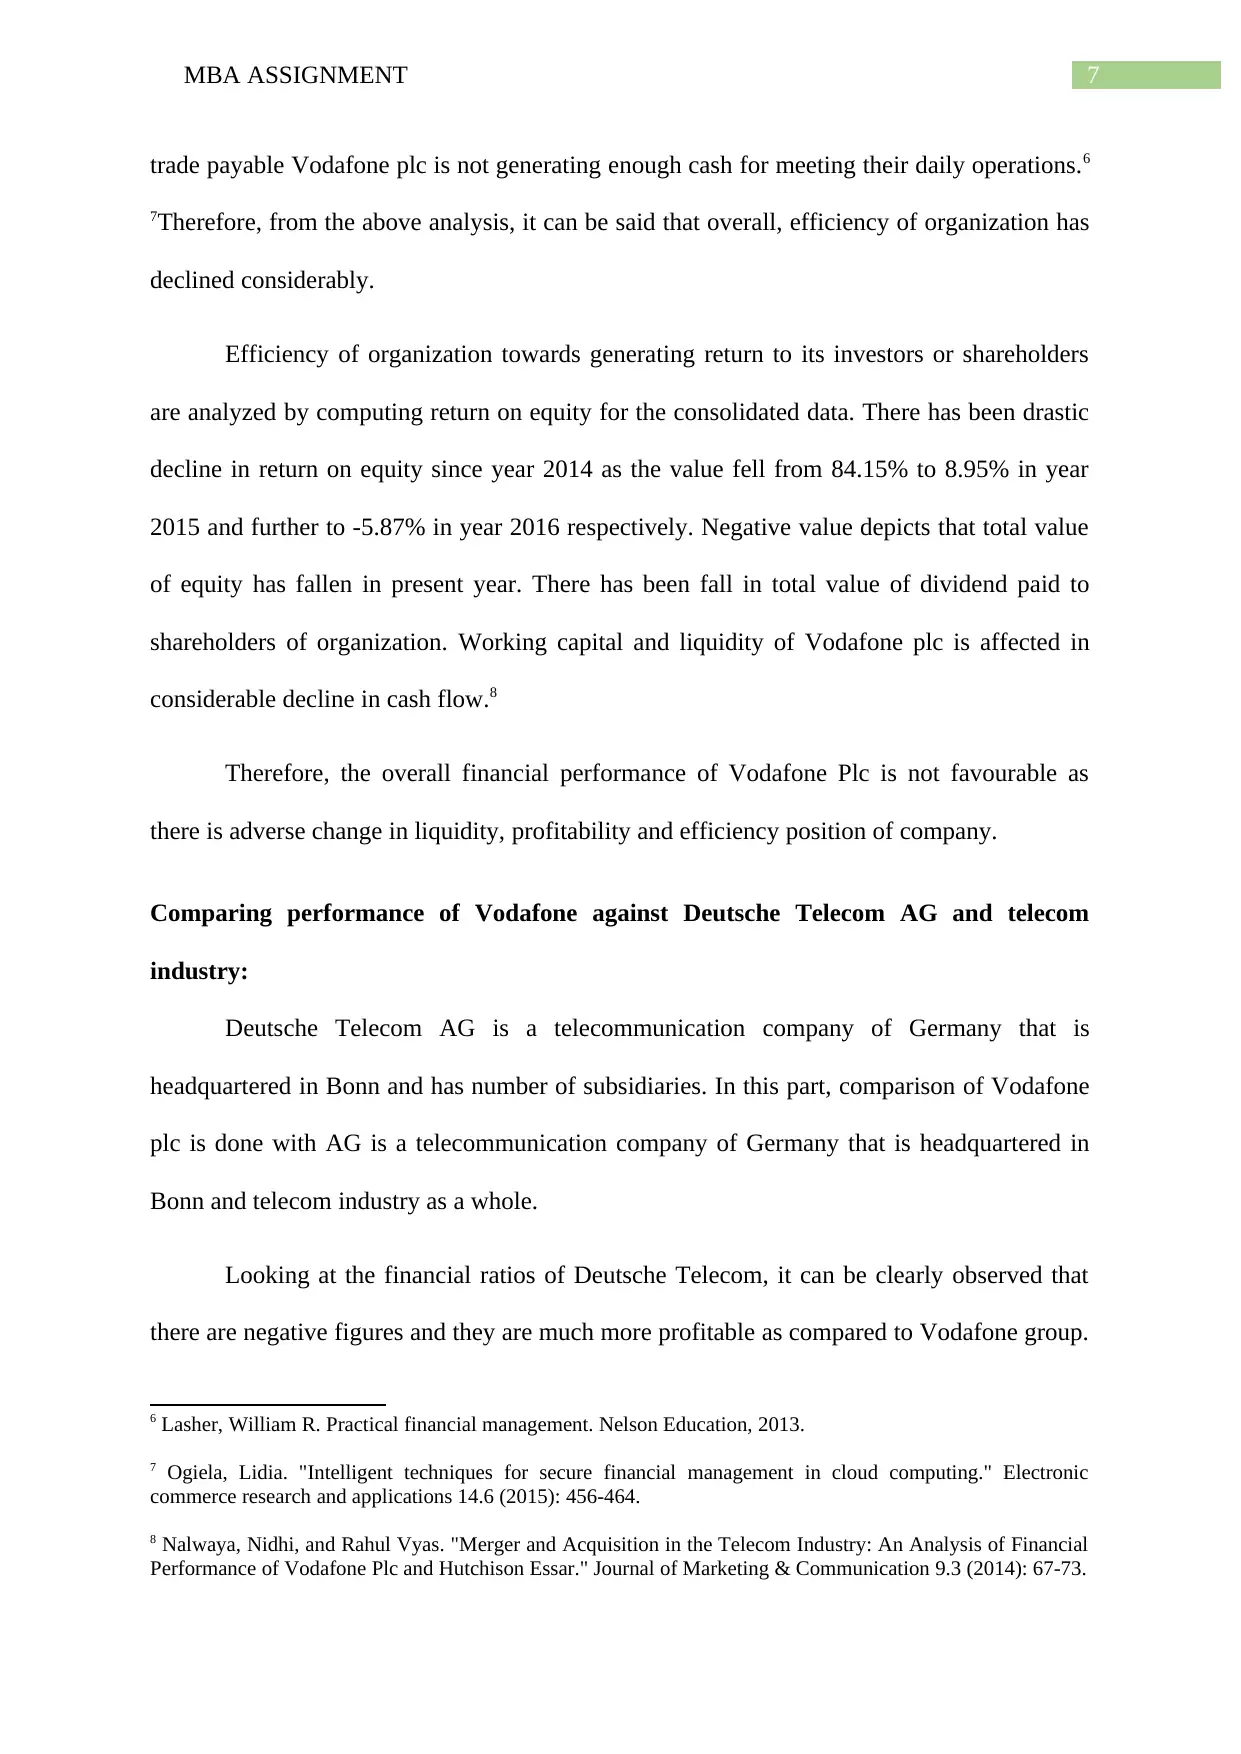
Efficiency of organization towards generating return to its investors or shareholders
are analyzed by computing return on equity for the consolidated data. There has been drastic
decline in return on equity since year 2014 as the value fell from 84.15% to 8.95% in year
2015 and further to -5.87% in year 2016 respectively. Negative value depicts that total value
of equity has fallen in present year. There has been fall in total value of dividend paid to
shareholders of organization. Working capital and liquidity of Vodafone plc is affected in
considerable decline in cash flow.8
Therefore, the overall financial performance of Vodafone Plc is not favourable as
there is adverse change in liquidity, profitability and efficiency position of company.
Comparing performance of Vodafone against Deutsche Telecom AG and telecom
industry:
Deutsche Telecom AG is a telecommunication company of Germany that is
headquartered in Bonn and has number of subsidiaries. In this part, comparison of Vodafone
plc is done with AG is a telecommunication company of Germany that is headquartered in
Bonn and telecom industry as a whole.
Looking at the financial ratios of Deutsche Telecom, it can be clearly observed that
there are negative figures and they are much more profitable as compared to Vodafone group.
6 Lasher, William R. Practical financial management. Nelson Education, 2013.
7 Ogiela, Lidia. "Intelligent techniques for secure financial management in cloud computing." Electronic
commerce research and applications 14.6 (2015): 456-464.
8 Nalwaya, Nidhi, and Rahul Vyas. "Merger and Acquisition in the Telecom Industry: An Analysis of Financial
Performance of Vodafone Plc and Hutchison Essar." Journal of Marketing & Communication 9.3 (2014): 67-73.
trade payable Vodafone plc is not generating enough cash for meeting their daily operations.6
7Therefore, from the above analysis, it can be said that overall, efficiency of organization has
declined considerably.
Efficiency of organization towards generating return to its investors or shareholders
are analyzed by computing return on equity for the consolidated data. There has been drastic
decline in return on equity since year 2014 as the value fell from 84.15% to 8.95% in year
2015 and further to -5.87% in year 2016 respectively. Negative value depicts that total value
of equity has fallen in present year. There has been fall in total value of dividend paid to
shareholders of organization. Working capital and liquidity of Vodafone plc is affected in
considerable decline in cash flow.8
Therefore, the overall financial performance of Vodafone Plc is not favourable as
there is adverse change in liquidity, profitability and efficiency position of company.
Comparing performance of Vodafone against Deutsche Telecom AG and telecom
industry:
Deutsche Telecom AG is a telecommunication company of Germany that is
headquartered in Bonn and has number of subsidiaries. In this part, comparison of Vodafone
plc is done with AG is a telecommunication company of Germany that is headquartered in
Bonn and telecom industry as a whole.
Looking at the financial ratios of Deutsche Telecom, it can be clearly observed that
there are negative figures and they are much more profitable as compared to Vodafone group.
6 Lasher, William R. Practical financial management. Nelson Education, 2013.
7 Ogiela, Lidia. "Intelligent techniques for secure financial management in cloud computing." Electronic
commerce research and applications 14.6 (2015): 456-464.
8 Nalwaya, Nidhi, and Rahul Vyas. "Merger and Acquisition in the Telecom Industry: An Analysis of Financial
Performance of Vodafone Plc and Hutchison Essar." Journal of Marketing & Communication 9.3 (2014): 67-73.
Paraphrase This Document
Need a fresh take? Get an instant paraphrase of this document with our AI Paraphraser
8MBA ASSIGNMENT
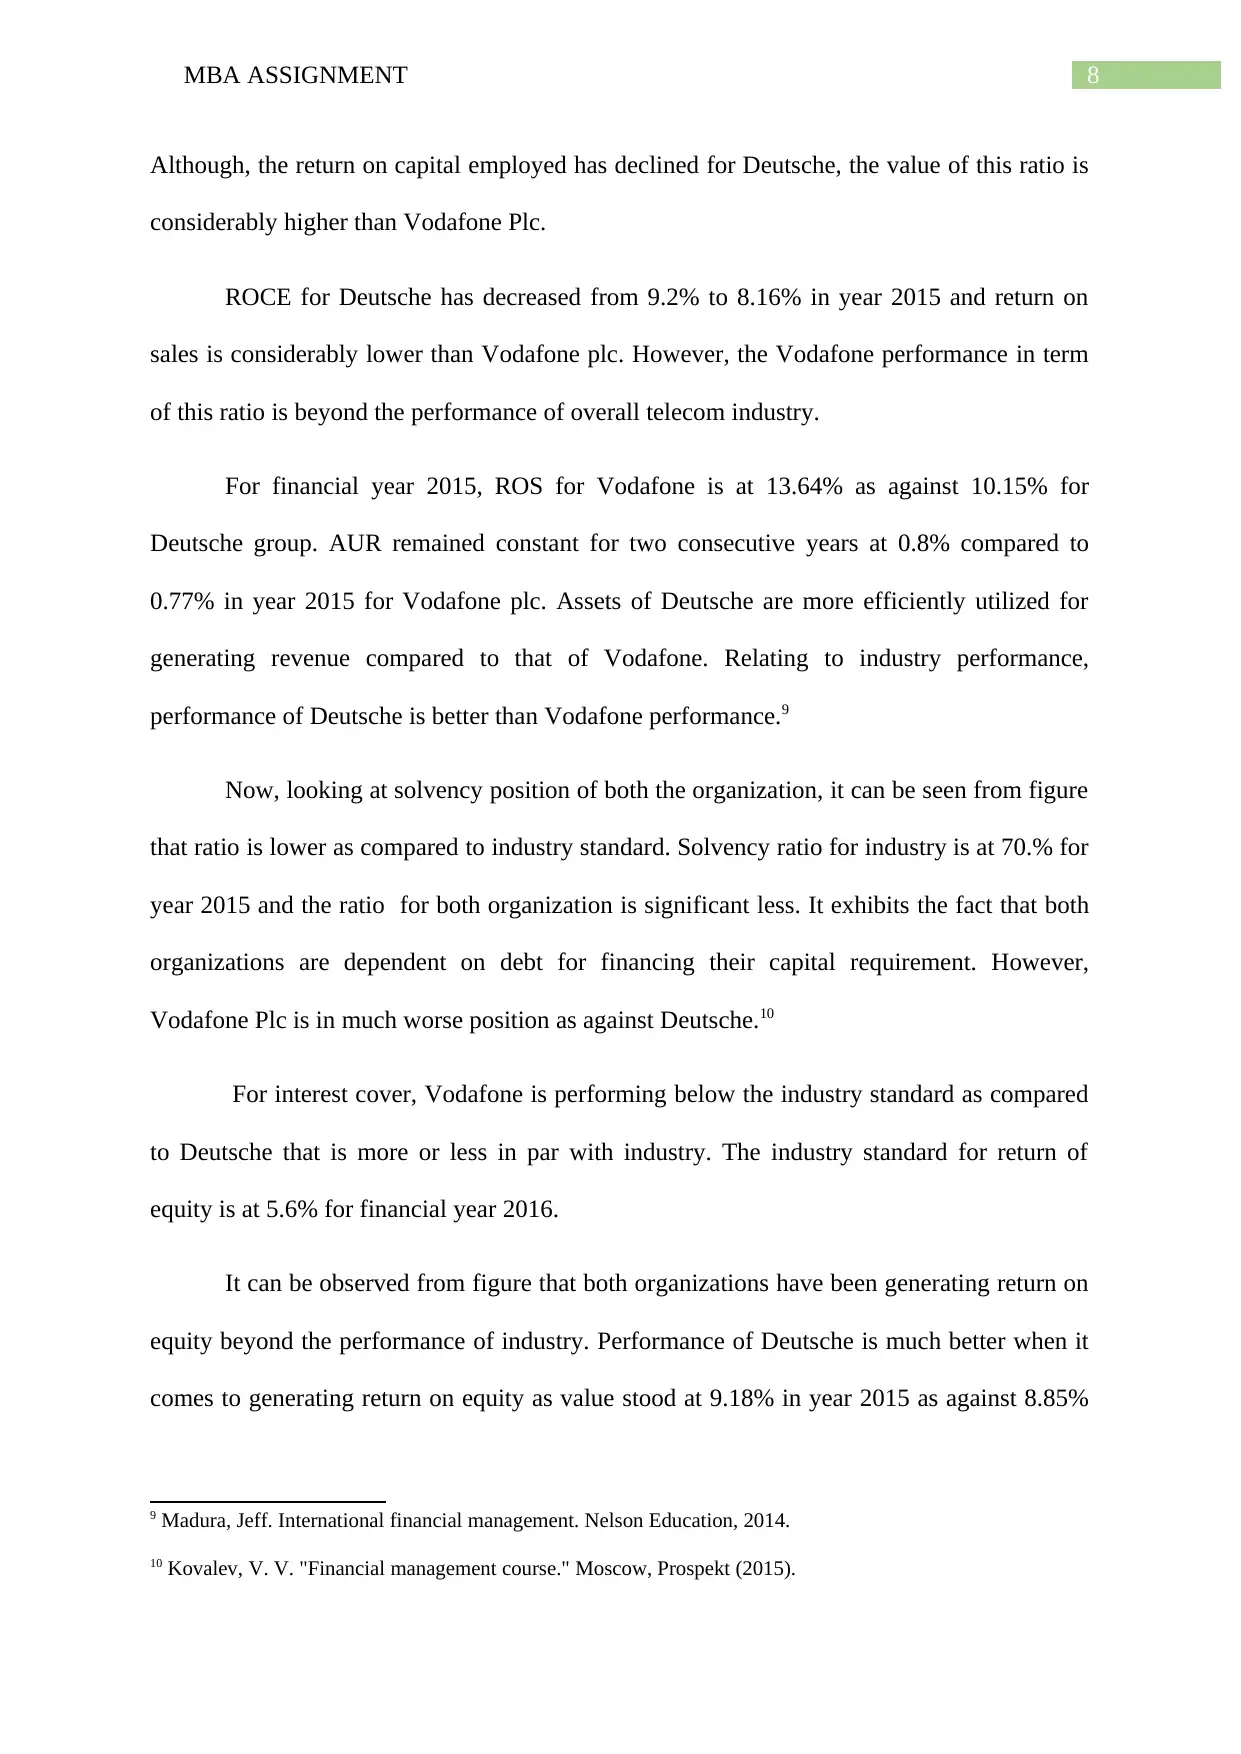
Although, the return on capital employed has declined for Deutsche, the value of this ratio is
considerably higher than Vodafone Plc.
ROCE for Deutsche has decreased from 9.2% to 8.16% in year 2015 and return on
sales is considerably lower than Vodafone plc. However, the Vodafone performance in term
of this ratio is beyond the performance of overall telecom industry.
For financial year 2015, ROS for Vodafone is at 13.64% as against 10.15% for
Deutsche group. AUR remained constant for two consecutive years at 0.8% compared to
0.77% in year 2015 for Vodafone plc. Assets of Deutsche are more efficiently utilized for
generating revenue compared to that of Vodafone. Relating to industry performance,
performance of Deutsche is better than Vodafone performance.9
Now, looking at solvency position of both the organization, it can be seen from figure
that ratio is lower as compared to industry standard. Solvency ratio for industry is at 70.% for
year 2015 and the ratio for both organization is significant less. It exhibits the fact that both
organizations are dependent on debt for financing their capital requirement. However,
Vodafone Plc is in much worse position as against Deutsche.10
For interest cover, Vodafone is performing below the industry standard as compared
to Deutsche that is more or less in par with industry. The industry standard for return of
equity is at 5.6% for financial year 2016.
It can be observed from figure that both organizations have been generating return on
equity beyond the performance of industry. Performance of Deutsche is much better when it
comes to generating return on equity as value stood at 9.18% in year 2015 as against 8.85%
9 Madura, Jeff. International financial management. Nelson Education, 2014.
10 Kovalev, V. V. "Financial management course." Moscow, Prospekt (2015).
9MBA ASSIGNMENT
for Vodafone plc.11 Therefore, both organizations have been outreaching the industrial
performance.
When looking at efficient position of telecom industry, it can be exhibited from figure
that inventory days for financial year 2015 stood at 6.5. Value for Vodafone plc stood at 5.16
as compared to 16.06 for Deutsche. In this aspect, Deutsche is less efficient as compared to
Vodafone plc as they are taking long time to convert their inventories into sales Deutsche.
The industry standard of trade receivable and other days is much higher that the number of
days required converting inventories into sales for both the organizations.12
Conclusion:
It can be concluded from above analysis that the overall financial performance of
Vodafone plc is not favourable as they have been witnessing declining sales that is hampering
their profitability position. However, in some aspect the performance of Vodafone plc is
better than industry standard and Deutsche group. Vodafone plc is outperforming industrial
standard in terms of efficiency position and generating return on equity. Therefore, in terms
of efficiency and generating return on equity, Vodafone is outperforming industry while in
terms of liquidity and solvency position they are underperforming. Performance of
organization can further increase if Vodafone would grasp the market opportunities.
11 Harlow, Harold Dennis, and Harold Dennis Harlow. "Vodafone Egypt (B), managing corporate cultural
change and organizational performance." Emerald Emerging Markets Case Studies 6.4 (2016): 1-17.
12 Karadag, Hande. "Financial management challenges in small and medium-sized enterprises: A strategic
management approach." Emerging Markets Journal 5.1 (2015): 26.
⊘ This is a preview!⊘
Do you want full access?
Subscribe today to unlock all pages.
Trusted by 1+ million students worldwide
10MBA ASSIGNMENT
References list:
Arnold, Glen. Corporate financial management. Pearson Higher Ed, 2013.
Blondy, Guilhem, et al. "The role of fiscal reporting in public financial management." Public
financial management and its emerging architecture (2013): 259-281.
Boyle, Geraldine. "‘She's usually quicker than the calculator’: financial management and
decision‐making in couples living with dementia." Health & social care in the community
21.5 (2013): 554-562.
Brigham, Eugene F., and Michael C. Ehrhardt. Financial management: Theory & practice.
Cengage Learning, 2013.
Brooks, Raymond. Financial management: core concepts. Pearson, 2015.
Brown, Matthew T. Financial management in the industry. 2016.
Cheema, Marvi K., Glenda M. MacQueen, and Stefanie Hassel. "Assessing personal financial
management in patients with bipolar disorder and its relation to impulsivity and response
inhibition." Cognitive neuropsychiatry 20.5 (2015): 424-437.
Harlow, Harold Dennis, and Harold Dennis Harlow. "Vodafone Egypt (B), managing
corporate cultural change and organizational performance." Emerald Emerging Markets Case
Studies 6.4 (2016): 1-17.
Karadag, Hande. "Financial management challenges in small and medium-sized enterprises:
A strategic management approach." Emerging Markets Journal 5.1 (2015): 26.
Koh, Annie, et al. Financial Management: Theory and Practice. Cengage Learning, 2014.
Kovalev, V. V. "Financial management course." Moscow, Prospekt (2015).
Lasher, William R. Practical financial management. Nelson Education, 2013.
Paraphrase This Document
Need a fresh take? Get an instant paraphrase of this document with our AI Paraphraser
11MBA ASSIGNMENT
Madura, Jeff. International Financial Management, Abridged. Cengage Learning, 2015.
Madura, Jeff. International financial management. Nelson Education, 2014.
Nalwaya, Nidhi, and Rahul Vyas. "Merger and Acquisition in the Telecom Industry: An
Analysis of Financial Performance of Vodafone Plc and Hutchison Essar." Journal of
Marketing & Communication 9.3 (2014): 67-73.
Ogiela, Lidia. "Intelligent techniques for secure financial management in cloud computing."
Electronic commerce research and applications 14.6 (2015): 456-464.
Petty, J. William, et al. Financial management: Principles and applications. Pearson Higher
Education AU, 2015.
1 out of 11
Related Documents


Your All-in-One AI-Powered Toolkit for Academic Success.
+13062052269
info@desklib.com
Available 24*7 on WhatsApp / Email
![[object Object]](/_next/static/media/star-bottom.7253800d.svg)
Unlock your academic potential
Copyright © 2020–2026 A2Z Services. All Rights Reserved. Developed and managed by ZUCOL.