Financial Analysis Report: Vodafone Group Operating Activities
VerifiedAdded on 2020/01/28
|14
|4546
|310
Report
AI Summary
This report presents a comprehensive financial analysis of Vodafone Group Plc. It begins with an analysis of the company's operating, financing, and investing activities, utilizing cash flow statements and time series analysis to evaluate performance over three years. The report then delves into an industry comparative analysis, contrasting Vodafone with Telefonica using various financial ratios such as gross profit margin, net profit ratio, receivable turnover, inventory turnover, asset turnover, current ratio, quick ratio, debt-to-equity ratio, earnings per share, and dividend per share. This comparative analysis provides insights into the relative financial strengths and weaknesses of both companies. Finally, the report examines Vodafone's dividend policy, assessing its impact on shareholder value and financial stability. The analysis incorporates qualitative factors to determine future financial performance, offering a well-rounded view of Vodafone's financial standing.

FINANCIAL
MANAGEMENT
MANAGEMENT
Paraphrase This Document
Need a fresh take? Get an instant paraphrase of this document with our AI Paraphraser
TABLE OF CONTENTS
INTRODUCTION......................................................................................................................1
TASK 1......................................................................................................................................1
Analysis of firm's operating, financing and investing activities.......................................1
Industry comparative analysis...........................................................................................3
Vodafone Group dividend policy......................................................................................5
TASK 2......................................................................................................................................6
Analysis of important qualitative factors to determine future financial performance......6
CONCLUSION..........................................................................................................................8
REFERENCES...........................................................................................................................9
Appendix..................................................................................................................................11
INTRODUCTION
Finance is a vital component for smooth business functioning. Every enterprise needs
adequate availability of funds to run its working operations effectively. Moreover, they are
required to manage their finance resources in an appropriate manner. Financial management
is the process of managing business funds efficiently and helps to achieve organizational
objectives to a great extent. It is a process that concerns with planning, procuring and
controlling of financial resources of the organizations. Moreover, it consists of preparing
financial plan and maintaining effective control over the financial activities of the business. It
mainly aims at maximising the business profits and shareholder’s wealth through minimize
cost of capital. Vodafone Group Plc is the world's largest British telecommunication service
company that operates in 26 countries and headquartered in London, UK. It provides both the
telecommunication and Information Technology (IT) services to large number of customers.
The present project report mainly aims at analysing the operating, financing and investing
activities of this business. Moreover, the qualitative factors will be analysed to evaluate
company's future financial performance.
TASK 1
Analysis of firm's operating, financing and investing activities
Cash flow statement: It is a statement that measures the cash balance changes between
two accounting period. It measures the cash inflows and outflows through various business
functions (Harris and et.al, 2013). The statement summarizes the cash sources and its
application in business functions. It provides information about liquidity and solvency
changes. Public limited company prepares cash flow statement as per IAS – 7 at the end of
every accounting period. In context to Vodafone Group Plc, the statement has been analysed
by applying time series approach. It is an analytical approach to make data analysis for a time
period. It measures the cash changes between time periods.
Cash flow from operating activities: Vodafone Group operating functions involves
sales and purchase of its products and services. It involves all the daily functions of Vodafone
Group Plc. Cash inflows comprises generated business revenues and cash outflow comprises
cash expenditures (Dumont and Schmit, 2013). Vodafone Group net operating cash flows in
all the subsequent three years are positive which indicates that business generates higher cash
incomes than the expenses. In the year 2015, company generated revenues amounted to
8824£ which get decreased to 6227£ in the year 2014. It may be due to lower operational
incomes which creates negative impact to the profits. Moreover, fierce level of competition,
1 | P a g e
⊘ This is a preview!⊘
Do you want full access?
Subscribe today to unlock all pages.
Trusted by 1+ million students worldwide
growth in current assets and reducing current liabilities also results in reducing the operating
cash flows. However, in the year 2015, net cash flows got inclined to 9715£ respectively.
Cash flow from investing activities: Investing activities measure changes in business
assets. It refers to purchases and selling activities of the company's assets. Sale of assets
contributes in cash inflow while acquisition of assets results in cash outflow (Brigham and
Ehrhardt, 2013). In the year 2013, net cash flows from investing activities indicate negative
balance of 5746£. It indicates that Vodafone Group acquired many fixed assets in the
organization and is comparatively higher than the disposal value of assets. In this year,
Vodafone purchased interest in subsidiaries and joint ventures, investment and bought
intangible and tangible assets such as property, plant and equipment. On contrary, cash has
been generated through disposal of assets, investment, dividend and interest received. The
total cash inflows and outflows were 7657£ and 13403£ in this year.
Thereafter, in the year 2014, the total cash inflows and outflows were 41970£ and
11227£ respectively. High amount of cash inflows has been resulted due to disposal of
interest in associates and joint ventures amounted to 34919£. Moreover, disposal of property,
plant and equipment, investment, dividend received from joint ventures, investment dividend
and interest incomes were 79£, 1483£, 4897£, 10£ and 582£ respectively. However, company
purchased tangible and intangible assets of 4396£ and 2327£ while interest in subsidiaries,
associates, and investment has been purchased for 4279£, 11£ and 214£. Further, net cash
flow got changed to positive balance of 30743£ which implies that Vodafone generated larger
cash inflows from its investing activities. It positively impacts the business as larger cash
sources will be available to business for operating purpose.
In the year 2015, net investing cash flow indicates adverse balance of 10327£. It is
because; Vodafone's total cash outflows are comparatively low than cash inflows in this year.
In the year, Vodafone paid high amount of cash for acquiring tangible and intangible assets.
The purchase value of tangible assets was 6568£ and intangible assets has been acquired for
2315£. Further, subsidiaries interest has been purchased for 3093£. On the other hand, low
assets have been disposed off in this year. The total cash inflows and outflows were 1941£
and 12268£ resulted in adverse cash flows of 10327£ and impacts business operations in
negative direction.
Cash flow from financing activities: Vodafone needs sufficient finance sources to run
business operations in an effective manner. It includes inflow and outflow of business capital.
Issuing share capital and additional borrowings will lead to increase the firm's cash inflow
while redemption of share capital, debentures and repayment of borrowings will results in
2 | P a g e
Paraphrase This Document
Need a fresh take? Get an instant paraphrase of this document with our AI Paraphraser
cash outflow (Madura, 2012). Vodafone Group Plc's financing activities implies adverse cash
balance in all the subsequent years. The cash flow statement indicates that in the year 2013,
company has negative net cash flow of 2743£. The total cash inflows was 9998£ while cash
outflows was 7255£. Company generated cash sources through issued share capital of 69£,
took short term and long term borrowings of 1581£ and 5422£. However, equity dividend,
repayment of borrowings and treasury shares have been purchased for 4806£, 1720£ and
1568£ as a major part of cash outflows.
Thereafter, in the following year, net cash flow significantly changed to 34249£
which is an adverse balance. The reason behind such causes is Vodafone generated low cash
sources through issuing share capital of 38£ and long term borrowings of 1060£. Thus, the
total cash inflow was only 1098£. However, payment has been made in a large extent. Short
term and long term borrowing was paid as 2887£ and 9788£ respectively. Moreover, share
capital have been redeemed for 14291£ and treasury shares was purchased for 1033£. Other
business cash outflows have been resulted due to dividend payments, payment of loan on
joint venture and so on. The total cash outflow was 35,347£ in this year; therefore cash
balance gets increased in negative direction.
Year 2015 posses adverse net cash balance of 2418£. In this year, large amount of
long term borrowings have been proceeded for 2432£. Moreover, proceed through share
capital was 18£ and short term loan was 4722£. The total cash inflows in the year was 4172£
while cash outflows was 9590£. Large contribution towards the cash outflow was of
repayment of borrowings and equity dividend for 4070£ and 2927£. Moreover, movement in
loans with joint venture and associates, interest payments and non controlling interest lead to
enhance cash outflows.
Net cash flows: With the impact of changing the operating, investing and financing
cash flows, net cash flow of the business get changed from 335£ to 2721£ and (3030£).
However, ending cash balance were 7506£, 10112£ and 6861£ respectively.
Industry comparative analysis
Telefonica is a competitor of Vodafone Group Plc therefore; comparative industry
analysis can be done by adopting ratio analysis method for both the companies. Both the
business performance are analysed through measuring profitability, solvency, liquidity and
investment ratios (Gu and et.al, 2013).
Gross profit ratio: It measures the relationship between gross profit and business
revenue. Vodafone's gross margin was 31.4% in the year 2013 which get declined to 26.9%
3 | P a g e
in the year 2015. It implies that the business performance is declining over the period.
However, Telefonica gross margin was 71% which get declined to 70.9% in the year 2015. It
indicates that both the company’s gross profit ratio get decreased although; it is higher in case
of Telefonica which implies that it has better operating performance (Brigham and Daves,
2012).
Net profit ratio: Vodafone's net margin ratio got changed from 0.97 to 13.64% in the
year 2015. However, net profits ratio of Telefonica business shows an increasing trend as it
increased from 7.82% to 8.39%. This indicates that Telefonica is performing well in the
market as compared to Vodafone Group Plc (Goodarzi and Dokht, 2015).
Receivable turnover ratio: Vodafone Group's ratio shows a fluctuating trend as it got
decreased to 10.06 in the year 2014 and got increased in the year 2015 to 11.15. On contrary,
Telefonica group ratio gets declined from 7.06 to 5.92. It indicates that Vodafone is receiving
earlier payments from the debtors as compared to Telefonica group.
Inventory turnover ratio: In the year 2013, the ratio was 65.18 for Vodafone which
get changed to 66.92 in the year 2015 while Telefonica business ratio was 5.92. It shows that
Vodafone Group is using its inventory in an efficient way due to higher stock turnover ratio
(Lasher, 2013).
Assets turnover ratio: Vodafone group’s assets turnover ratio got inclined from 0.31
to 0.35 in the year 2015. However, in case of Telefonica Company, the ratio got decreased
from 0.47 to 0.46 although; it is higher than Vodafone. It shows that Telefonica is using its
business assets efficiently and effectively as compared to Vodafone.
Current ratio: It measures the liquidity to pay short term company obligation.
Vodafone's current ratio gets changed from 0.75 to 0.69 while Telefonica ratio gets changed
from 1 to 0.92. Thus, it can be said that Telefonica company is more able to discharge its
short term liabilities effectively (Moyer, McGuigan and Rao, 2014).
Quick ratio: Vodafone quick ratio shows a declining trend as it got decreased to 0.56
while Telefonica ratio gets declined to 0.47. It is higher in case of Vodafone Company.
Therefore, it can be said that company is able to dispose short term obligations effectively
through using its quick assets (Banerjee, 2015).
Debt to equity ratio/capital gearing: Vodafone group capital gearing ratio was 0.41,
0.3 and 0.34 in the year 2013, 2014 and 2015. It is using 18.30 long term debt and 53.96 as
equity in the business. The reason for using equity source in a great extent may be because; it
does not need to pay regular dividend to equity shareholder. Hence, it does not impose fixed
financial burden to the company. However, Telefonica has ratio of 2.42, 2.4 and 2.31
4 | P a g e
⊘ This is a preview!⊘
Do you want full access?
Subscribe today to unlock all pages.
Trusted by 1+ million students worldwide
respectively. In the year 2015, it is using 37.94 debt and 16.42 business equity. It may be
because; loan capital does not diversify business control to the lenders but impose fixed
financial burden (DRURY, 2013). High ratio of Telefonica indicates that there is more risk in
the business; as it uses high debt as compared to equity.
Earning per share: It measures the shareholder’s or investor’s return on their
investment. Earning per share in Vodafone business was 0.02, 2.22 and 0.22 respectively
while Telefonica Company’s Earnings per Share (EPS) is 1.01, 0.61 and 0.98 respectively. It
is more in Telefonica business which implies that shareholders are getting higher return
through investing in this company.
Dividend per share: Vodafone provided dividend per share of 0.18, 0.19 and 0.11 in
the year 2013, 2014 and 2015. However, in case of Telefonica, Dividend Per Share (DPS) is
0.34, 0.74 and 0.74 respectively. High ratio of dividend in Telefonica shows that it is
providing greater return to the shareholders (Ward, 2012). Thus, it helps to enhance
shareholders value in the business.
Vodafone Group dividend policy
Vodafone is trying to maintain its shareholder’s dividend at fair rate through making
policy. In the year 2013, Vodafone’s dividend growth ratio was 7.04% which get changed to
7.95% and 2% in the following years. However, the dividend yield ratio was 5.20%, 5.00%
and 5.10% respectively. In the year 2014, Vodafone introduced a new policy to maintain
dividend at the 2013 level. It declared interim dividend of 8% to 3.53p. However, in the year
2015, Vodafone's dividend policy was about to grow the shareholder’s dividend but it faced
severe difficulties in the market. Thus, dividend grows up by only 2% through dealing
efficiently with the market uncertainty. Furthermore, interim dividend has been declared to
3.60p. As a result, the total dividend payments were 10.19p, 11.00p and 11.22p. Therefore, it
can be said that Vodafone’s dividend policy aims at maintaining stable and improving
dividend rate to growth prospectus.
TASK 2
Analysis of important qualitative factors to determine future financial performance
Qualitative factors are immeasurable; as it cannot be measured in terms of value. It
includes customer base, market share, competition, management, regulations and industrial
growth (Shah, 2013). In context to Vodafone Group Plc, the qualitative factors are analysed
to predict future growth of the business.
5 | P a g e
Paraphrase This Document
Need a fresh take? Get an instant paraphrase of this document with our AI Paraphraser
Customer base: It is one of the most important components of qualitative factors that
contribute success or failure of the business. It refers to the number of customer to whom
Vodafone Plc is providing their services and products. Good customer base is beneficial for
the organization; as it provides great revenues and profitability. However, if the revenue tied
to a single product and customers, than it creates negative impact to the business. In context
to Vodafone Group plc, it is regularly focusing on increasing the number of customers
through providing the best quality of products and services. It is trying to serve larger number
of customers, attract new customers and ensure high customer retention. Moreover, new
product development and diversification of the customer also creates good customer base for
the company. It is providing qualitative services to the customers at affordable prices. This in
turn, Vodafone Group will be able to enhance their business sales and maintain customer
loyalty. Thus, it can be said that Vodafone Group will achieve good financial success in
future period due to large customer base.
Market share: Another qualitative component is Vodafone Group's market share in
telecommunication industry. It refers to the percentage of overseas market business of
Vodafone Group. Larger the market share will contribute towards the success of the
organization. For instance, Vodafone Group has good market share; as it provides its services
to large number of consumers. It is operating in 26 countries. Moreover, Vodafone Global
division offer services to the corporate clients in 150 nations. It is the second largest company
on the basis of revenues which helps to provide benefits of economies of scale. Thus, it can
be said that company has good market share in the industry. This in turn helps to identify that
Vodafone Group's financial performance will get improve in future period.
Management: Management plays a significant role in the financial success of
Vodafone Plc. The qualified and skilled managerial team brings investors believe to the
business. In context to Vodafone Group Plc, it is management of Board of directors and
group management team. It appoints suitable candidates as the board member. Hence, they
manage the overall business functioning in an effective way. Chairman, executive directors,
deputy chairman and senior independent director fulfil their responsibilities efficiently. They
make financial plans, set business short term and long term objectives and make strategies
and policies (McKinney, 2015). Moreover, through implementing the company strategies,
Vodafone Group plc is able to accomplish their set targets and achieve it in an effective way.
Moreover, the non executive directors make effective internal control, manage risk and run
business operations efficiently. They remove operating problems through taking better
6 | P a g e
quality of decisions. Thus, it can be reported that the experienced and qualified management
team contributes to the Vodafone's growth for future years.
Competitive position: Powerful competitive position drives long term success for the
business for upcoming period. It provides higher degree of operational effectiveness for the
firms. Vodafone Group is facing higher competition in the market as more telecom
companies are providing services to large number of users. It is facing competition from
Orange, Telefonica and Deutsche telecom companies (Millett, 2014). In order to respond in
this competitive pressure, company invested billions of pounds in its infrastructure process in
Europe. The business purchased many assets in Europe for this purpose. It helps to ensure the
good availability and speed of its services to compete effectively. Moreover, the company
diversified its product line by launching payTV broadband service in United Kingdom. It
helps Vodafone to improve its competitive position and trying to enhance its bottom line by
19%. This in turn ensures company to have strong position in the market and increase its
share prices trough getting competitive advantageous. Thus, it can be said that there is a great
possibility for Vodafone Group to enhance its future financial performance.
Regulations: Legal and regulatory environment plays an important role in corporate
business governance. In context to Vodafone Group, the board set high quality of standard to
ensure integrity, ethics and professionalism. It follows its legal and regulatory policies in an
appropriate manner. Its code of conduct principle involves discipline, social responsibility,
and fairness and directors accountability for its various stakeholders. It updates its Uganda for
compliance with regulatory environment. The chief business officer manages a team for
fulfilling their responsibilities. It makes commercial agreement, provide legal advice and
guidance, following communication legislations and other industrial norms on a regular basis.
Moreover, Vodafone organize a training programme to bring awareness about the regulatory
policies, codes and various standards to operate efficiently (Oscrott, 2014). Furthermore, it
fulfils licensing regulations and pay license fees and taxes timely. In addition to it, national
security regulations, radio frequency fees regulations, service regulations and competition
laws have also been complied through Vodafone's policies and procedures. Hence, it can be
reported that company is satisfying its legal and regulatory requirements to ensure good
corporate governance. It is the key of success for Vodafone Group in terms of future financial
performance.
Industry growth: Another way of examining future growth of Vodafone Group plc is
to identify the industrial growth. In the present age, technology is increasing at faster rate
therefore; telecom industry has a great chance of success. Vodafone Group operations prevail
7 | P a g e
⊘ This is a preview!⊘
Do you want full access?
Subscribe today to unlock all pages.
Trusted by 1+ million students worldwide
in a telecommunication industry thereby have great possibility of future growth. Vodafone is
offering innovative and newer technological products to the customers for growth prospectus
(Hahn, 2015). Technology governance is also managed by Chief Technology officer for that
purpose. It is maintaining its product and service technology and makes improvement over it
on a continuous basis thereby helps to build customer satisfaction to a great extent. Thus, it
can be said that in future period, Vodafone can improve its financial performance.
CONCLUSION
The present project report concluded that quantitative business analysis can be done
through analysing the financial statements. Increasing business profitability, liquidity,
efficiency brings growth to the business. Along with the, quantitative analysis and qualitative
factors also help to predict future growth prospectus of the business. Increasing market share,
competitive position, industrial growth, compliance with legal regulations and efficient
management team are the factors that contribute towards the successful future of this
business.
8 | P a g e
Paraphrase This Document
Need a fresh take? Get an instant paraphrase of this document with our AI Paraphraser
REFERENCES
Book and Journals
Banerjee, B., 2015. Fundamentals of financial management. PHI Learning Pvt. Ltd..
Brigham, E. and Daves, P., 2012. Intermediate financial management. Cengage Learning.
Brigham, E. and Ehrhardt, M., 2013. Financial management: theory & practice. Cengage
Learning.
DRURY, C.M., 2013. Management and cost accounting. Springer.
Dumont, G. and Schmit, M., 2013. Tier 1 MFIs Financial Performance: Cash-flow statement
analysis. ULB--Universite Libre de Bruxelles.
Goodarzi, A. and Dokht, H.N., 2015. Measuring the Relative Importance of Financial Ratios:
An Integrated Approach of Fuzzy DEMATEL and Fuzzy ANP. International Business
and Management. 11(3). pp. 81-95.
Gu, H. and et.al., 2013. RAMSY: Ratio analysis of mass spectrometry to improve compound
identification. Analytical chemistry. 85(22). pp. 10771-10779.
Hahn, T., 2015. Theoretical Background. In Cross-Industry Innovation Process. Springer
Fachmedien Wiesbaden.
Harris, P. and et.al., 2013, July. A CASE STUDY OF THE CASH FLOW STATEMENT:
US GAAP CONVERSION TO IFRS. In Global Conference on Business & Finance
Proceedings. Institute for Business & Finance Research.
Lasher, W.R., 2013. Practical financial management. Cengage Learning.
Madura, J., 2012. International financial management. Cengage Learning.
McKinney, J.B., 2015. Effective financial management in public and nonprofit agencies.
ABC-CLIO.
Moyer, R. C., McGuigan, J. and Rao, R., 2014. Contemporary financial management.
Cengage Learning.
Shah, P., 2013. Financial Accounting. OUP Catalogue.
Ward, K., 2012. Strategic management accounting. Routledge.
Online
Millett, C., 2014. Vodafone results hit by rising competition in Europe. [Online]. Available
through: <http://www.mobiletoday.co.uk/news/industry/29482/vodafone-results-hit-by-
rising-competition-in-europe.aspx>. [Accessed on 1st Feburary, 2016].
9 | P a g e
Oscrott, A., 2014. Dividends At Vodafone Group plc are Faltering. [Online]. Available
through: <http://www.fool.co.uk/investing/2014/09/01/dividends-at-vodafone-group-
plc-are-faltering/>. [Accessed on 1st Feburary, 2016].
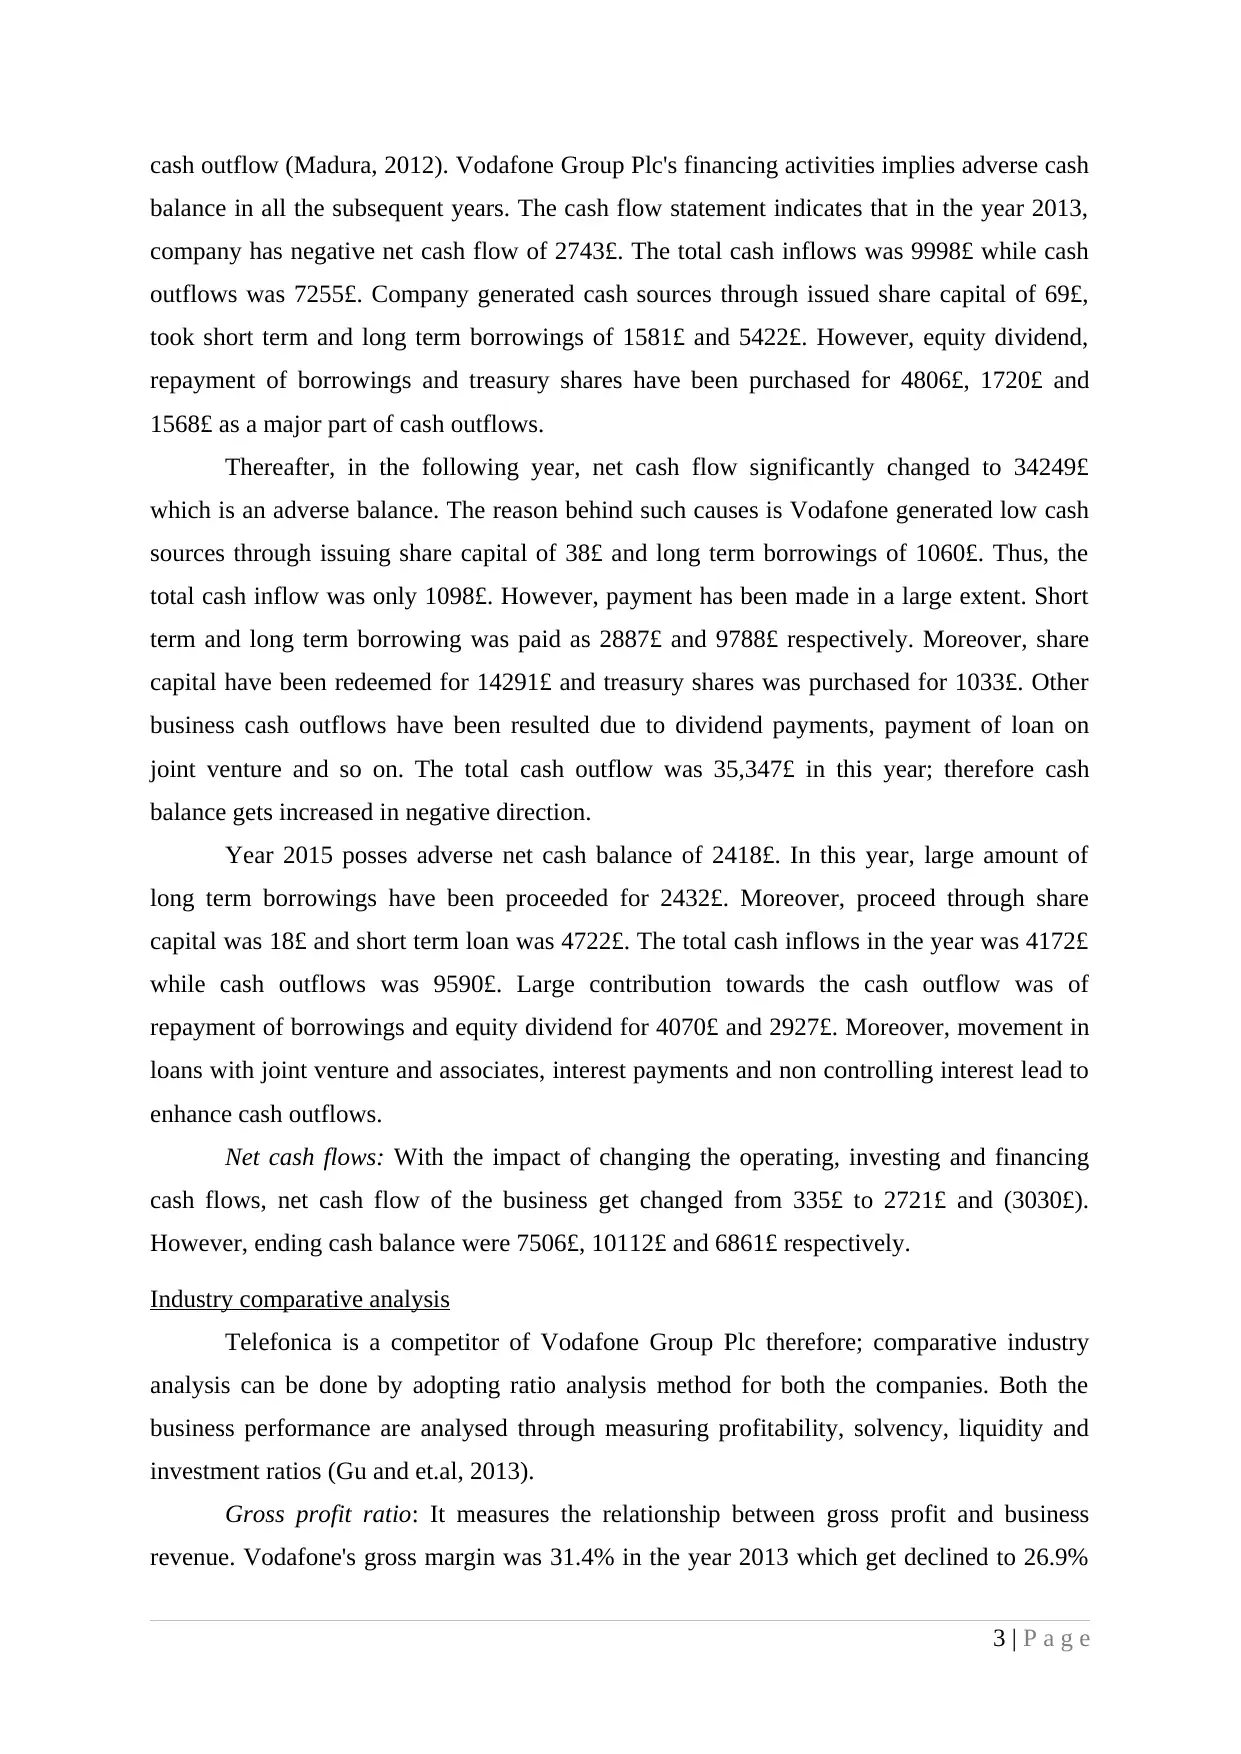
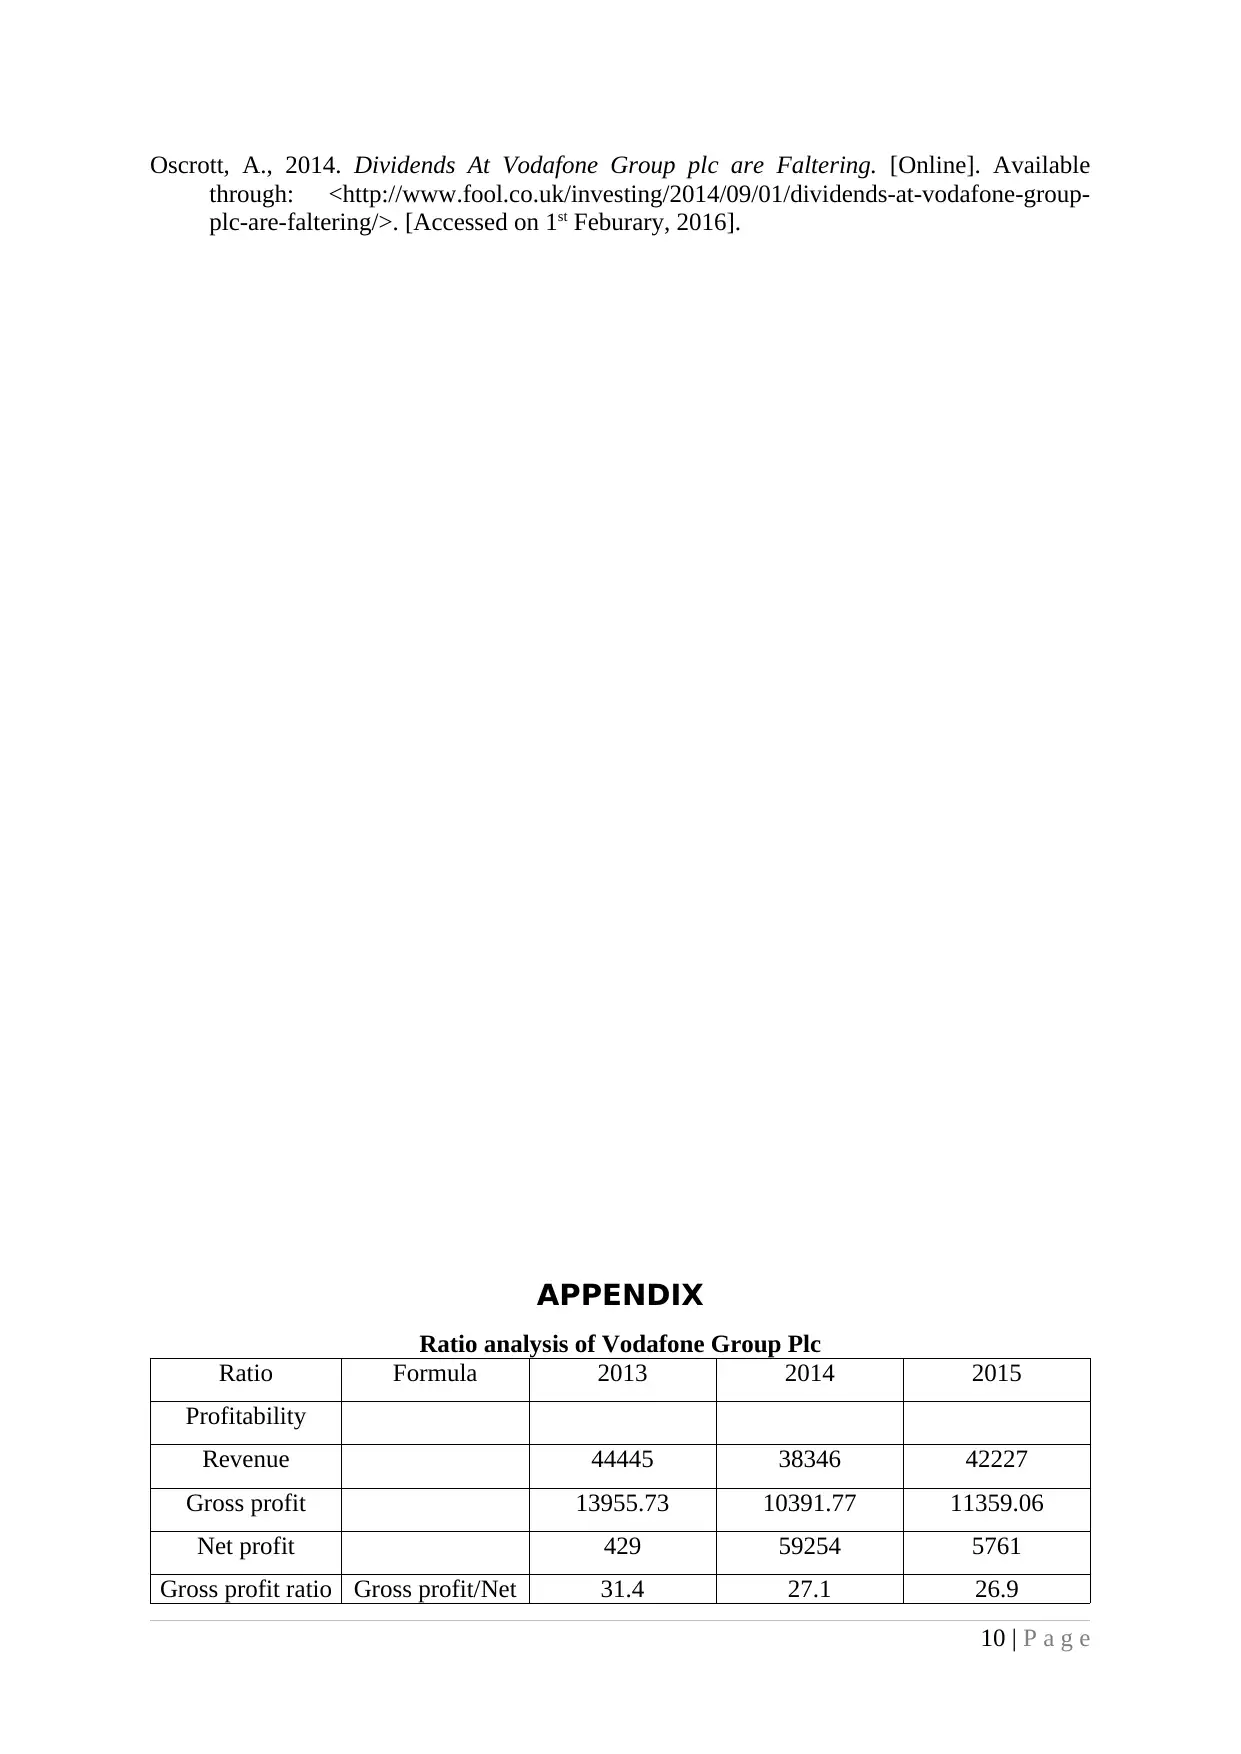
APPENDIX
Ratio analysis of Vodafone Group Plc
Ratio Formula 2013 2014 2015
Profitability
Revenue 44445 38346 42227
Gross profit 13955.73 10391.77 11359.06
Net profit 429 59254 5761
Gross profit ratio Gross profit/Net 31.4 27.1 26.9
10 | P a g e
through: <http://www.fool.co.uk/investing/2014/09/01/dividends-at-vodafone-group-
plc-are-faltering/>. [Accessed on 1st Feburary, 2016].
APPENDIX
Ratio analysis of Vodafone Group Plc
Ratio Formula 2013 2014 2015
Profitability
Revenue 44445 38346 42227
Gross profit 13955.73 10391.77 11359.06
Net profit 429 59254 5761
Gross profit ratio Gross profit/Net 31.4 27.1 26.9
10 | P a g e
⊘ This is a preview!⊘
Do you want full access?
Subscribe today to unlock all pages.
Trusted by 1+ million students worldwide
1 out of 14
Related Documents


Your All-in-One AI-Powered Toolkit for Academic Success.
+13062052269
info@desklib.com
Available 24*7 on WhatsApp / Email
![[object Object]](/_next/static/media/star-bottom.7253800d.svg)
Unlock your academic potential
Copyright © 2020–2026 A2Z Services. All Rights Reserved. Developed and managed by ZUCOL.