Vodafone Financial Performance Report
VerifiedAdded on 2020/01/28
|13
|4193
|40
Report
AI Summary
This report provides a comprehensive financial analysis of Vodafone, a British multinational telecommunications company, covering the years 2014 and 2015. The analysis utilizes ratio analysis to assess Vodafone's liquidity, profitability, solvency, and efficiency. Key ratios examined include current ratio, quick ratio, absolute liquid ratio, gross profit ratio, net profit ratio, operating ratio, inventory turnover ratio, debtor turnover ratio, creditor turnover ratio, debt equity ratio, and proprietary ratio. The report details the strengths and weaknesses revealed by these ratios, highlighting areas of concern such as declining profitability and liquidity issues. The analysis also discusses the implications of these findings for both short-term and long-term financial decision-making within Vodafone. The report concludes by emphasizing the importance of financial statement analysis for organizational stakeholders and strategic planning.

Introduction to Finance and
Marketing
Marketing
Paraphrase This Document
Need a fresh take? Get an instant paraphrase of this document with our AI Paraphraser
Table of Contents
INTRODUCTION...........................................................................................................................1
TASK 1............................................................................................................................................1
1.1 Main activities and markets of Vodafone.............................................................................1
1.2 Basic principles, roles and purpose of financial statements..................................................1
1.3 Analysis of financial performance of Vodafone...................................................................2
1.4 Benefits and limitations of different ratios............................................................................7
1.5 Analysis necessary for short and long term financial decisions ..........................................8
CONCLUSION................................................................................................................................9
REFERENCES .............................................................................................................................10

Index of Tables
Table 1: Ratio Analysis of Vodafone..............................................................................................3
Table 1: Ratio Analysis of Vodafone..............................................................................................3
⊘ This is a preview!⊘
Do you want full access?
Subscribe today to unlock all pages.
Trusted by 1+ million students worldwide
INTRODUCTION
Financial statements helps an organisation to measure its performance in the market.
Analysis of financial statements is an efficient way to assess the position of the company in all
aspects of the business (Best, 2014). Ratio analysis is used to analyse and compare the data of
the company with its past performance. It also gives useful information about the liquidity,
solvency and efficiency of the company. These analysis form an important part in decision
making and strategies for the future (Boczko, 2016). The report includes the analysis of
Vodafone company and its performance in the last two financial years. Vodafone is a British
multinational telecom company with its networks across 50 countries (Vodafone Plc. 2015).
It is the second largest telecommunication company with its headquarters in London, UK. Along
with this, the benefits and limitations of ratios for Vodafone has also been included in the report.
TASK 1
1.1 Main activities and markets of Vodafone
Vodafone is a global company and it has variety of products in its portfolio. It is a world
famous telecommunication company has products like fixed lines, mobiles, internet services,
digital television, money transfers and mHealth services. The turnover and the customer base has
been growing at a good pace in the recent past. It has 7 billion mobile phone and 1 billion land
line customers around the world (Cheung and et.al., 2014). It also offers communication
solutions like cloud computing, unified collaborations and communications to various
companies (Vernimmen and et.al., 2014). Furthermore, mobile payment, mobile emails,
broadband, managed services and machine to machine services are provided by the company.
The profits and revenues has been constantly rising and it is a good sign for the future of the
company.
1.2 Basic principles, roles and purpose of financial statements
The purpose of financial statements is to provide information about the performance of
the company to its stakeholders and management to facilitate their decision making process
(Tugas, 2012). The stakeholders who rely on these statements are customers, suppliers, investors,
employees, management, lenders and government. All the credit decisions, investment decisions,
taxation decisions and union bargaining decisions are taken on the basis of these statements
(Hendrick and Crawford, 2014). The financial statements include Balance sheet, profit and loss
1
Paraphrase This Document
Need a fresh take? Get an instant paraphrase of this document with our AI Paraphraser
statements and cash flow statements. So the statements not only show whether the business is
profitable or not it also helps the stakeholders to find the solvency, liquidity and efficiency of the
business (Brooks and Mukherjee, 2013). It is also mandatory for the the companies to prepare
annual statements which should depict true picture of the company.
1.3 Analysis of financial performance of Vodafone
Ratio analysis is a tool which is used by management to assess the financial statements of
a company. It gives useful details about the performance and position of the company. Ratios can
be helpful in finding out the profitability, solvency and liquidity position of the company. The
shareholders require such information to see whether their investment is profitable or not (Chen
and et.al., 2013). Similarly other stakeholders need these information for their decision making.
The major categories of ratios are:
Liquidity ratios: It calculates the short term payment capacity of the firm. So it used to
measure the short term solvency of Vodafone. Lack of liquidity is harmful for any organisation.
It could result in loss of creditor's confidence, bad image and legal actions against the company
(Minsky, 2015). High liquidity would means that the firm has idle funds which should have been
invested somewhere else. So it is important to have a proper balance between them. The ratios
which are used to calculate liquidity are current ratio, quick ratio and absolute liquid ratio (Islam
and et.al., 2013).
Profitability ratios: These ratios calculate the profitability and efficiency of the
company. The major ratio to calculate profitability are gross profit ratio, net profit ratio and
operating ratio (Krishnamurthy and Vissing-Jorgensen, 2013). This helps the management to see
the performance of the company. Profitability means capacity to generate profits which is left
after deducting all costs and expenses from it.
Turnover ratios: Turnover ratios calculates the efficiency of the company towards
managing their resources. High turnover ratio means that the organisation is using their assets in
an effective manner (Lavoori and Paramanik, 2014). The different turnover ratios are inventory
turnover ratio, debtor turnover ratio, creditor turnover ratio and assets turnover ratio (Deran and
et.al., 2014).
Solvency ratios: The liquidity ratio short term solvency of the firm while solvency
measures the long term solvency. Positive solvency ratio gives assurance to the lenders and
creditors that the firm will pay their debts on time. It is very useful in calculating the long term
2
payment capacity of the company (Zohra and et.al., 2015). Not on payment of debts but also
instalment or interest payment capacity of the firm can also be calculated from it. The ratio
which are used to calculate it are debt equity ratio, debt to capital ratio, proprietary ratio, interest
coverage ratio and fixed asset to net worth ratio.
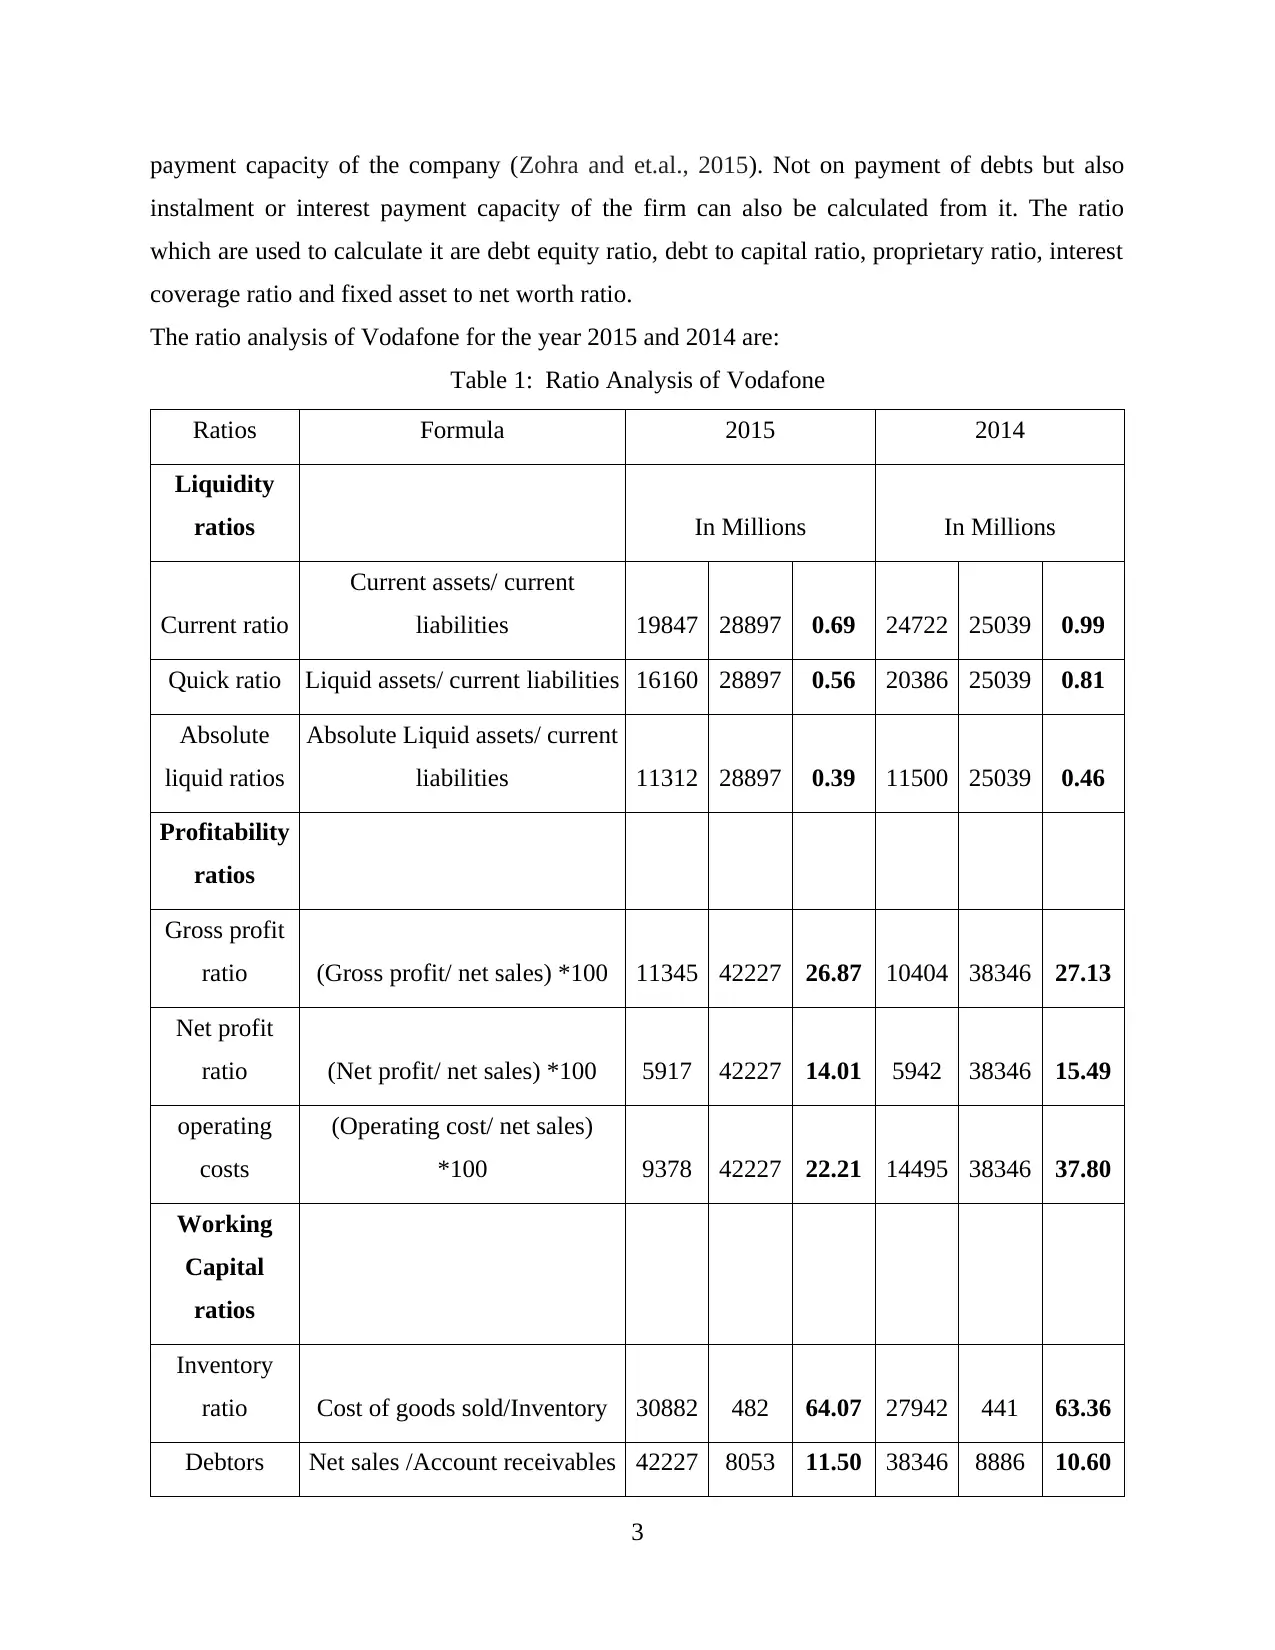
The ratio analysis of Vodafone for the year 2015 and 2014 are:
Table 1: Ratio Analysis of Vodafone
Ratios Formula 2015 2014
Liquidity
ratios In Millions In Millions
Current ratio
Current assets/ current
liabilities 19847 28897 0.69 24722 25039 0.99
Quick ratio Liquid assets/ current liabilities 16160 28897 0.56 20386 25039 0.81
Absolute
liquid ratios
Absolute Liquid assets/ current
liabilities 11312 28897 0.39 11500 25039 0.46
Profitability
ratios
Gross profit
ratio (Gross profit/ net sales) *100 11345 42227 26.87 10404 38346 27.13
Net profit
ratio (Net profit/ net sales) *100 5917 42227 14.01 5942 38346 15.49
operating
costs
(Operating cost/ net sales)
*100 9378 42227 22.21 14495 38346 37.80
Working
Capital
ratios
Inventory
ratio Cost of goods sold/Inventory 30882 482 64.07 27942 441 63.36
Debtors Net sales /Account receivables 42227 8053 11.50 38346 8886 10.60
3
instalment or interest payment capacity of the firm can also be calculated from it. The ratio
which are used to calculate it are debt equity ratio, debt to capital ratio, proprietary ratio, interest
coverage ratio and fixed asset to net worth ratio.
The ratio analysis of Vodafone for the year 2015 and 2014 are:
Table 1: Ratio Analysis of Vodafone
Ratios Formula 2015 2014
Liquidity
ratios In Millions In Millions
Current ratio
Current assets/ current
liabilities 19847 28897 0.69 24722 25039 0.99
Quick ratio Liquid assets/ current liabilities 16160 28897 0.56 20386 25039 0.81
Absolute
liquid ratios
Absolute Liquid assets/ current
liabilities 11312 28897 0.39 11500 25039 0.46
Profitability
ratios
Gross profit
ratio (Gross profit/ net sales) *100 11345 42227 26.87 10404 38346 27.13
Net profit
ratio (Net profit/ net sales) *100 5917 42227 14.01 5942 38346 15.49
operating
costs
(Operating cost/ net sales)
*100 9378 42227 22.21 14495 38346 37.80
Working
Capital
ratios
Inventory
ratio Cost of goods sold/Inventory 30882 482 64.07 27942 441 63.36
Debtors Net sales /Account receivables 42227 8053 11.50 38346 8886 10.60
3
⊘ This is a preview!⊘
Do you want full access?
Subscribe today to unlock all pages.
Trusted by 1+ million students worldwide
turnover ratio
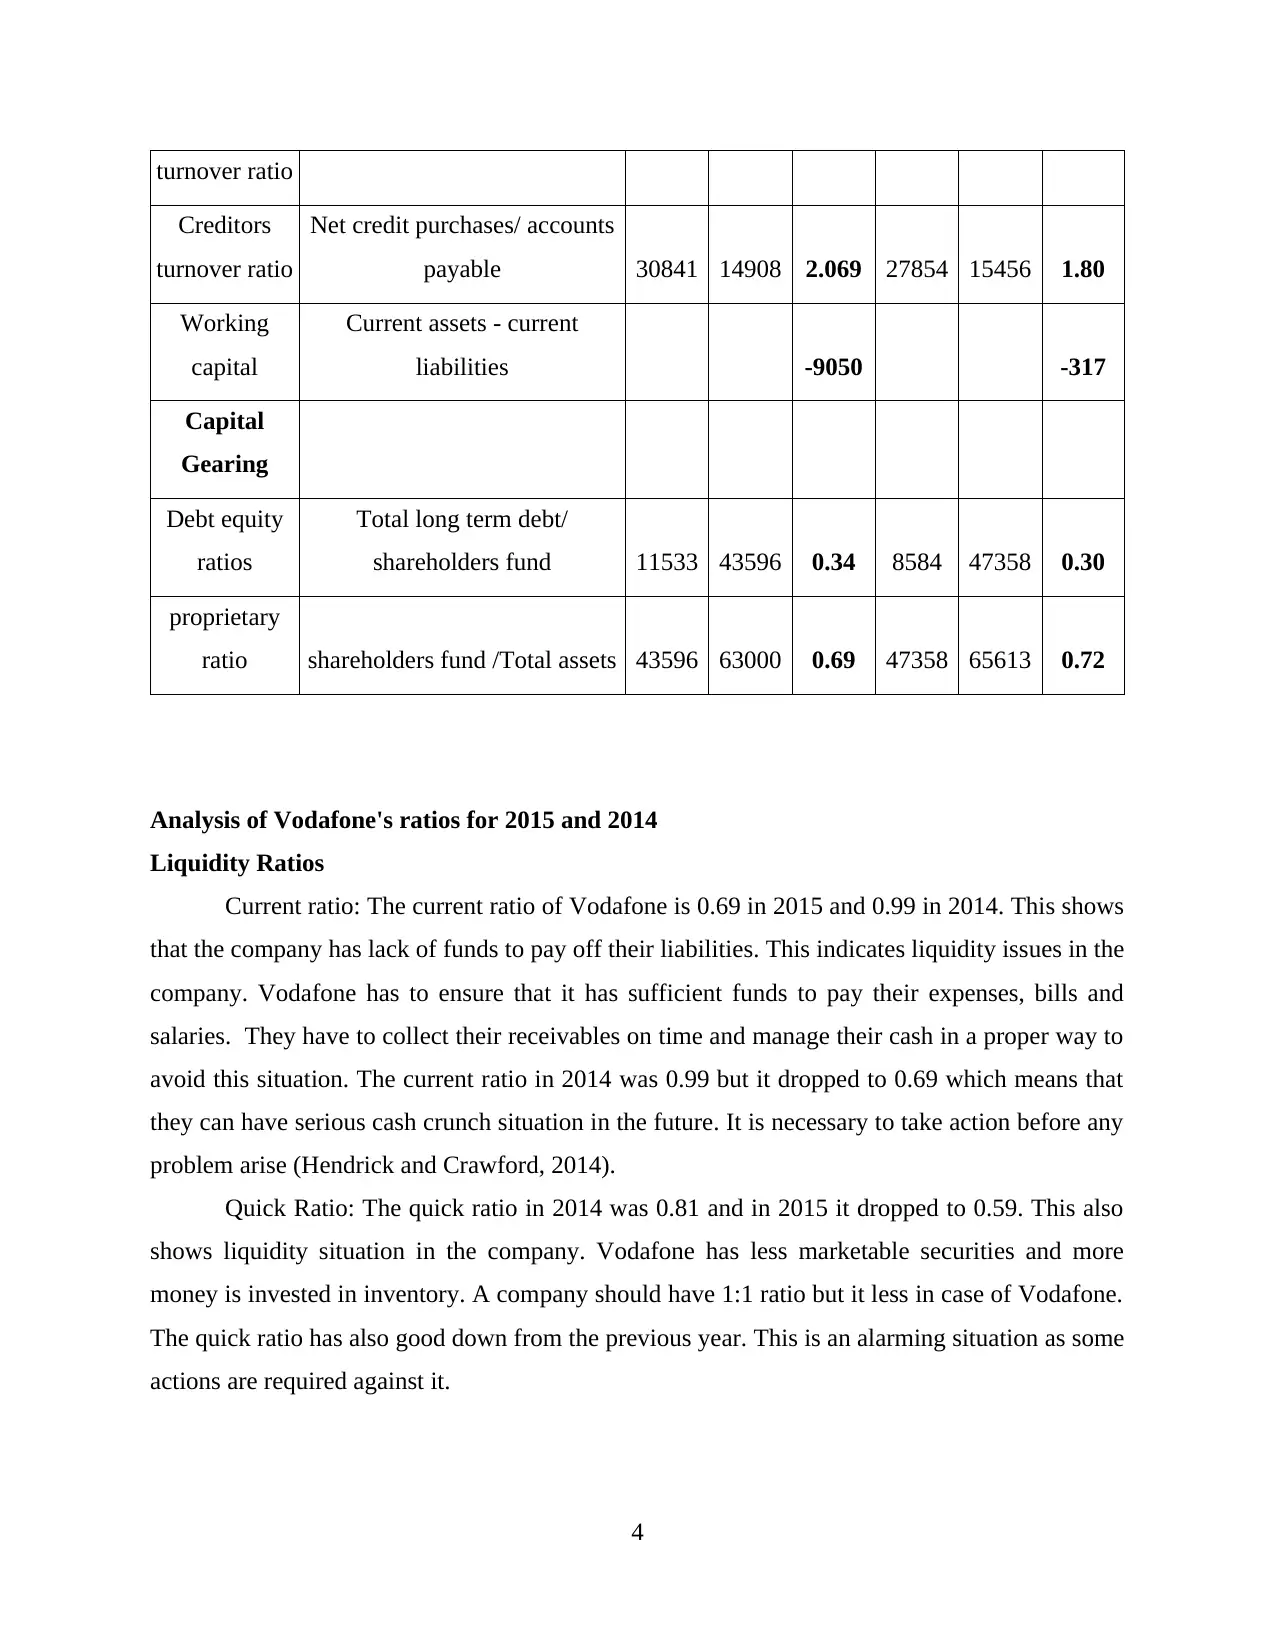
Creditors
turnover ratio
Net credit purchases/ accounts
payable 30841 14908 2.069 27854 15456 1.80
Working
capital
Current assets - current
liabilities -9050 -317
Capital
Gearing
Debt equity
ratios
Total long term debt/
shareholders fund 11533 43596 0.34 8584 47358 0.30
proprietary
ratio shareholders fund /Total assets 43596 63000 0.69 47358 65613 0.72
Analysis of Vodafone's ratios for 2015 and 2014
Liquidity Ratios
Current ratio: The current ratio of Vodafone is 0.69 in 2015 and 0.99 in 2014. This shows
that the company has lack of funds to pay off their liabilities. This indicates liquidity issues in the
company. Vodafone has to ensure that it has sufficient funds to pay their expenses, bills and
salaries. They have to collect their receivables on time and manage their cash in a proper way to
avoid this situation. The current ratio in 2014 was 0.99 but it dropped to 0.69 which means that
they can have serious cash crunch situation in the future. It is necessary to take action before any
problem arise (Hendrick and Crawford, 2014).
Quick Ratio: The quick ratio in 2014 was 0.81 and in 2015 it dropped to 0.59. This also
shows liquidity situation in the company. Vodafone has less marketable securities and more
money is invested in inventory. A company should have 1:1 ratio but it less in case of Vodafone.
The quick ratio has also good down from the previous year. This is an alarming situation as some
actions are required against it.
4
Paraphrase This Document
Need a fresh take? Get an instant paraphrase of this document with our AI Paraphraser
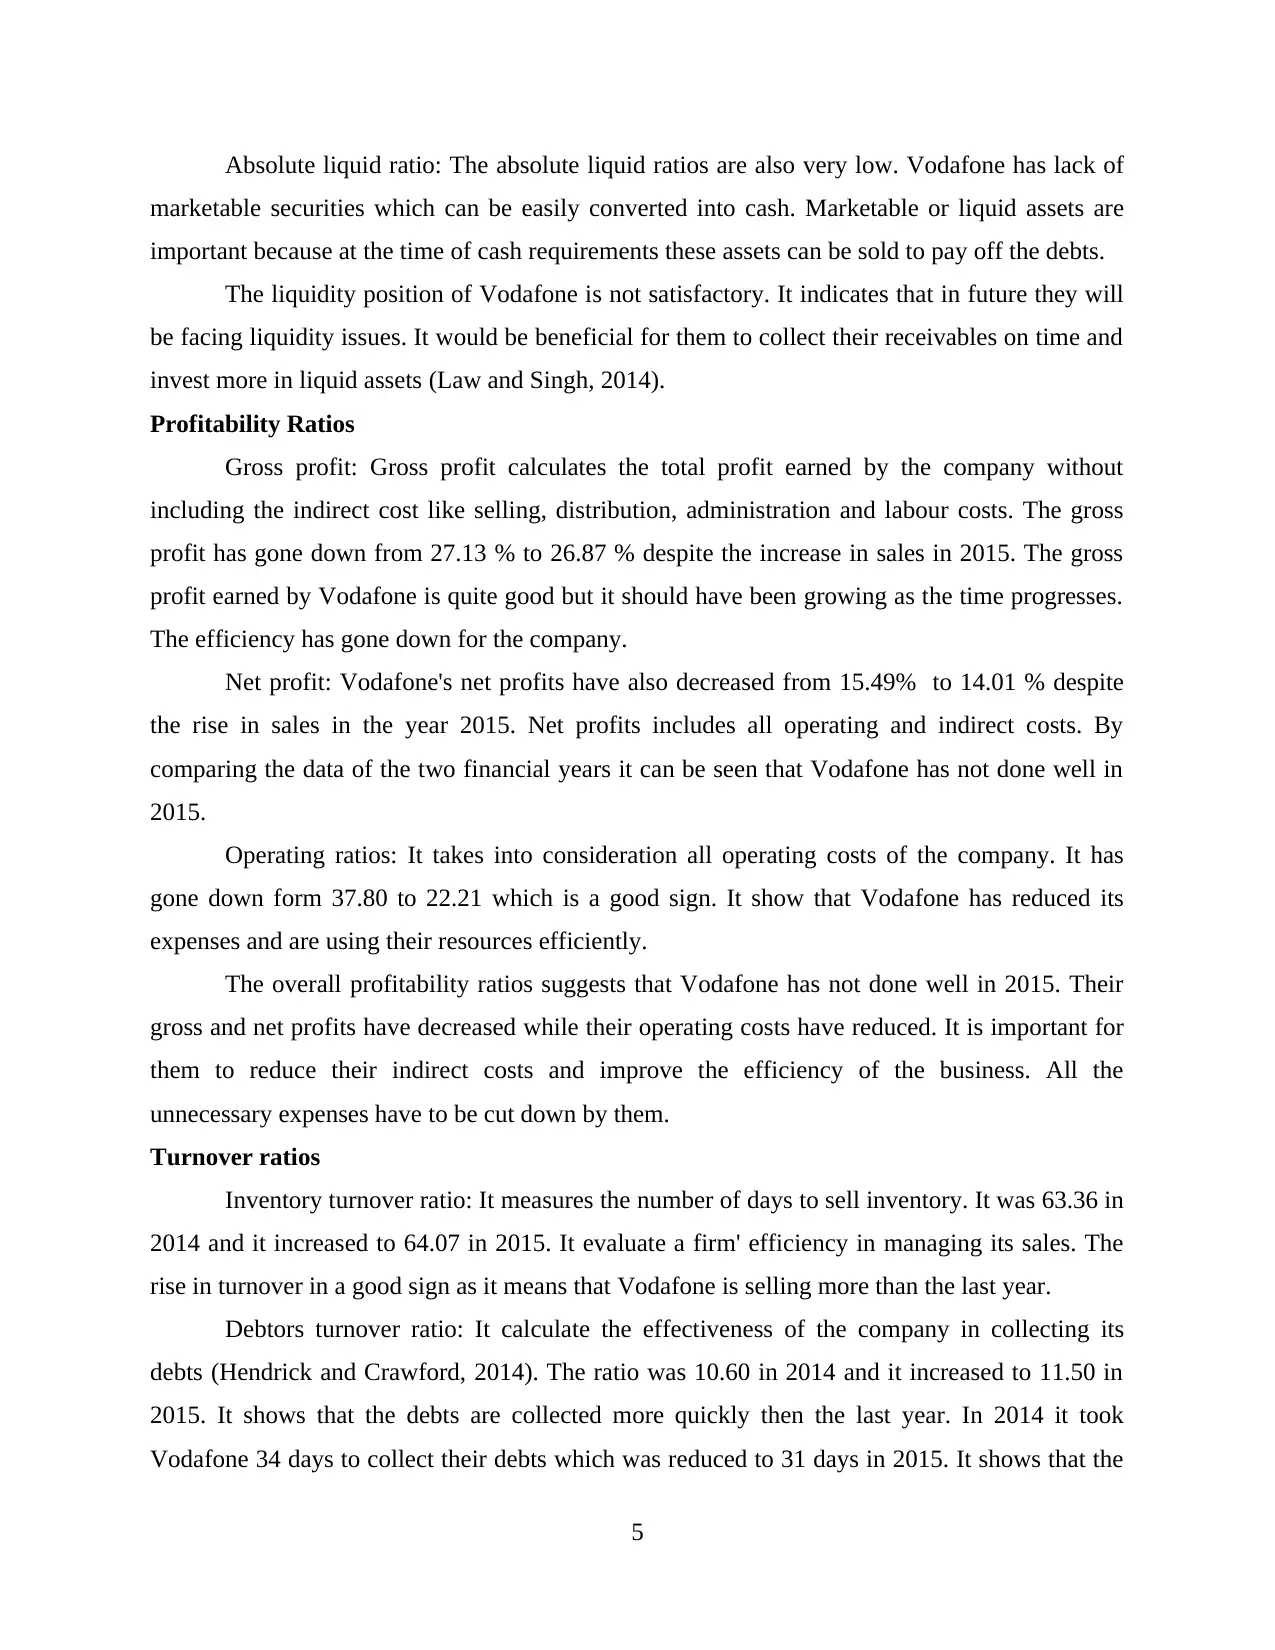
Absolute liquid ratio: The absolute liquid ratios are also very low. Vodafone has lack of
marketable securities which can be easily converted into cash. Marketable or liquid assets are
important because at the time of cash requirements these assets can be sold to pay off the debts.
The liquidity position of Vodafone is not satisfactory. It indicates that in future they will
be facing liquidity issues. It would be beneficial for them to collect their receivables on time and
invest more in liquid assets (Law and Singh, 2014).
Profitability Ratios
Gross profit: Gross profit calculates the total profit earned by the company without
including the indirect cost like selling, distribution, administration and labour costs. The gross
profit has gone down from 27.13 % to 26.87 % despite the increase in sales in 2015. The gross
profit earned by Vodafone is quite good but it should have been growing as the time progresses.
The efficiency has gone down for the company.
Net profit: Vodafone's net profits have also decreased from 15.49% to 14.01 % despite
the rise in sales in the year 2015. Net profits includes all operating and indirect costs. By
comparing the data of the two financial years it can be seen that Vodafone has not done well in
2015.
Operating ratios: It takes into consideration all operating costs of the company. It has
gone down form 37.80 to 22.21 which is a good sign. It show that Vodafone has reduced its
expenses and are using their resources efficiently.
The overall profitability ratios suggests that Vodafone has not done well in 2015. Their
gross and net profits have decreased while their operating costs have reduced. It is important for
them to reduce their indirect costs and improve the efficiency of the business. All the
unnecessary expenses have to be cut down by them.
Turnover ratios
Inventory turnover ratio: It measures the number of days to sell inventory. It was 63.36 in
2014 and it increased to 64.07 in 2015. It evaluate a firm' efficiency in managing its sales. The
rise in turnover in a good sign as it means that Vodafone is selling more than the last year.
Debtors turnover ratio: It calculate the effectiveness of the company in collecting its
debts (Hendrick and Crawford, 2014). The ratio was 10.60 in 2014 and it increased to 11.50 in
2015. It shows that the debts are collected more quickly then the last year. In 2014 it took
Vodafone 34 days to collect their debts which was reduced to 31 days in 2015. It shows that the
5
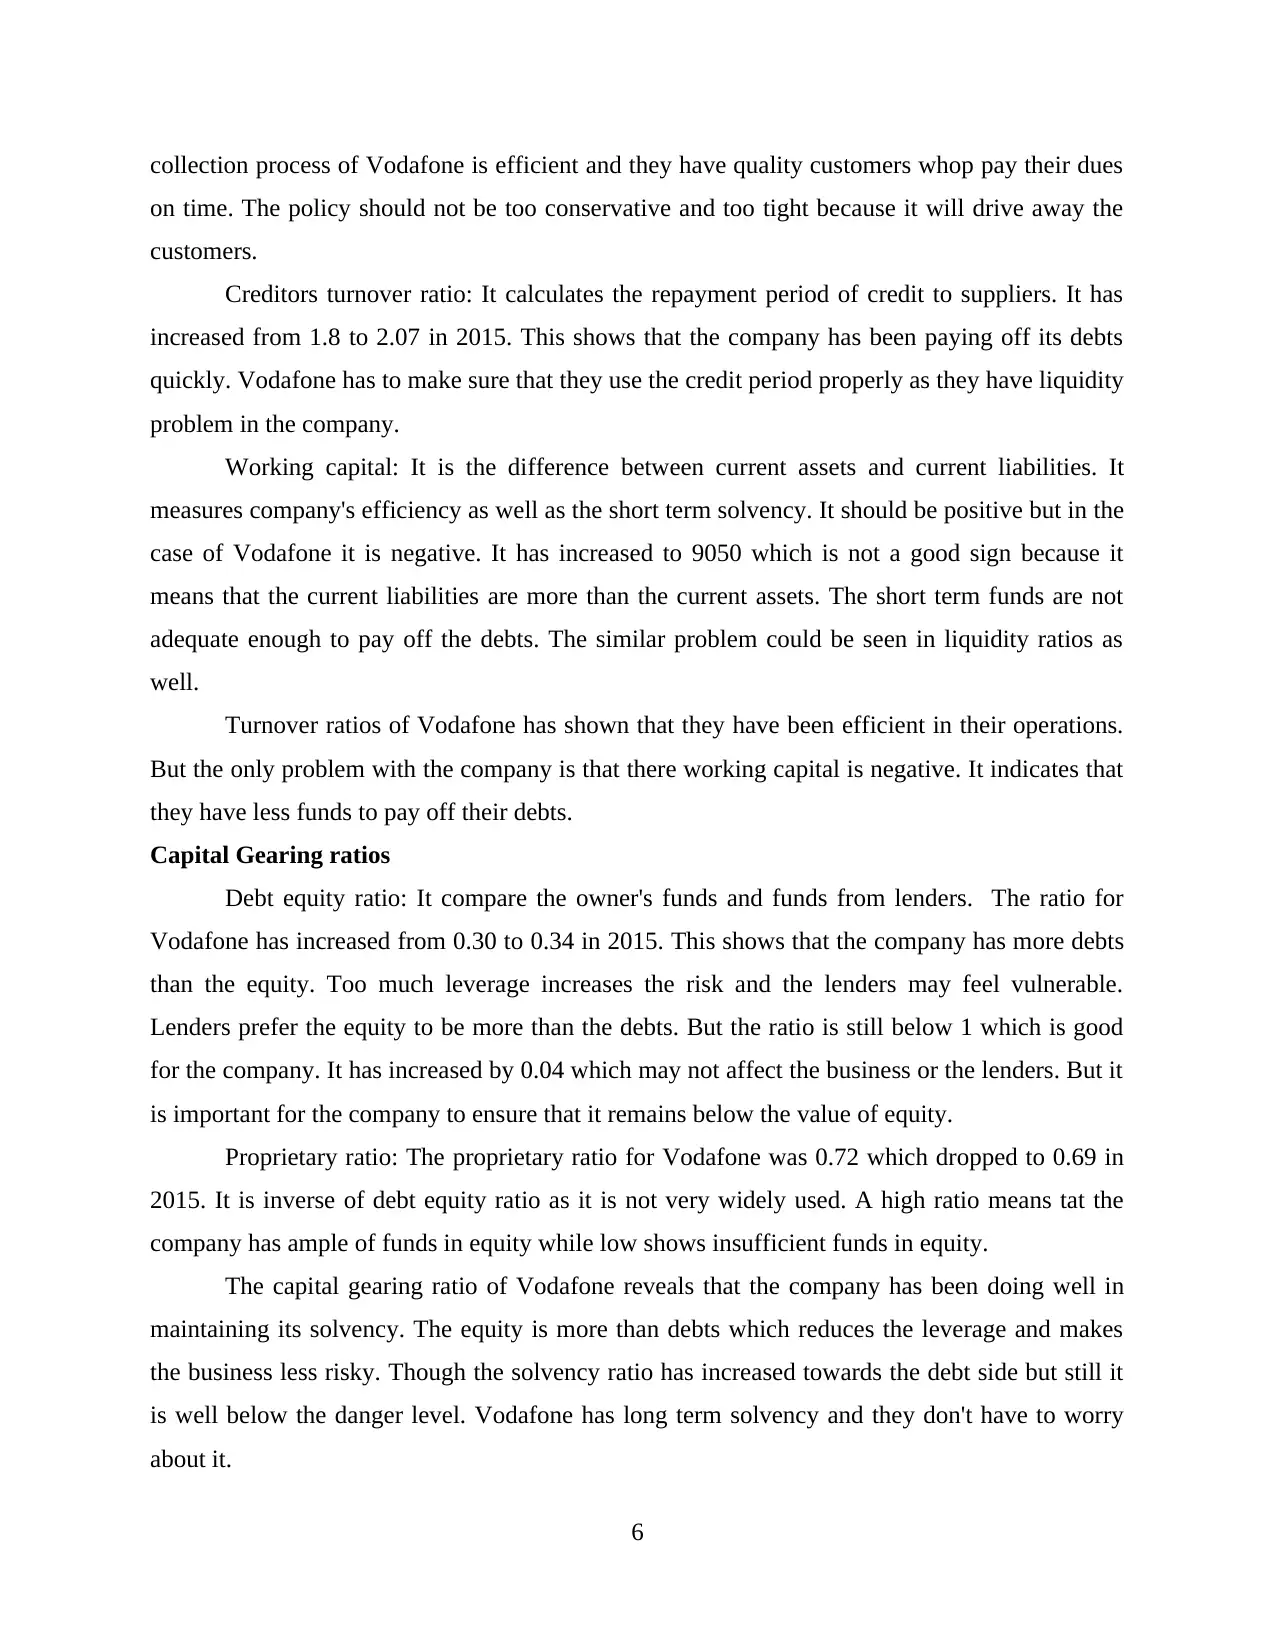
collection process of Vodafone is efficient and they have quality customers whop pay their dues
on time. The policy should not be too conservative and too tight because it will drive away the
customers.
Creditors turnover ratio: It calculates the repayment period of credit to suppliers. It has
increased from 1.8 to 2.07 in 2015. This shows that the company has been paying off its debts
quickly. Vodafone has to make sure that they use the credit period properly as they have liquidity
problem in the company.
Working capital: It is the difference between current assets and current liabilities. It
measures company's efficiency as well as the short term solvency. It should be positive but in the
case of Vodafone it is negative. It has increased to 9050 which is not a good sign because it
means that the current liabilities are more than the current assets. The short term funds are not
adequate enough to pay off the debts. The similar problem could be seen in liquidity ratios as
well.
Turnover ratios of Vodafone has shown that they have been efficient in their operations.
But the only problem with the company is that there working capital is negative. It indicates that
they have less funds to pay off their debts.
Capital Gearing ratios
Debt equity ratio: It compare the owner's funds and funds from lenders. The ratio for
Vodafone has increased from 0.30 to 0.34 in 2015. This shows that the company has more debts
than the equity. Too much leverage increases the risk and the lenders may feel vulnerable.
Lenders prefer the equity to be more than the debts. But the ratio is still below 1 which is good
for the company. It has increased by 0.04 which may not affect the business or the lenders. But it
is important for the company to ensure that it remains below the value of equity.
Proprietary ratio: The proprietary ratio for Vodafone was 0.72 which dropped to 0.69 in
2015. It is inverse of debt equity ratio as it is not very widely used. A high ratio means tat the
company has ample of funds in equity while low shows insufficient funds in equity.
The capital gearing ratio of Vodafone reveals that the company has been doing well in
maintaining its solvency. The equity is more than debts which reduces the leverage and makes
the business less risky. Though the solvency ratio has increased towards the debt side but still it
is well below the danger level. Vodafone has long term solvency and they don't have to worry
about it.
6
⊘ This is a preview!⊘
Do you want full access?
Subscribe today to unlock all pages.
Trusted by 1+ million students worldwide
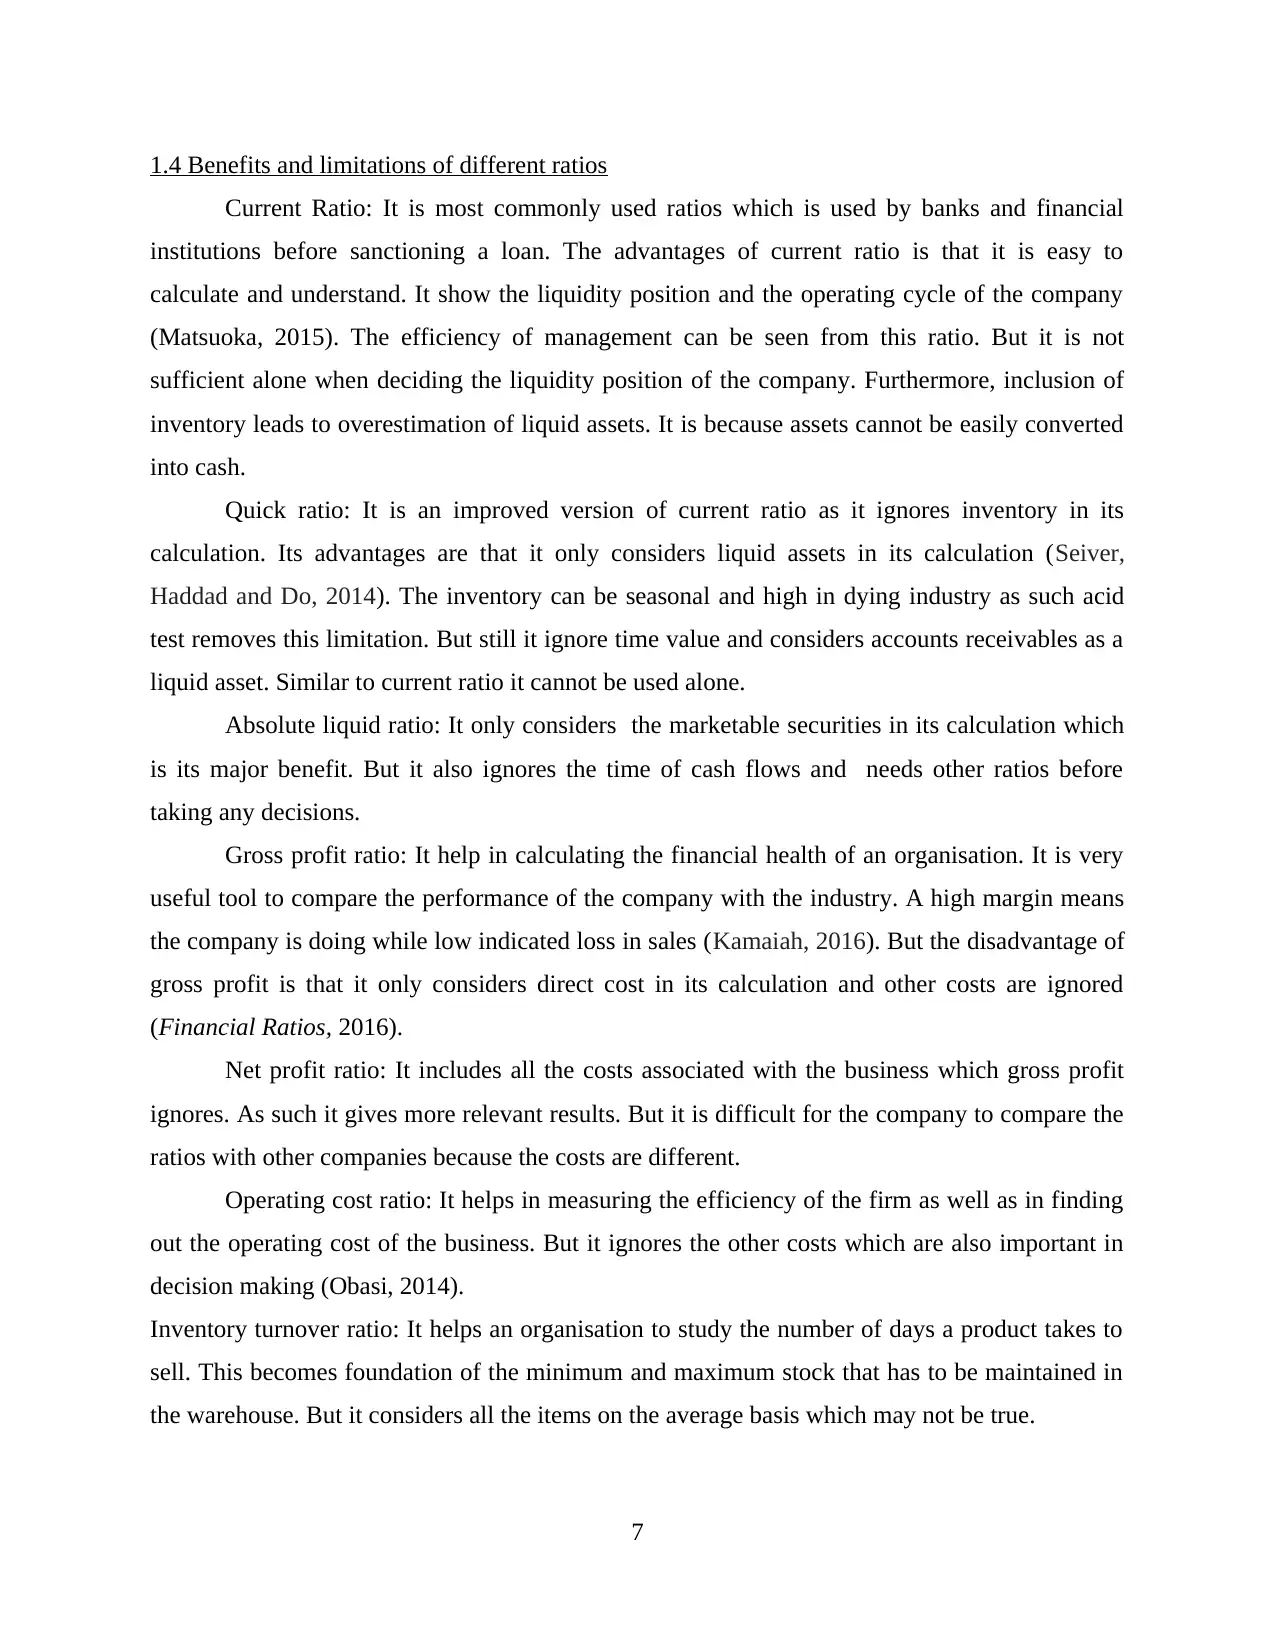
1.4 Benefits and limitations of different ratios
Current Ratio: It is most commonly used ratios which is used by banks and financial
institutions before sanctioning a loan. The advantages of current ratio is that it is easy to
calculate and understand. It show the liquidity position and the operating cycle of the company
(Matsuoka, 2015). The efficiency of management can be seen from this ratio. But it is not
sufficient alone when deciding the liquidity position of the company. Furthermore, inclusion of
inventory leads to overestimation of liquid assets. It is because assets cannot be easily converted
into cash.
Quick ratio: It is an improved version of current ratio as it ignores inventory in its
calculation. Its advantages are that it only considers liquid assets in its calculation (Seiver,
Haddad and Do, 2014). The inventory can be seasonal and high in dying industry as such acid
test removes this limitation. But still it ignore time value and considers accounts receivables as a
liquid asset. Similar to current ratio it cannot be used alone.
Absolute liquid ratio: It only considers the marketable securities in its calculation which
is its major benefit. But it also ignores the time of cash flows and needs other ratios before
taking any decisions.
Gross profit ratio: It help in calculating the financial health of an organisation. It is very
useful tool to compare the performance of the company with the industry. A high margin means
the company is doing while low indicated loss in sales (Kamaiah, 2016). But the disadvantage of
gross profit is that it only considers direct cost in its calculation and other costs are ignored
(Financial Ratios, 2016).
Net profit ratio: It includes all the costs associated with the business which gross profit
ignores. As such it gives more relevant results. But it is difficult for the company to compare the
ratios with other companies because the costs are different.
Operating cost ratio: It helps in measuring the efficiency of the firm as well as in finding
out the operating cost of the business. But it ignores the other costs which are also important in
decision making (Obasi, 2014).
Inventory turnover ratio: It helps an organisation to study the number of days a product takes to
sell. This becomes foundation of the minimum and maximum stock that has to be maintained in
the warehouse. But it considers all the items on the average basis which may not be true.
7
Paraphrase This Document
Need a fresh take? Get an instant paraphrase of this document with our AI Paraphraser
Debtor turnover ratio: The credit polices are made considering the debtor turnover ratio.
It shows whether the company is collecting its receivables on time or not. But plays an important
role deciding the liquidity position of the company.
Creditor turnover ratio: It accommodates a company to maintain its liquidity position in
the market. But gives the management information about the payment period to the creditors. But
it takes average of all the credit availed which may give wrong indication to individual creditor.
Working capital: It gives essential detail to the company regarding the working capital. Positive
indicates that company while negative indicates that Vodafone has to make changes in it (Law
and Singh, 2014).
Debt equity ratio: It helps an organisation to study the leverage position and risk that it
possess. Too much leverage can be bad for the business as such it helps in maintaining it. The
disadvantage of it is that it ignores the cost of issuing the equity and other sources of finance.
Proprietary ratio: The Proprietary ratio is similar to debt equity ratio and it also
accommodates in finding out the leverage of the company. But it also ignores the cost and
implications of other sources of finance (Hendrick and Crawford, 2014).
1.5 Analysis necessary for short and long term financial decisions
Short term financial planning involves decisions for a shorter period of time like 12
months. So all the decisions regarding working capital, buying raw materials, manufacturing,
selling and collecting cash are important in short-term financial decisions. It helps in finding out
the availability of cash to pay bills, inventory management and the policies regarding the credits
(Introduction to financial management. 2015). So it involves short term liquidity and solvency
decisions. Long term planning is much more complex than this. The management has to consider
short and long term objective of the business before making decisions. It involves projecting
revenues, sales, budgets, maintaining solvency and liquidity in the long run of the business. Lot
of changes in policies and strategies have to be done in order to ensure growth and survival of
the business. The profitability, solvency and liquidity ratio are used to make decisions regarding
the future of the company (Law and Singh, 2014).
CONCLUSION
It can be concluded from the above that financial statements and information play an
important for the organisation as well as its stakeholders. These information can be used to take
decisions about the future if the company. Vodafone has been growing at a good pace and the
8

same is reflected in their statements. But a thorough analysis show that they have lot of problems
maintaining the liquidity position of the company. Analysis of financial statements also gives
useful details about the solvency and efficiency of various business operations. As such financial
decisions have to be taken considering all such factors. This will not only fulfil the short term
objectives of the company but they will also accomplish their long term goals.
9
⊘ This is a preview!⊘
Do you want full access?
Subscribe today to unlock all pages.
Trusted by 1+ million students worldwide
1 out of 13
Related Documents


Your All-in-One AI-Powered Toolkit for Academic Success.
+13062052269
info@desklib.com
Available 24*7 on WhatsApp / Email
![[object Object]](/_next/static/media/star-bottom.7253800d.svg)
Unlock your academic potential
Copyright © 2020–2026 A2Z Services. All Rights Reserved. Developed and managed by ZUCOL.