Vodafone PLC Financial Performance Evaluation: Ratio & Trend Analysis

Verified

Added on  2023/04/23

|9
|255
|195
Presentation
AI Summary
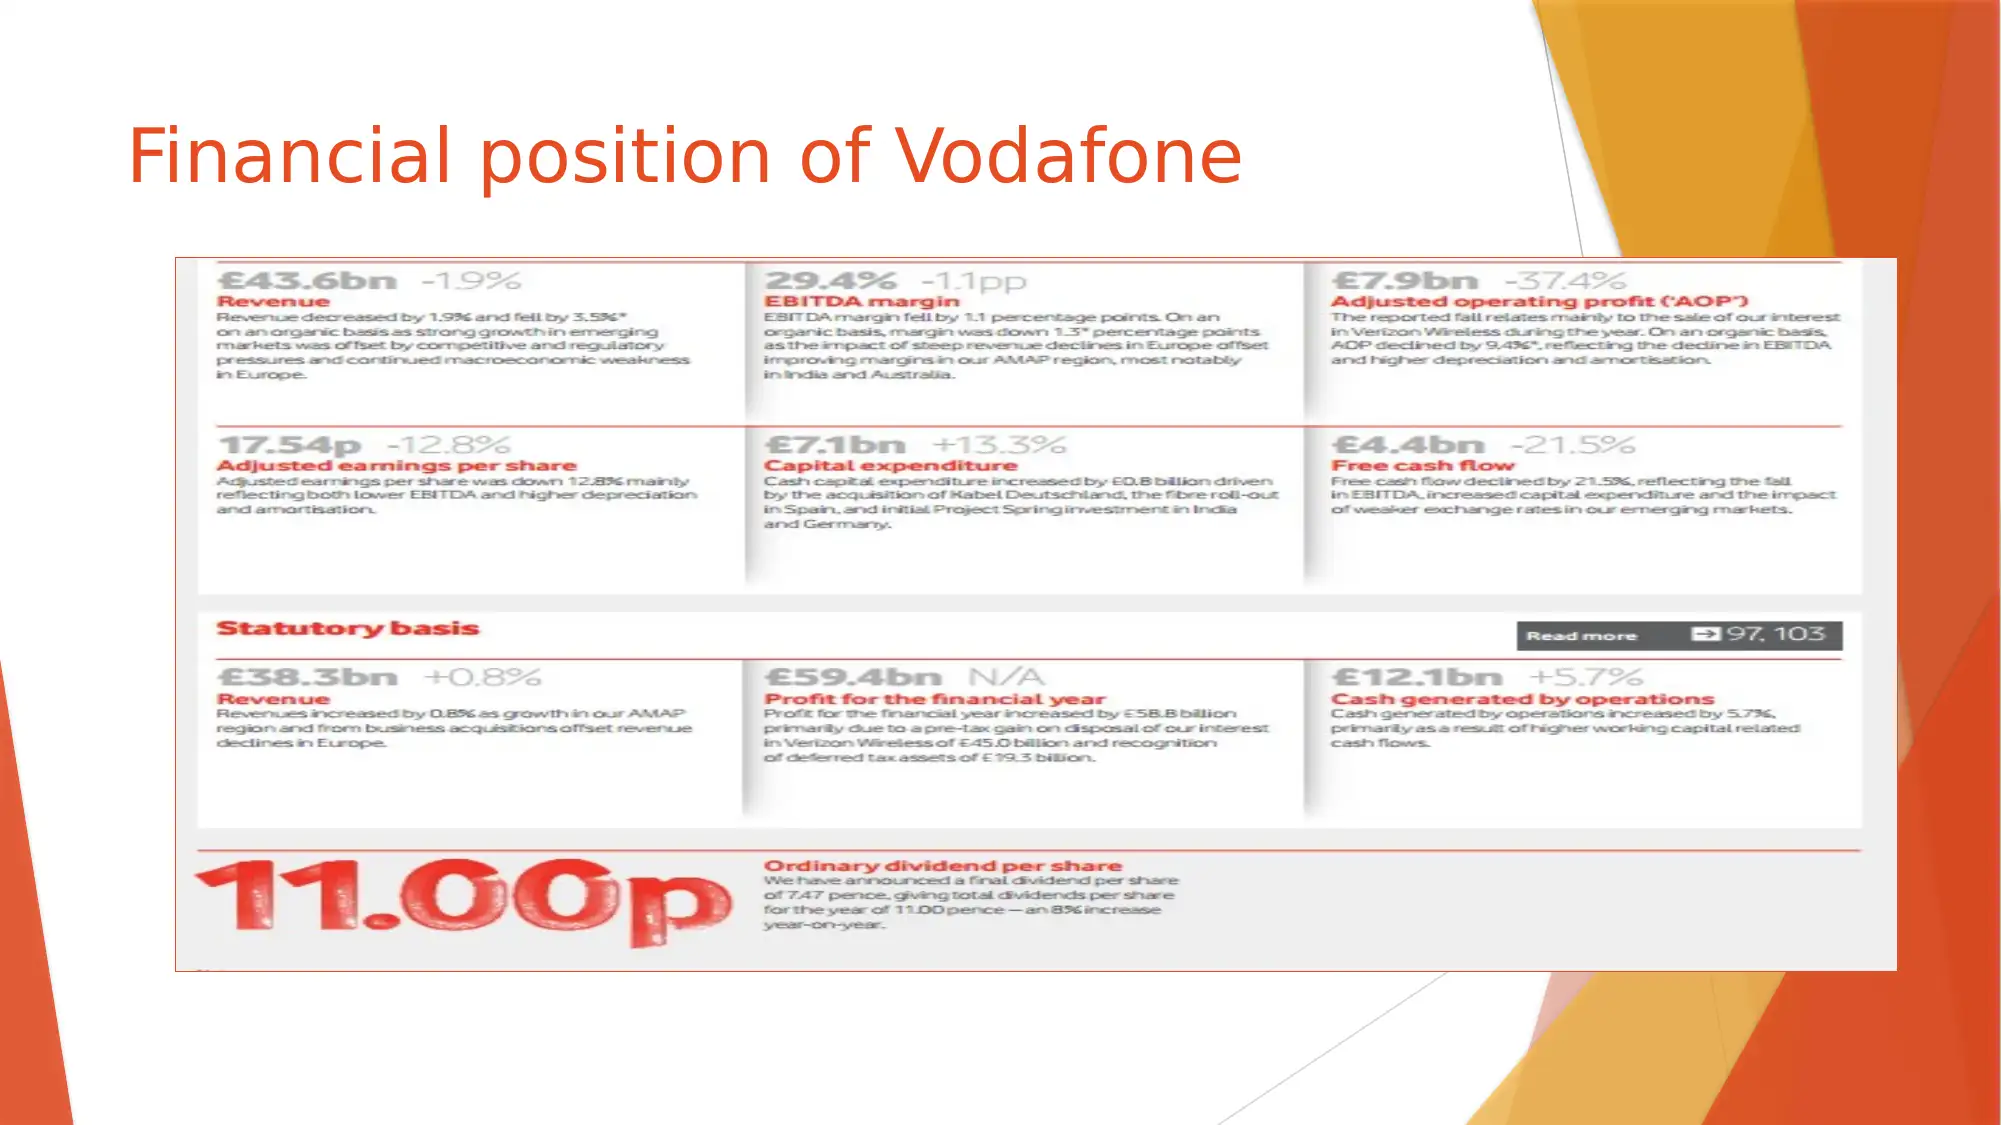
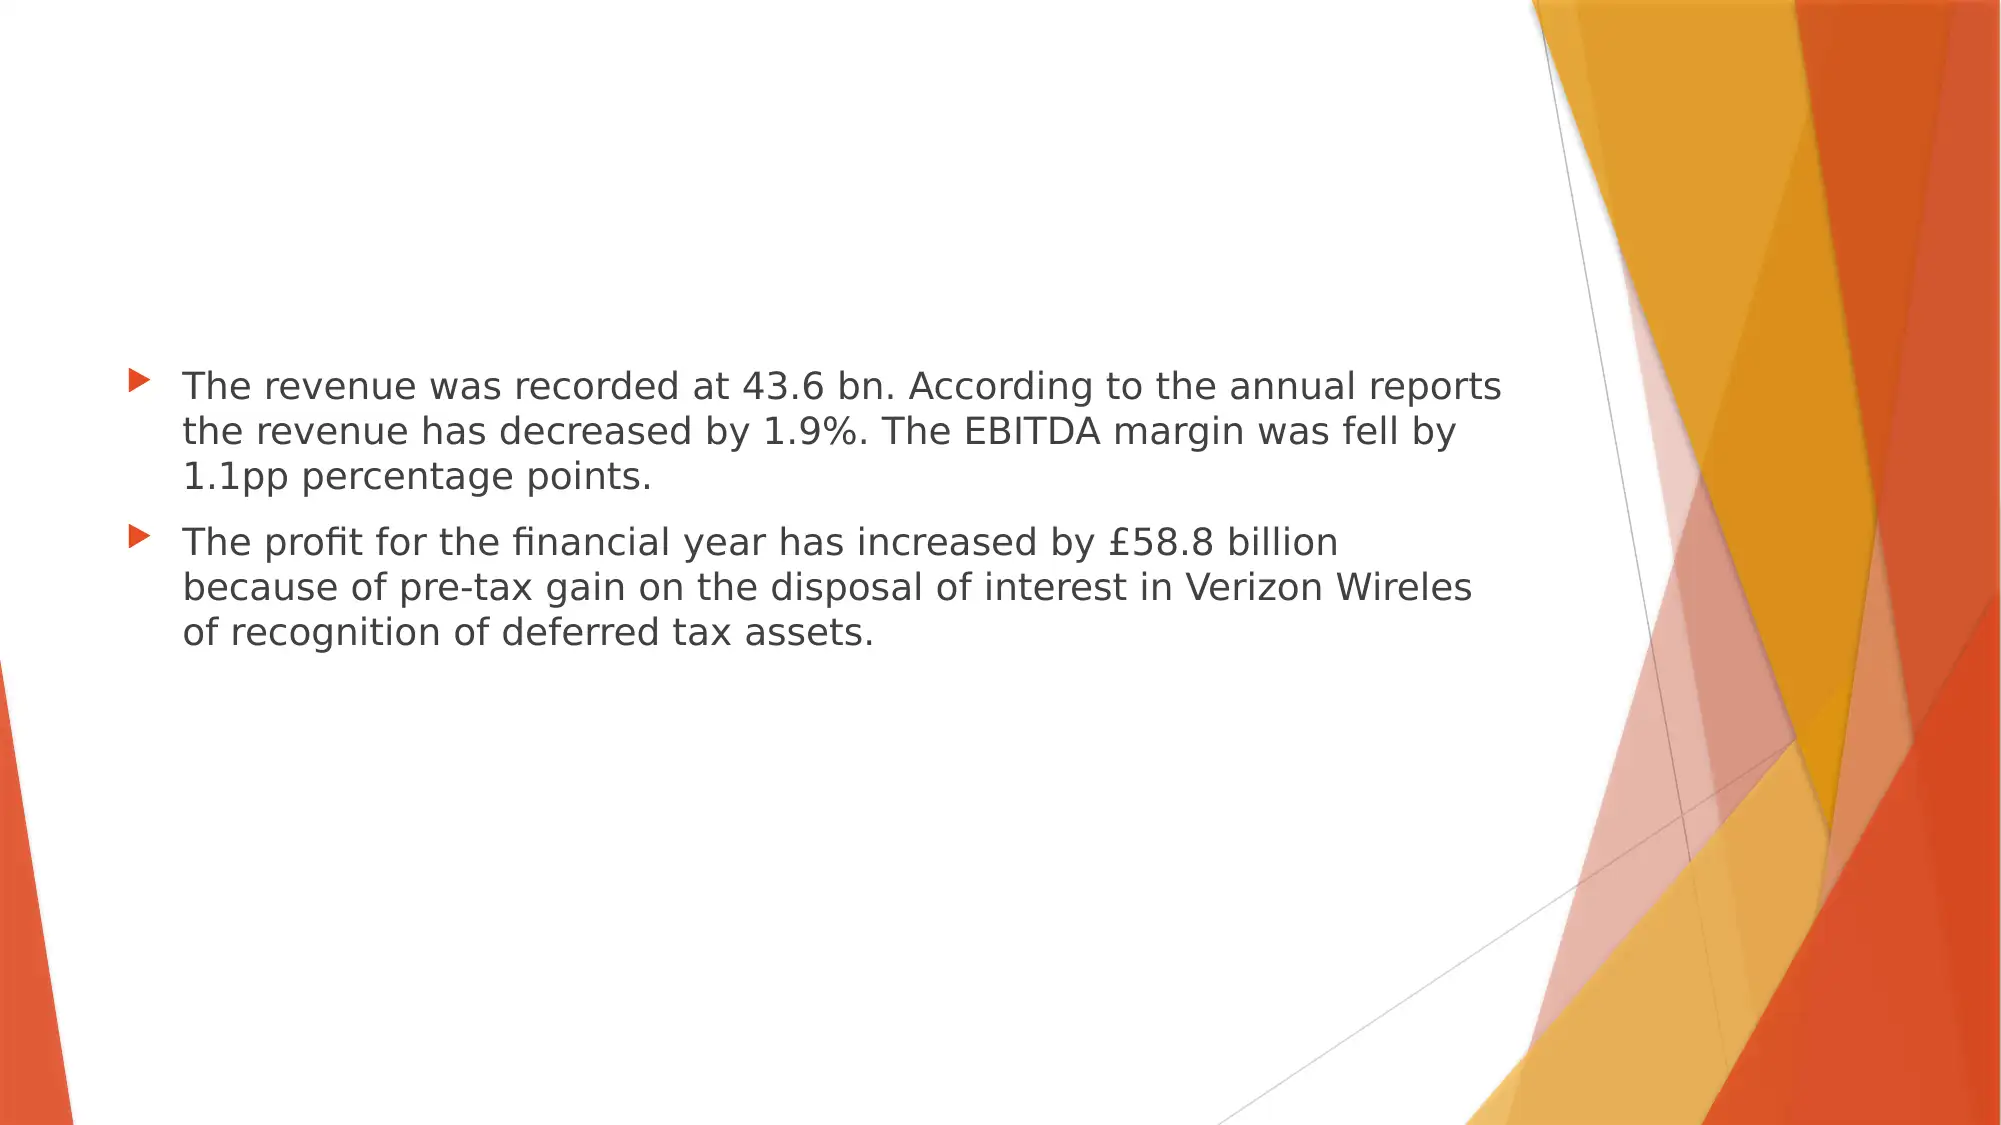
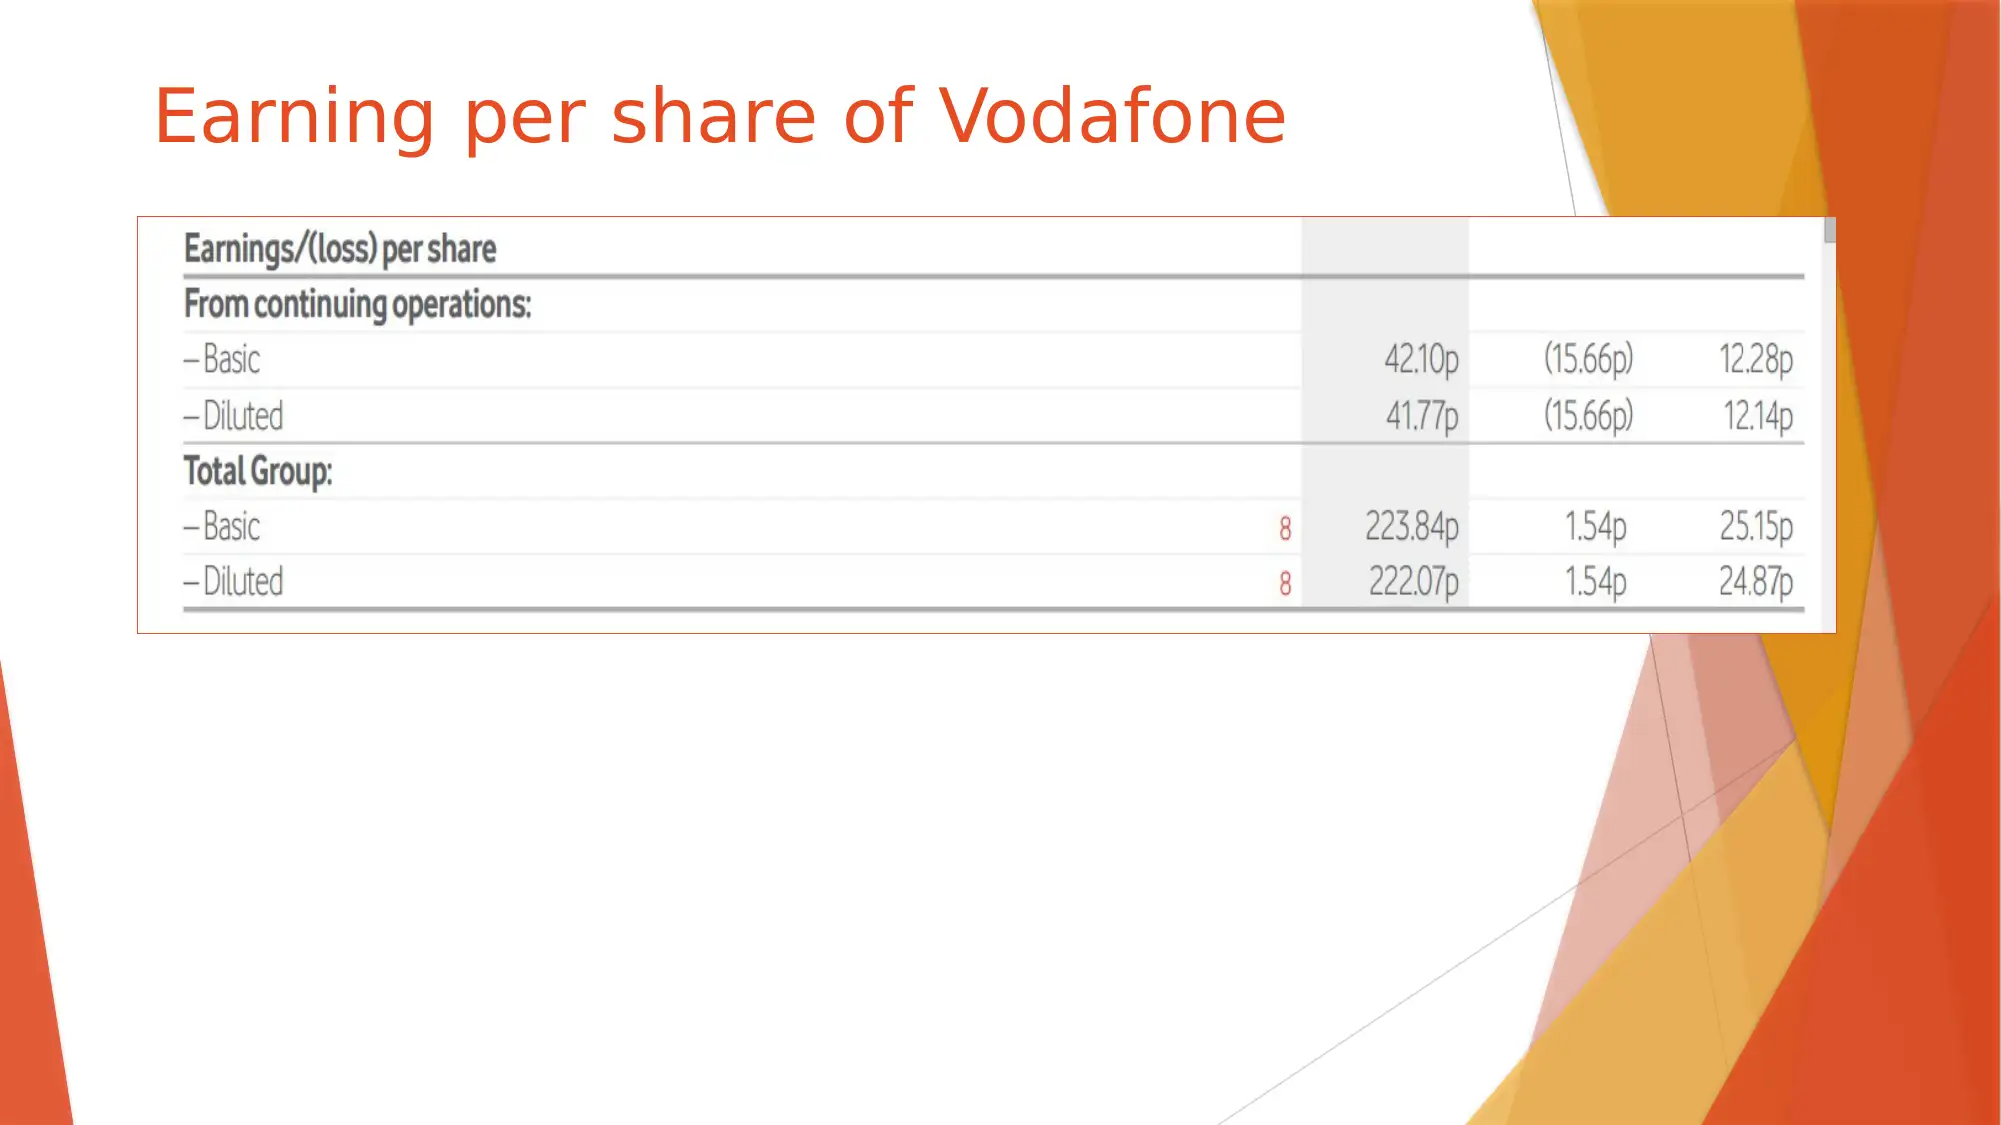
This presentation provides a financial analysis of Vodafone PLC, focusing on ratio calculations derived from the company's financial statements, including the balance sheet, cash flow statement, and income statement. Key ratios such as current ratio, quick ratio, gross profit margin, operating profit margin, ROCE, receivable days, payable days, inventory days, gearing, dividend yield, earnings per share, and price-earnings ratio are analyzed to evaluate Vodafone's financial position. The presentation highlights a revenue of £43.6 billion, a decrease of 1.9%, and a decrease in EBITDA margin by 1.1 percentage points. The profit for the financial year increased by £58.8 billion due to pre-tax gain on the disposal of interest in Verizon Wireless and recognition of deferred tax assets, resulting in higher earning per share. The analysis concludes that Vodafone appears profitable for shareholders, with adequate profits for distribution and potential stock price increase, presenting opportunities for new investors as the company adapts to evolving market dynamics. Desklib provides more solved assignments.
Document Page
TASK 7
PRESENTATION
tabler-icon-diamond-filled.svg

Paraphrase This Document

Need a fresh take? Get an instant paraphrase of this document with our AI Paraphraser
Document Page
Introduction
Financial information produced from the financial statements is of
great importance for the company. It helps in taking many crucial
monetary decision related to the business. The purpose of this report
is to analyse the financial performance of Vodafone PLC on the basis
of ratio calculation and annual statements
Document Page
Financial statements
Balance Sheet
Cash flow statement
Income statement
Document Page
Ratio analysis of Vodafone
Current Ratio
Quick ratio
Gross Profit Margin
Operating Profit Margin
ROCE (Return on Capital Employed)
tabler-icon-diamond-filled.svg

Paraphrase This Document

Need a fresh take? Get an instant paraphrase of this document with our AI Paraphraser
Document Page
Receivable Days
Payable Days
Inventory Days
Gearing
Dividend Yield –
Earnings Per Share
Price Earnings Ratio
Document Page
Financial position of Vodafone
Document Page
The revenue was recorded at 43.6 bn. According to the annual reports
the revenue has decreased by 1.9%. The EBITDA margin was fell by
1.1pp percentage points.
The profit for the financial year has increased by £58.8 billion
because of pre-tax gain on the disposal of interest in Verizon Wireles
of recognition of deferred tax assets.
tabler-icon-diamond-filled.svg

Paraphrase This Document

Need a fresh take? Get an instant paraphrase of this document with our AI Paraphraser
Document Page
Earning per share of Vodafone
Document Page
Conclusion
Vodafone is looking profitable on a shareholder basis
Company is having adequate profits to be distributed among the
shareholders
Higher earning per share can increase the stock price.
This can be an opportunity for the new investors
Their business is constantly evolving to adapt to changes in the
customer behaviour, technology, regulation and the competitive
landscape.
chevron_up_icon
1 out of 9
circle_padding
hide_on_mobile
zoom_out_icon
[object Object]