Financial Performance Analysis: Vodafone & Talk-Talk Telecom Plc
VerifiedAdded on 2023/06/03
|18
|4254
|135
Report
AI Summary
This report conducts a financial analysis of Vodafone Group Plc. and Talk-Talk Telecom Group Plc., two leading telecommunication companies in the UK, using ratio analysis based on their annual reports for the year ending March 31, 2016. It includes both intra-firm (comparing FY 2016 with FY 2015) and inter-firm comparisons to assess profitability, liquidity, efficiency, and solvency. The analysis reveals insights into each company's financial health, highlighting strengths and weaknesses, and identifying factors contributing to competitive advantages. Limitations of ratio analysis due to differing accounting policies and currency differences are also acknowledged.

Running Head: Financial and Auditing Studies
Financial Accounting and Auditing and Taxation
Financial Accounting and Auditing and Taxation
Paraphrase This Document
Need a fresh take? Get an instant paraphrase of this document with our AI Paraphraser
Running Head: Financial and Auditing Studies
Introduction
Purpose and objective of the report:
This report presents the financial analysis of two leading corporations: Vodafone Group Plc.
and Talk-Talk Telecom Group Plc. Both the companies are operating in the
telecommunication industry of United Kingdom and also are listed on the London Stock
Exchange. The financial analysis is undertaken to assess the financial health of both the
companies using the key technique of financial analysis i.e. Ratio analysis. As a part of ratio
analysis various financial ratios are determined to evaluate the company’s financial
performance in terms of profitability, liquidity, efficiency, solvency and its investment worth.
The financial information in relation to the said aspects is derived from the annual reports for
the year ending on 31st March, 2016. Both, inter-firm and intra-firm comparison of the
financial performance is carried out under this report. The intra-firm analysis of performance
of both the companies is carried by comparing the financial results of FY 2016 with that of
FY 2015 in order to determine whether the overall financial performance has improved or
deteriorated and to identify the reasons of the variation in the performance over the last two
years. The inter-firm analysis is undertaken to identify and analyse as to which company is
performing better and what are the factors that have contributed to provide competitive
advantage to one company over other.
Background of the companies
Vodafone Group Plc. had started its business in 1984 and is headquartered in Newbury,
United Kingdom. The company operates its business in Europe, Africa, Middle East and Asia
Pacific Regions. It provides a wide range of products of mobile services to its customers such
as call, text, broadband, voicemails, mobile money services, television offerings and various
other communications solutions like Vodafone Meet Anywhere and Vodafone One Net
Running Head: Financial and Auditing Studies
Enterprise. Moreover, Vodafone provides internet of things connection to the users of its
network so as to allow them to communicate in the secured and reliable manner over the
internet using its cloud services. Further, various carrier services are also being provided by
the company like for example international voice, IP transit and message services. Along
with the said services, Vodafone is also engaged in the provision of mobile virtual network
services. Currently, the company is serving over 536 million customers for its mobile
services and around 20 million customers for its broadband services. The company has a
customer base which comprises of domestic businesses of varied sizes, commercial units, and
various public sector units at national and international level both. Its 4G network is
successfully running across 90 countries in the world. Vodafone Group is the holding
company of various companies such as Vodafone GmbH, Vodafone Limited, Vodafone
Marketing UK, Quickcomm Pty Limited, Vodafone Espana, S.A.U., CWGNL S.A. and
Vodafone Albania Sh.A.
Talk-Talk Telecom Group Plc. is also a provider of telecommunication services across
London. The company had commenced its operations in 2003 and is headquartered in
London only. It provides its customers a wide range of services such as broadband, voice
telephony, mobile communication and telephone services. Currently, Talk-Talk Group is
serving over 4 million customers from both residential as well as commercial units through
its Talk-Talk business brands. It offers 3 customer propositions: Simply Broadband, Essential
TV and Plus TV. The company is a business to business telecom service provider that is
serving around 180000 business units and public sector units of the nation. The products and
services of the company includes connectivity & networking, hosted solutions, internet
protocol telephone systems and voice as well as data services mainly offered to small and
middle sized units of UK (Financial Times, 2018).
Limitations of comparison under ratio analysis
⊘ This is a preview!⊘
Do you want full access?
Subscribe today to unlock all pages.
Trusted by 1+ million students worldwide
Running Head: Financial and Auditing Studies
Although, ratio analysis is a useful technique of measuring and analysing the financial
performance of the company but it suffers from certain limitations which has influenced the
financial analysis. The problem with this type of financial comparison is that the accounting
policies that have been used by the companies while preparing the financial statements might
be different which does not provide a common ground to carry out the comparison. Also, the
financial statements of both the companies are presented into two different currencies as
Vodafone Group has published its financial reports in Euro Currency whereas Talk-Talk
Group has prepared and published its annual financial statements in Pound Sterling due to
which makes it difficult for the users of report to compare the performances (Foster, 2004).
Ratio Analysis
Refer Appendix for the ratio calculations:
PROFITABILITY
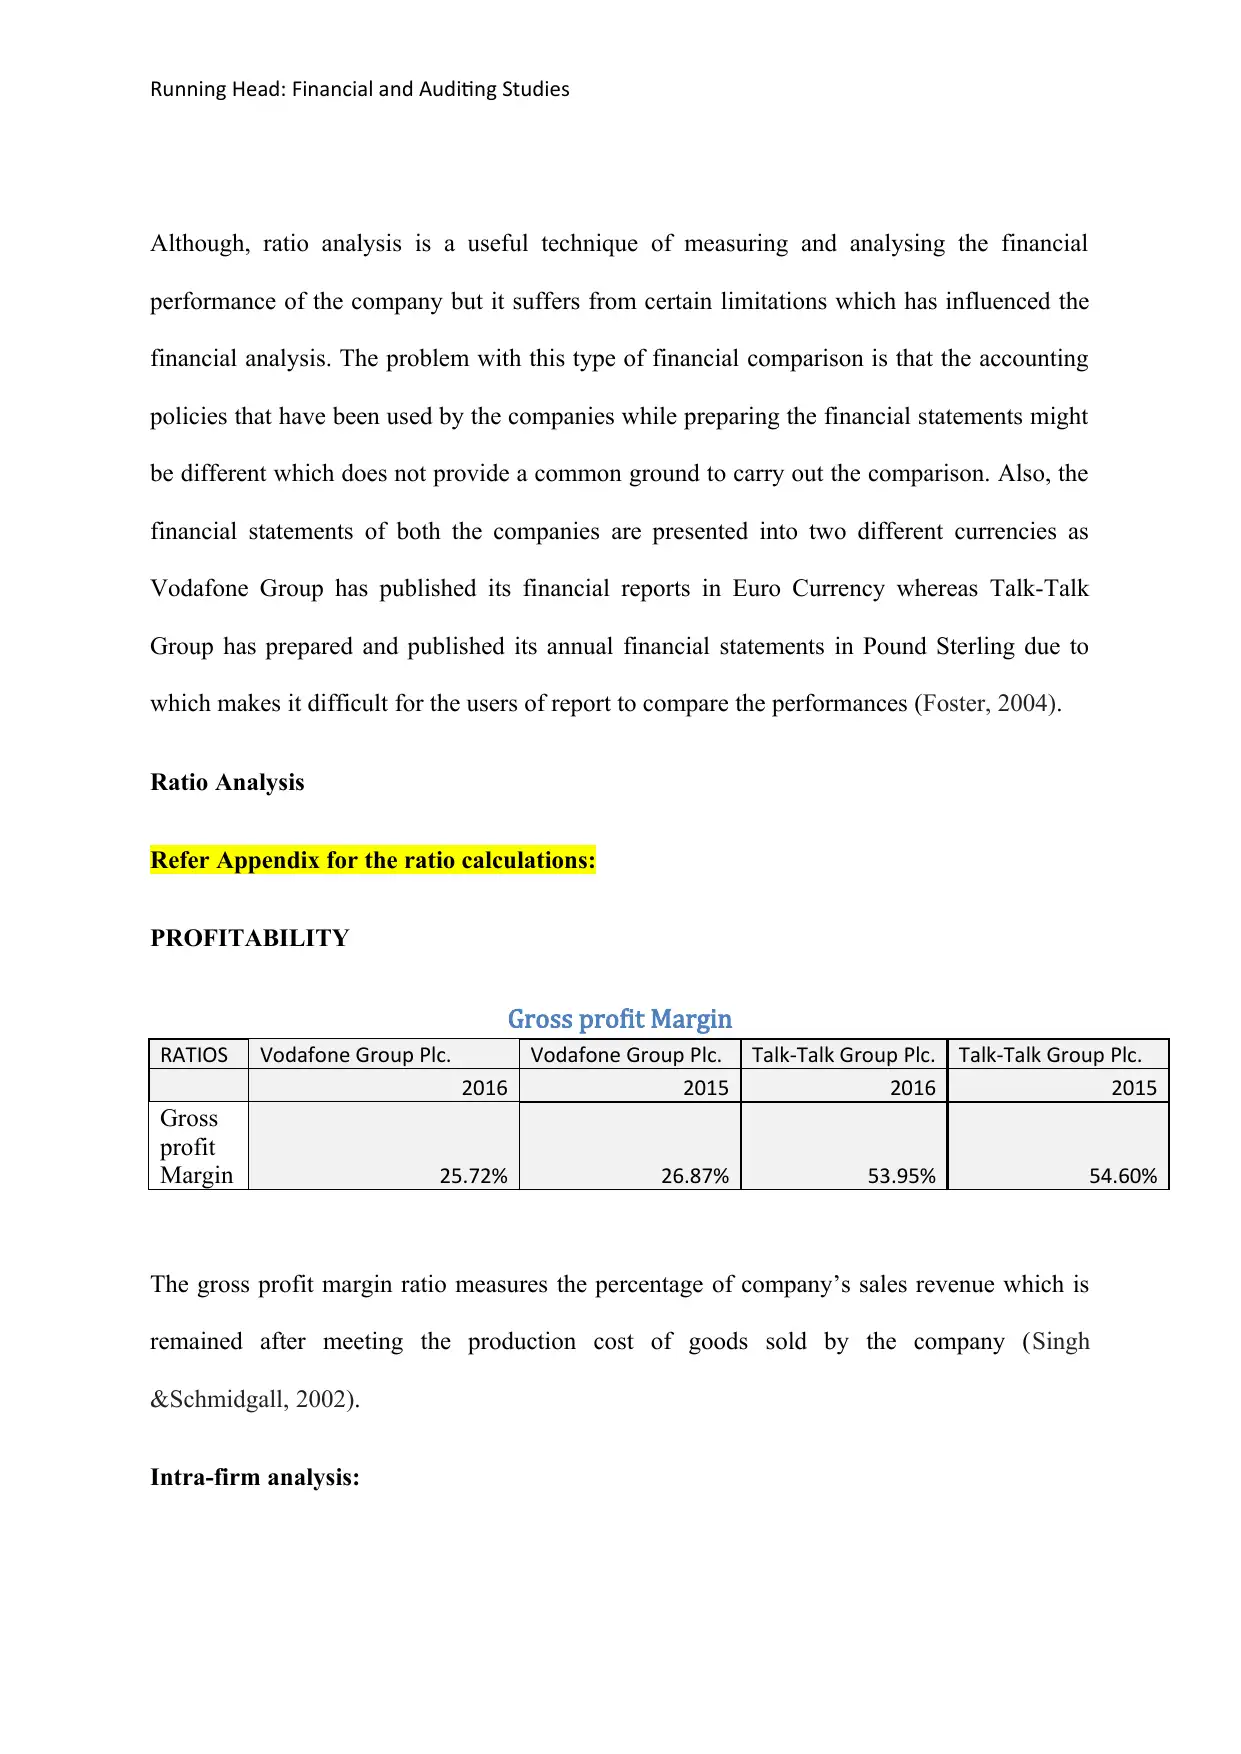
Gross profit Margin
RATIOS Vodafone Group Plc. Vodafone Group Plc. Talk-Talk Group Plc. Talk-Talk Group Plc.
2016 2015 2016 2015
Gross
profit
Margin 25.72% 26.87% 53.95% 54.60%
The gross profit margin ratio measures the percentage of company’s sales revenue which is
remained after meeting the production cost of goods sold by the company (Singh
&Schmidgall, 2002).
Intra-firm analysis:
Although, ratio analysis is a useful technique of measuring and analysing the financial
performance of the company but it suffers from certain limitations which has influenced the
financial analysis. The problem with this type of financial comparison is that the accounting
policies that have been used by the companies while preparing the financial statements might
be different which does not provide a common ground to carry out the comparison. Also, the
financial statements of both the companies are presented into two different currencies as
Vodafone Group has published its financial reports in Euro Currency whereas Talk-Talk
Group has prepared and published its annual financial statements in Pound Sterling due to
which makes it difficult for the users of report to compare the performances (Foster, 2004).
Ratio Analysis
Refer Appendix for the ratio calculations:
PROFITABILITY
Gross profit Margin
RATIOS Vodafone Group Plc. Vodafone Group Plc. Talk-Talk Group Plc. Talk-Talk Group Plc.
2016 2015 2016 2015
Gross
profit
Margin 25.72% 26.87% 53.95% 54.60%
The gross profit margin ratio measures the percentage of company’s sales revenue which is
remained after meeting the production cost of goods sold by the company (Singh
&Schmidgall, 2002).
Intra-firm analysis:
Paraphrase This Document
Need a fresh take? Get an instant paraphrase of this document with our AI Paraphraser
Running Head: Financial and Auditing Studies
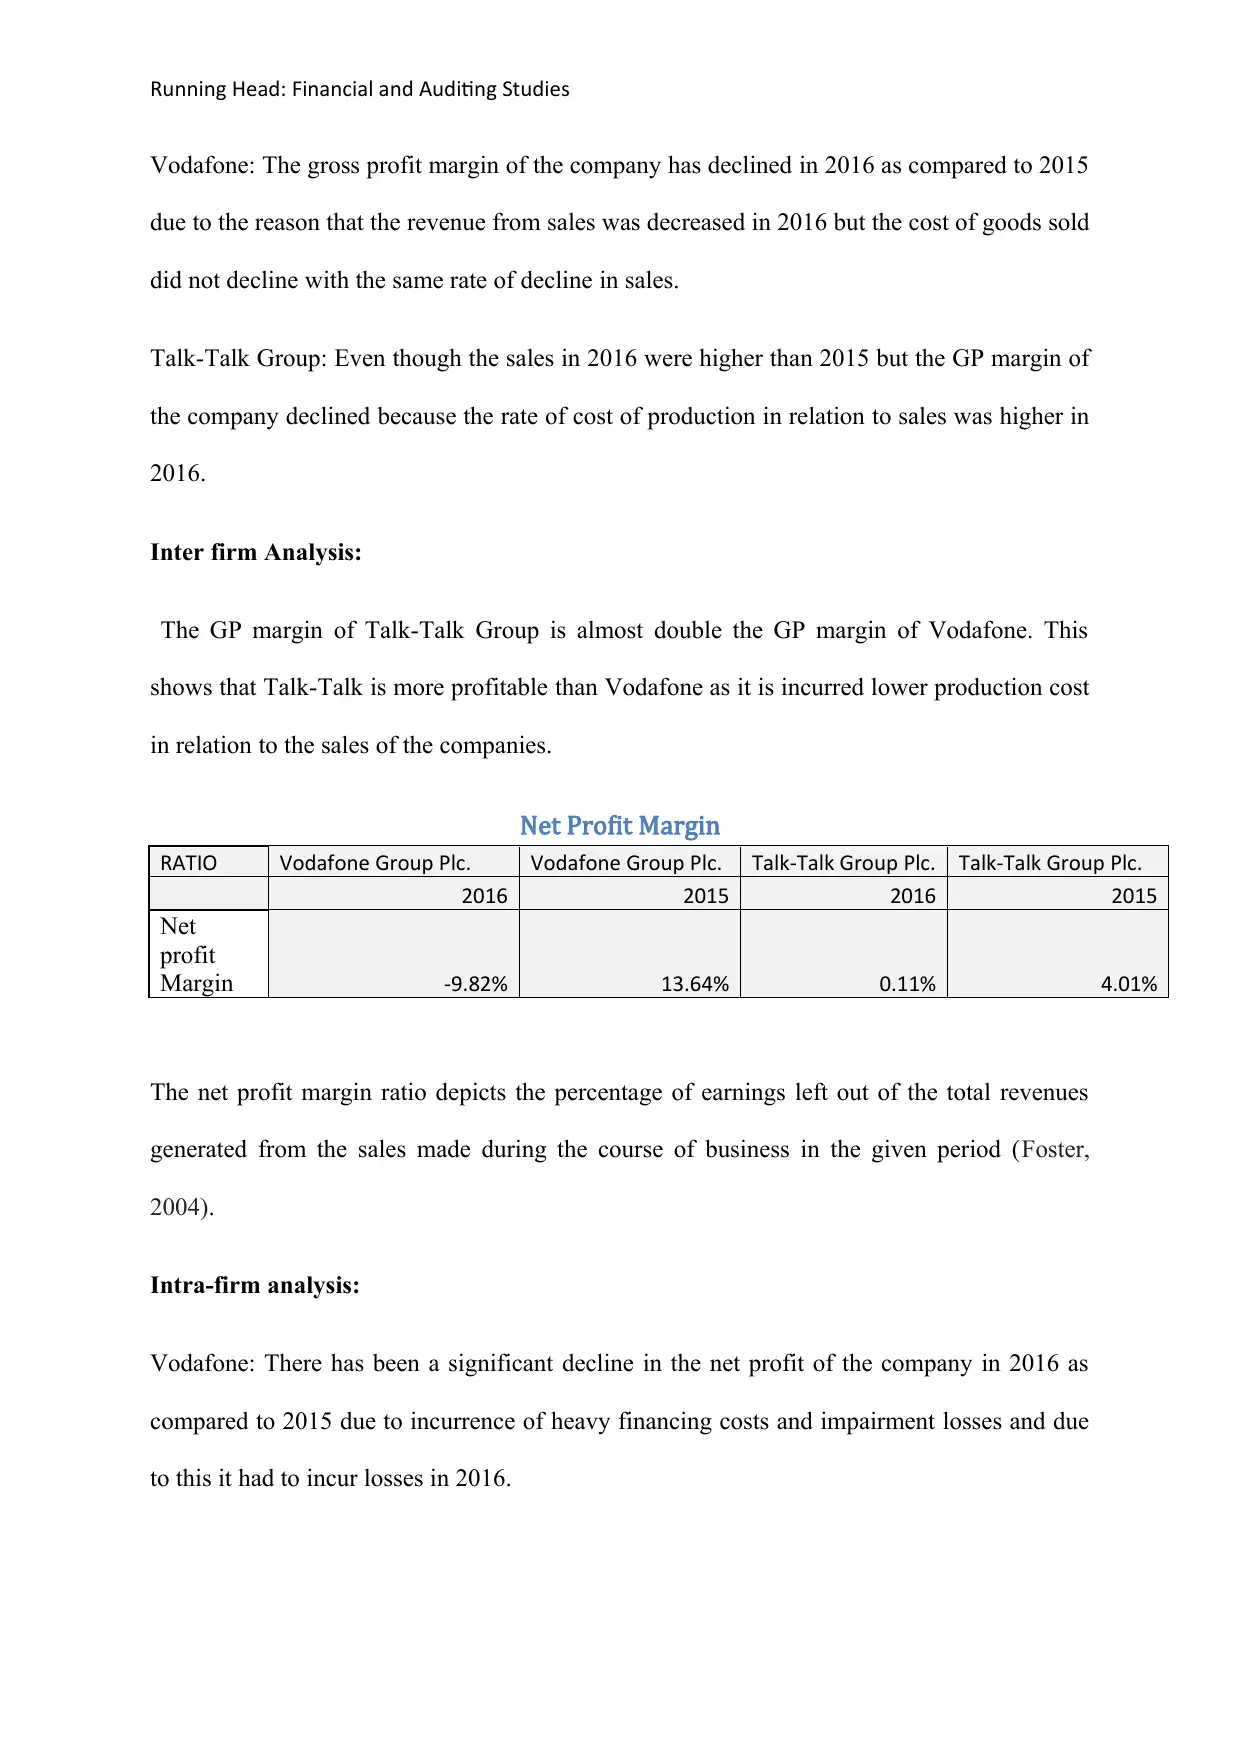
Vodafone: The gross profit margin of the company has declined in 2016 as compared to 2015
due to the reason that the revenue from sales was decreased in 2016 but the cost of goods sold
did not decline with the same rate of decline in sales.
Talk-Talk Group: Even though the sales in 2016 were higher than 2015 but the GP margin of
the company declined because the rate of cost of production in relation to sales was higher in
2016.
Inter firm Analysis:
The GP margin of Talk-Talk Group is almost double the GP margin of Vodafone. This
shows that Talk-Talk is more profitable than Vodafone as it is incurred lower production cost
in relation to the sales of the companies.
Net Profit Margin
RATIO Vodafone Group Plc. Vodafone Group Plc. Talk-Talk Group Plc. Talk-Talk Group Plc.
2016 2015 2016 2015
Net
profit
Margin -9.82% 13.64% 0.11% 4.01%
The net profit margin ratio depicts the percentage of earnings left out of the total revenues
generated from the sales made during the course of business in the given period (Foster,
2004).
Intra-firm analysis:
Vodafone: There has been a significant decline in the net profit of the company in 2016 as
compared to 2015 due to incurrence of heavy financing costs and impairment losses and due
to this it had to incur losses in 2016.
Running Head: Financial and Auditing Studies
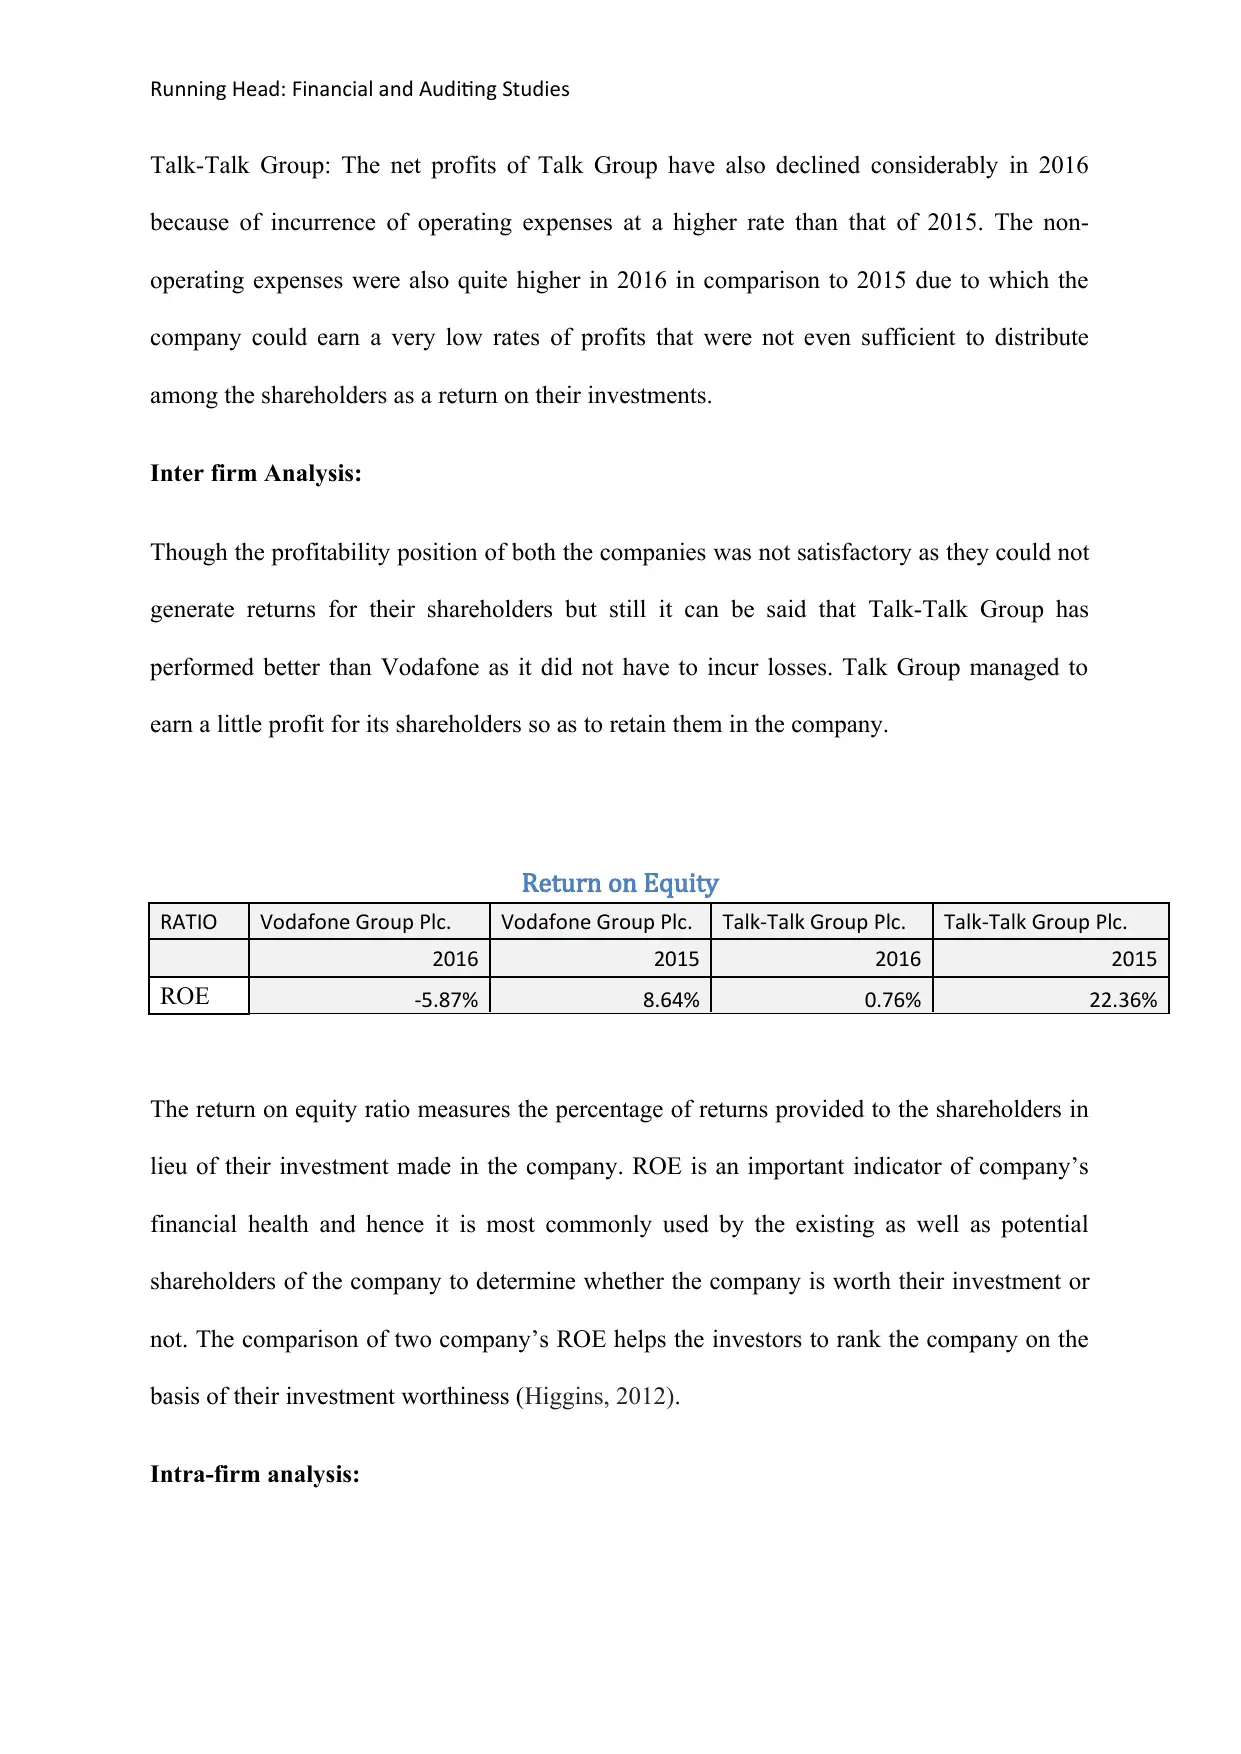
Talk-Talk Group: The net profits of Talk Group have also declined considerably in 2016
because of incurrence of operating expenses at a higher rate than that of 2015. The non-
operating expenses were also quite higher in 2016 in comparison to 2015 due to which the
company could earn a very low rates of profits that were not even sufficient to distribute
among the shareholders as a return on their investments.
Inter firm Analysis:
Though the profitability position of both the companies was not satisfactory as they could not
generate returns for their shareholders but still it can be said that Talk-Talk Group has
performed better than Vodafone as it did not have to incur losses. Talk Group managed to
earn a little profit for its shareholders so as to retain them in the company.
Return on Equity
RATIO Vodafone Group Plc. Vodafone Group Plc. Talk-Talk Group Plc. Talk-Talk Group Plc.
2016 2015 2016 2015
ROE -5.87% 8.64% 0.76% 22.36%
The return on equity ratio measures the percentage of returns provided to the shareholders in
lieu of their investment made in the company. ROE is an important indicator of company’s
financial health and hence it is most commonly used by the existing as well as potential
shareholders of the company to determine whether the company is worth their investment or
not. The comparison of two company’s ROE helps the investors to rank the company on the
basis of their investment worthiness (Higgins, 2012).
Intra-firm analysis:
⊘ This is a preview!⊘
Do you want full access?
Subscribe today to unlock all pages.
Trusted by 1+ million students worldwide
Running Head: Financial and Auditing Studies
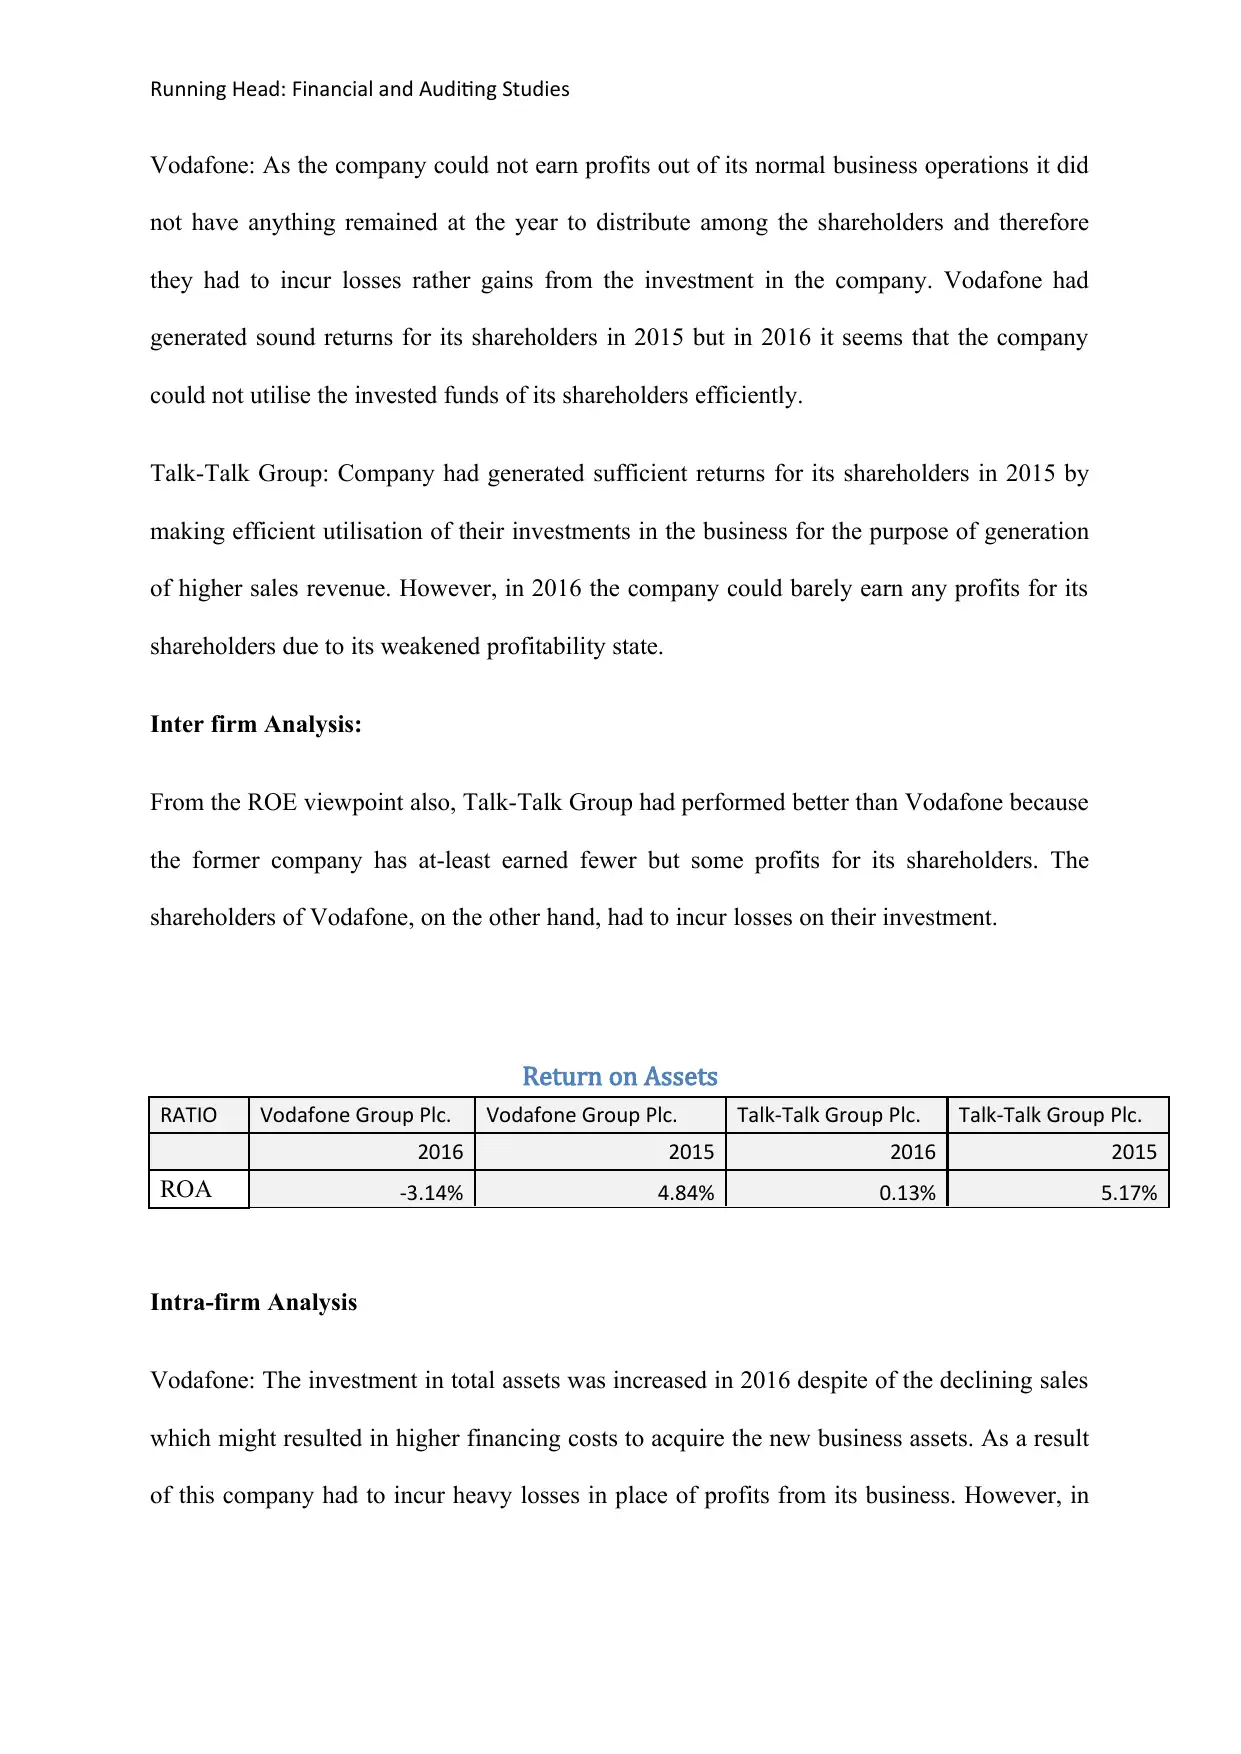
Vodafone: As the company could not earn profits out of its normal business operations it did
not have anything remained at the year to distribute among the shareholders and therefore
they had to incur losses rather gains from the investment in the company. Vodafone had
generated sound returns for its shareholders in 2015 but in 2016 it seems that the company
could not utilise the invested funds of its shareholders efficiently.
Talk-Talk Group: Company had generated sufficient returns for its shareholders in 2015 by
making efficient utilisation of their investments in the business for the purpose of generation
of higher sales revenue. However, in 2016 the company could barely earn any profits for its
shareholders due to its weakened profitability state.
Inter firm Analysis:
From the ROE viewpoint also, Talk-Talk Group had performed better than Vodafone because
the former company has at-least earned fewer but some profits for its shareholders. The
shareholders of Vodafone, on the other hand, had to incur losses on their investment.
Return on Assets
RATIO Vodafone Group Plc. Vodafone Group Plc. Talk-Talk Group Plc. Talk-Talk Group Plc.
2016 2015 2016 2015
ROA -3.14% 4.84% 0.13% 5.17%
Intra-firm Analysis
Vodafone: The investment in total assets was increased in 2016 despite of the declining sales
which might resulted in higher financing costs to acquire the new business assets. As a result
of this company had to incur heavy losses in place of profits from its business. However, in
Paraphrase This Document
Need a fresh take? Get an instant paraphrase of this document with our AI Paraphraser
Running Head: Financial and Auditing Studies
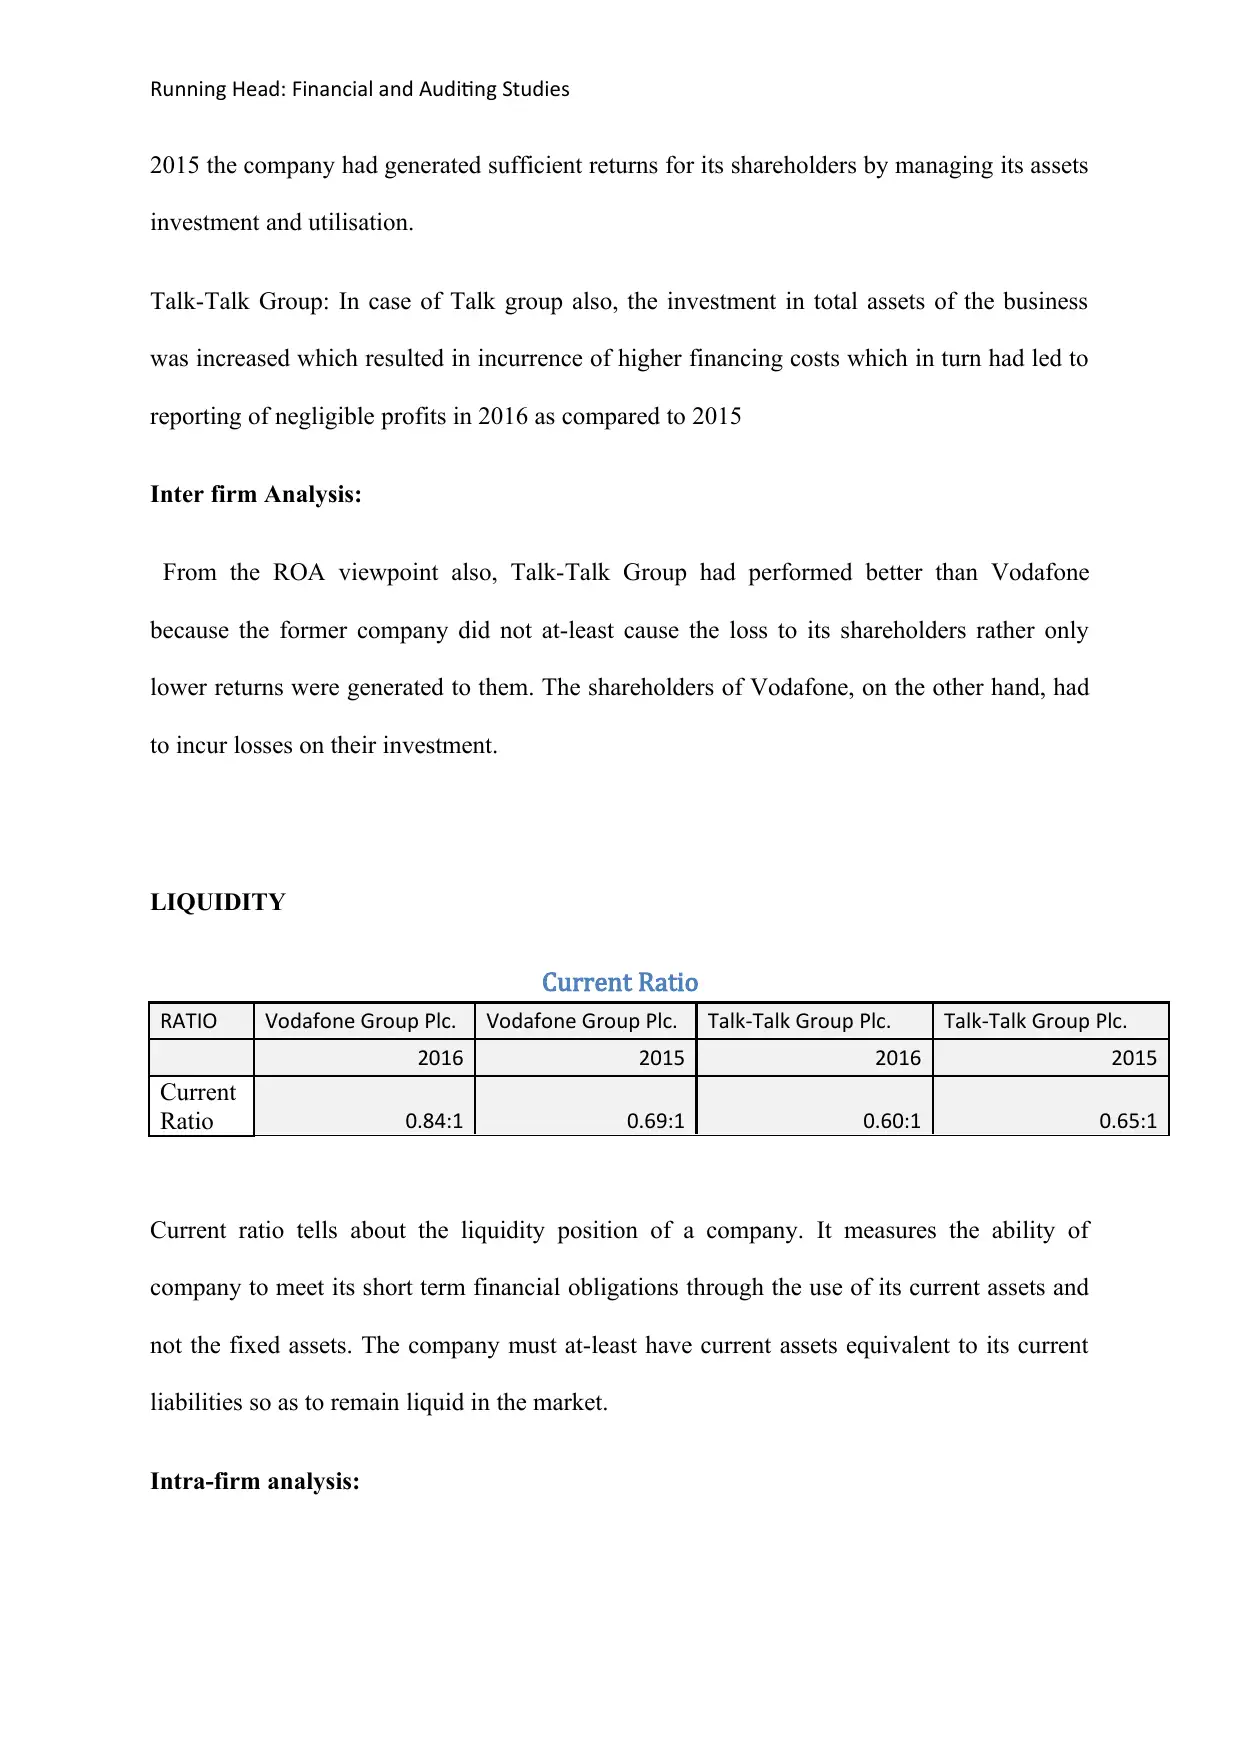
2015 the company had generated sufficient returns for its shareholders by managing its assets
investment and utilisation.
Talk-Talk Group: In case of Talk group also, the investment in total assets of the business
was increased which resulted in incurrence of higher financing costs which in turn had led to
reporting of negligible profits in 2016 as compared to 2015
Inter firm Analysis:
From the ROA viewpoint also, Talk-Talk Group had performed better than Vodafone
because the former company did not at-least cause the loss to its shareholders rather only
lower returns were generated to them. The shareholders of Vodafone, on the other hand, had
to incur losses on their investment.
LIQUIDITY
Current Ratio
RATIO Vodafone Group Plc. Vodafone Group Plc. Talk-Talk Group Plc. Talk-Talk Group Plc.
2016 2015 2016 2015
Current
Ratio 0.84:1 0.69:1 0.60:1 0.65:1
Current ratio tells about the liquidity position of a company. It measures the ability of
company to meet its short term financial obligations through the use of its current assets and
not the fixed assets. The company must at-least have current assets equivalent to its current
liabilities so as to remain liquid in the market.
Intra-firm analysis:
Running Head: Financial and Auditing Studies
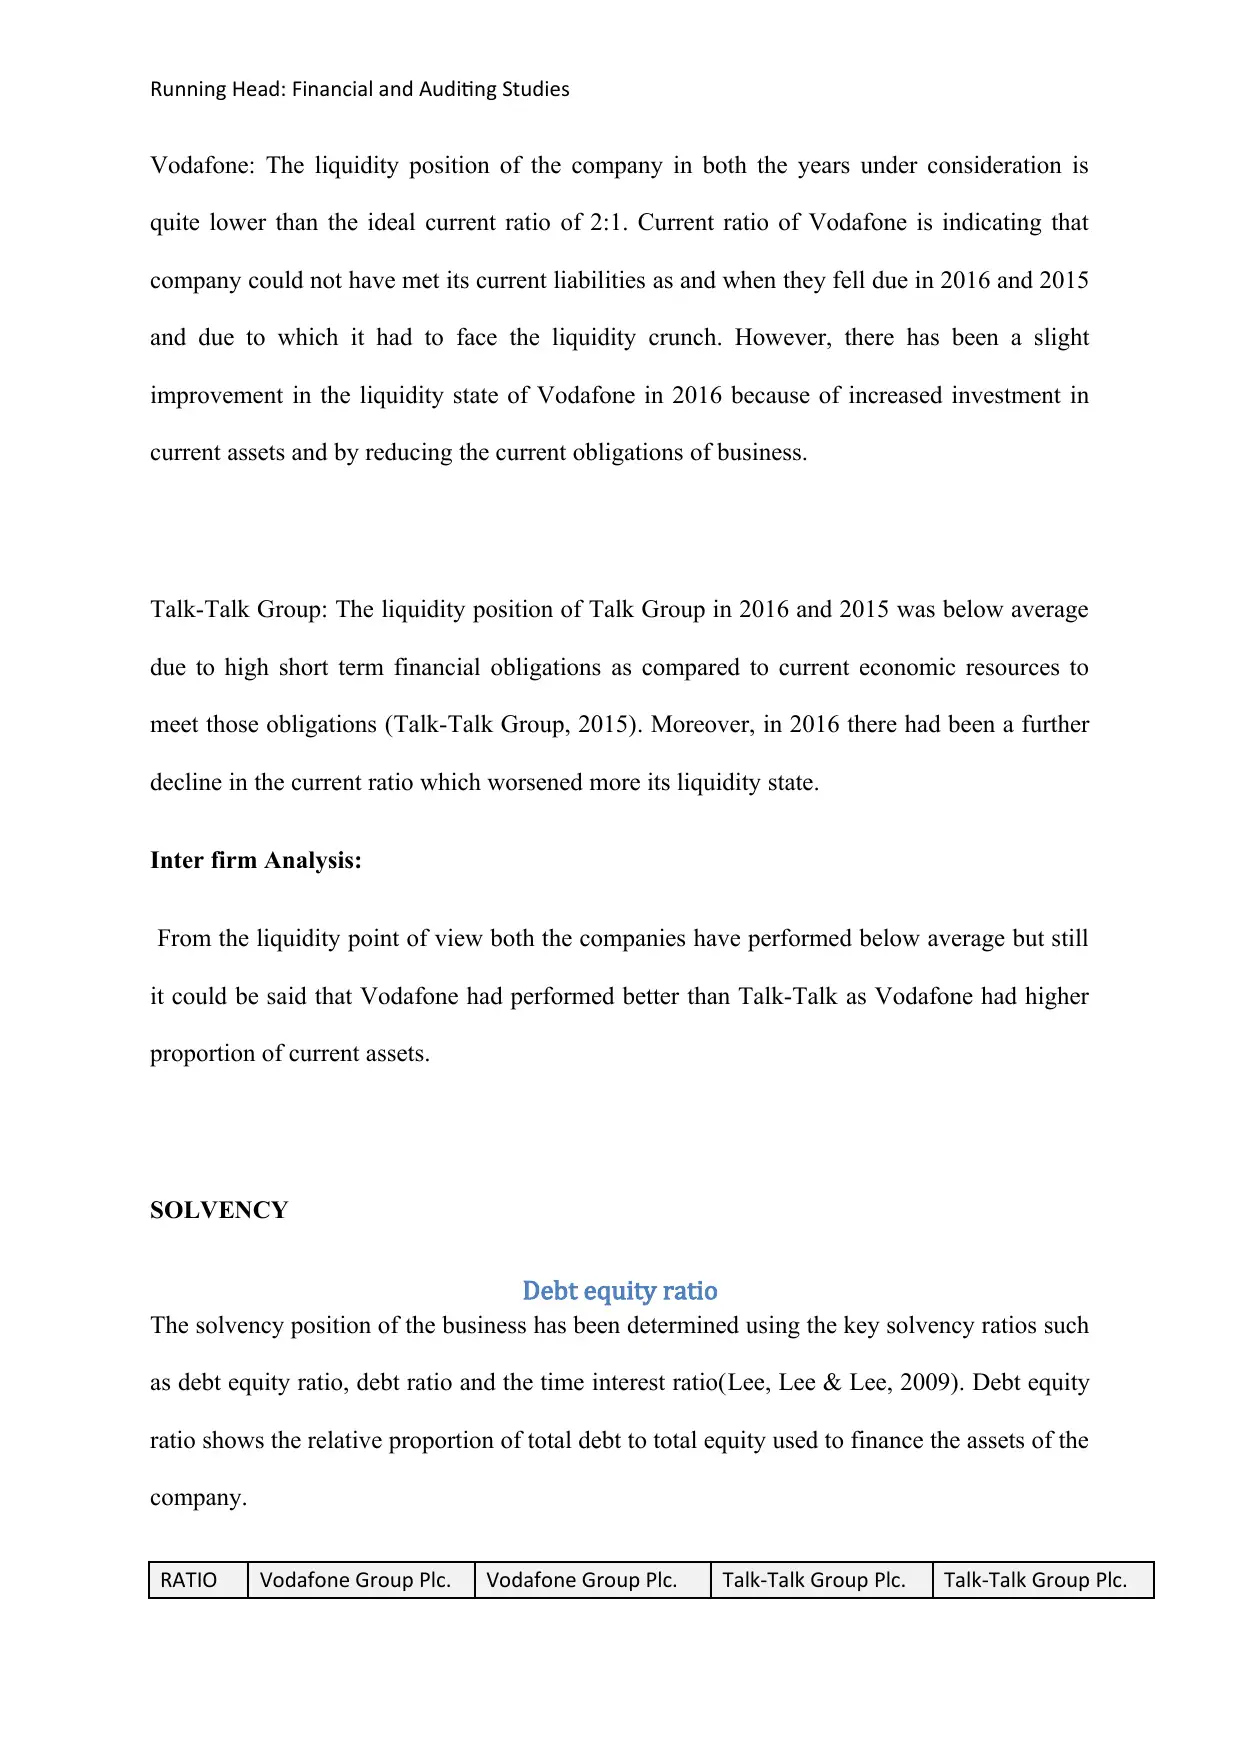
Vodafone: The liquidity position of the company in both the years under consideration is
quite lower than the ideal current ratio of 2:1. Current ratio of Vodafone is indicating that
company could not have met its current liabilities as and when they fell due in 2016 and 2015
and due to which it had to face the liquidity crunch. However, there has been a slight
improvement in the liquidity state of Vodafone in 2016 because of increased investment in
current assets and by reducing the current obligations of business.
Talk-Talk Group: The liquidity position of Talk Group in 2016 and 2015 was below average
due to high short term financial obligations as compared to current economic resources to
meet those obligations (Talk-Talk Group, 2015). Moreover, in 2016 there had been a further
decline in the current ratio which worsened more its liquidity state.
Inter firm Analysis:
From the liquidity point of view both the companies have performed below average but still
it could be said that Vodafone had performed better than Talk-Talk as Vodafone had higher
proportion of current assets.
SOLVENCY
Debt equity ratio
The solvency position of the business has been determined using the key solvency ratios such
as debt equity ratio, debt ratio and the time interest ratio(Lee, Lee & Lee, 2009). Debt equity
ratio shows the relative proportion of total debt to total equity used to finance the assets of the
company.
RATIO Vodafone Group Plc. Vodafone Group Plc. Talk-Talk Group Plc. Talk-Talk Group Plc.
⊘ This is a preview!⊘
Do you want full access?
Subscribe today to unlock all pages.
Trusted by 1+ million students worldwide
Running Head: Financial and Auditing Studies
2016 2015 2016 2015
Debt
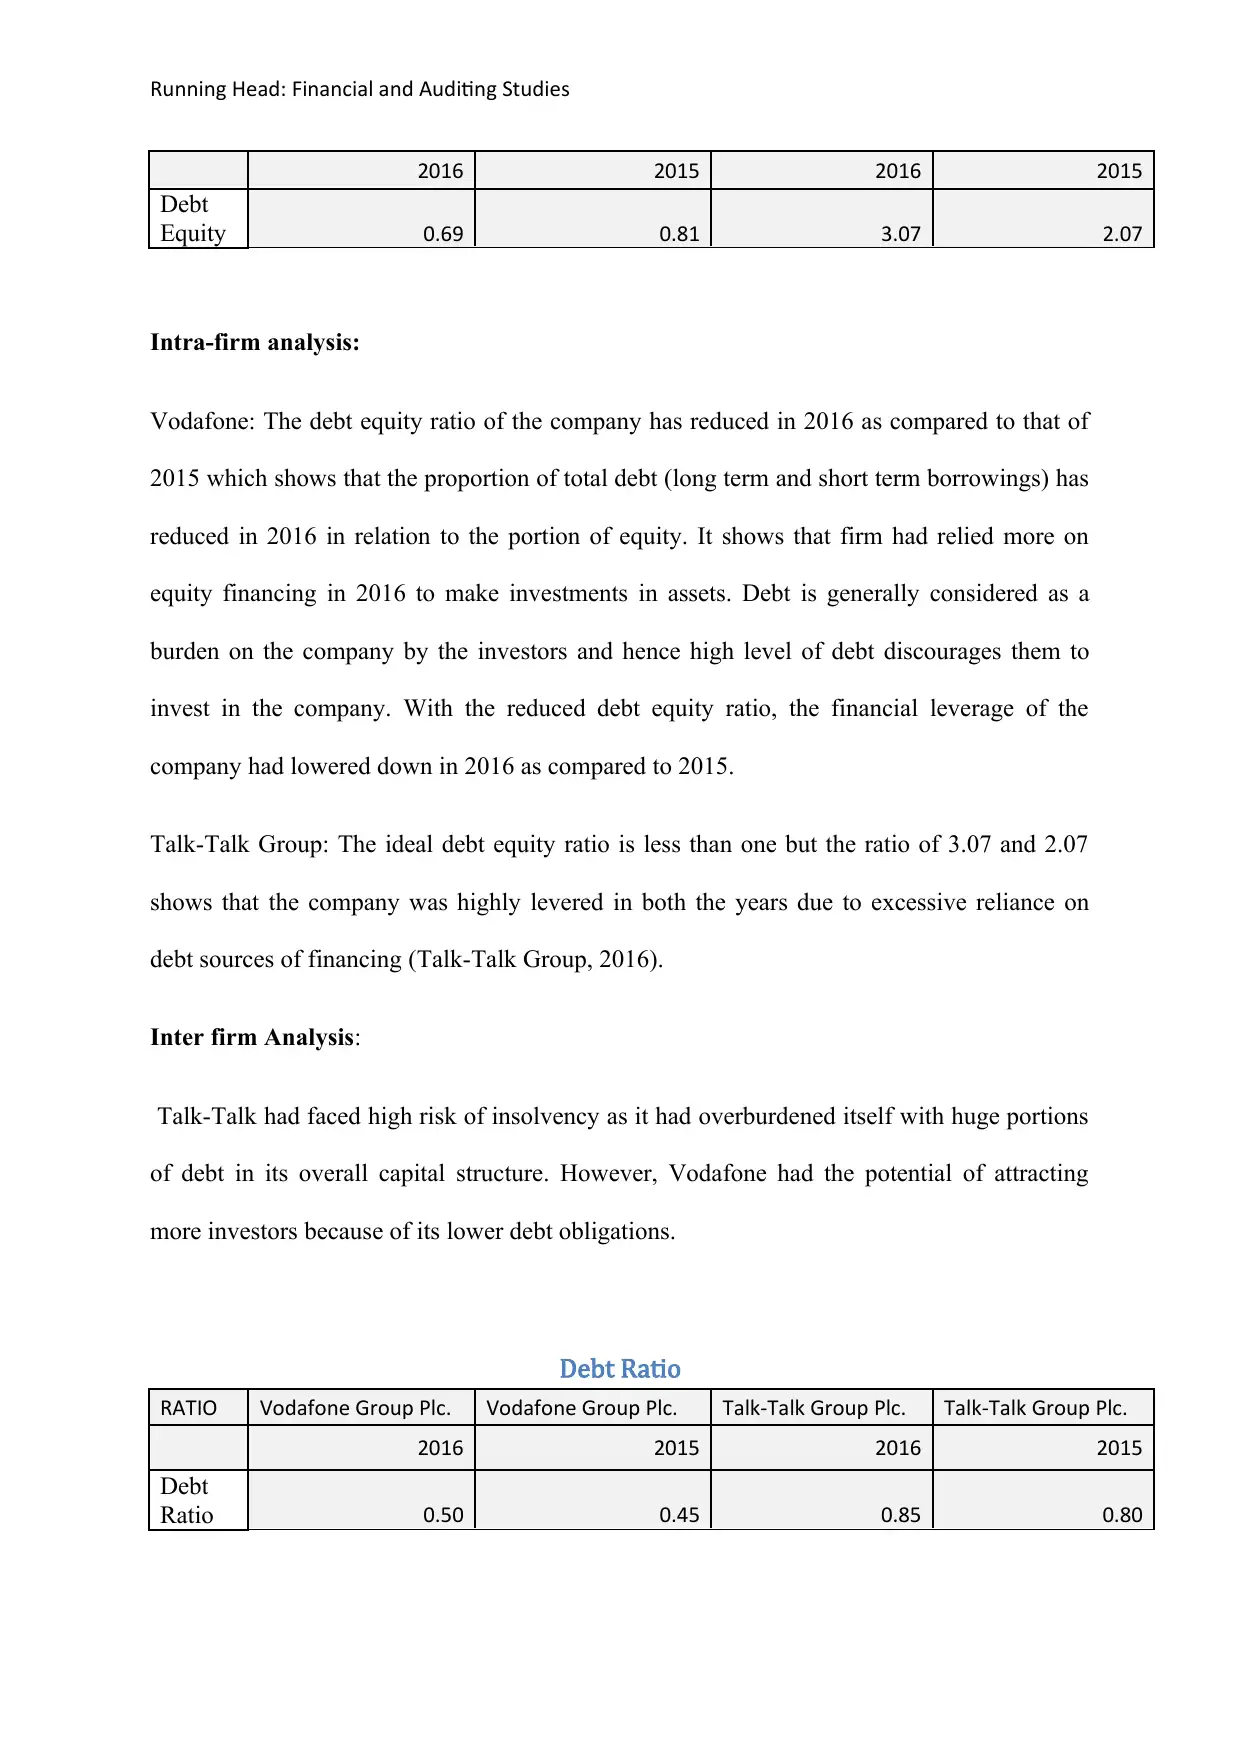
Equity 0.69 0.81 3.07 2.07
Intra-firm analysis:
Vodafone: The debt equity ratio of the company has reduced in 2016 as compared to that of
2015 which shows that the proportion of total debt (long term and short term borrowings) has
reduced in 2016 in relation to the portion of equity. It shows that firm had relied more on
equity financing in 2016 to make investments in assets. Debt is generally considered as a
burden on the company by the investors and hence high level of debt discourages them to
invest in the company. With the reduced debt equity ratio, the financial leverage of the
company had lowered down in 2016 as compared to 2015.
Talk-Talk Group: The ideal debt equity ratio is less than one but the ratio of 3.07 and 2.07
shows that the company was highly levered in both the years due to excessive reliance on
debt sources of financing (Talk-Talk Group, 2016).
Inter firm Analysis:
Talk-Talk had faced high risk of insolvency as it had overburdened itself with huge portions
of debt in its overall capital structure. However, Vodafone had the potential of attracting
more investors because of its lower debt obligations.
Debt Ratio
RATIO Vodafone Group Plc. Vodafone Group Plc. Talk-Talk Group Plc. Talk-Talk Group Plc.
2016 2015 2016 2015
Debt
Ratio 0.50 0.45 0.85 0.80
2016 2015 2016 2015
Debt
Equity 0.69 0.81 3.07 2.07
Intra-firm analysis:
Vodafone: The debt equity ratio of the company has reduced in 2016 as compared to that of
2015 which shows that the proportion of total debt (long term and short term borrowings) has
reduced in 2016 in relation to the portion of equity. It shows that firm had relied more on
equity financing in 2016 to make investments in assets. Debt is generally considered as a
burden on the company by the investors and hence high level of debt discourages them to
invest in the company. With the reduced debt equity ratio, the financial leverage of the
company had lowered down in 2016 as compared to 2015.
Talk-Talk Group: The ideal debt equity ratio is less than one but the ratio of 3.07 and 2.07
shows that the company was highly levered in both the years due to excessive reliance on
debt sources of financing (Talk-Talk Group, 2016).
Inter firm Analysis:
Talk-Talk had faced high risk of insolvency as it had overburdened itself with huge portions
of debt in its overall capital structure. However, Vodafone had the potential of attracting
more investors because of its lower debt obligations.
Debt Ratio
RATIO Vodafone Group Plc. Vodafone Group Plc. Talk-Talk Group Plc. Talk-Talk Group Plc.
2016 2015 2016 2015
Debt
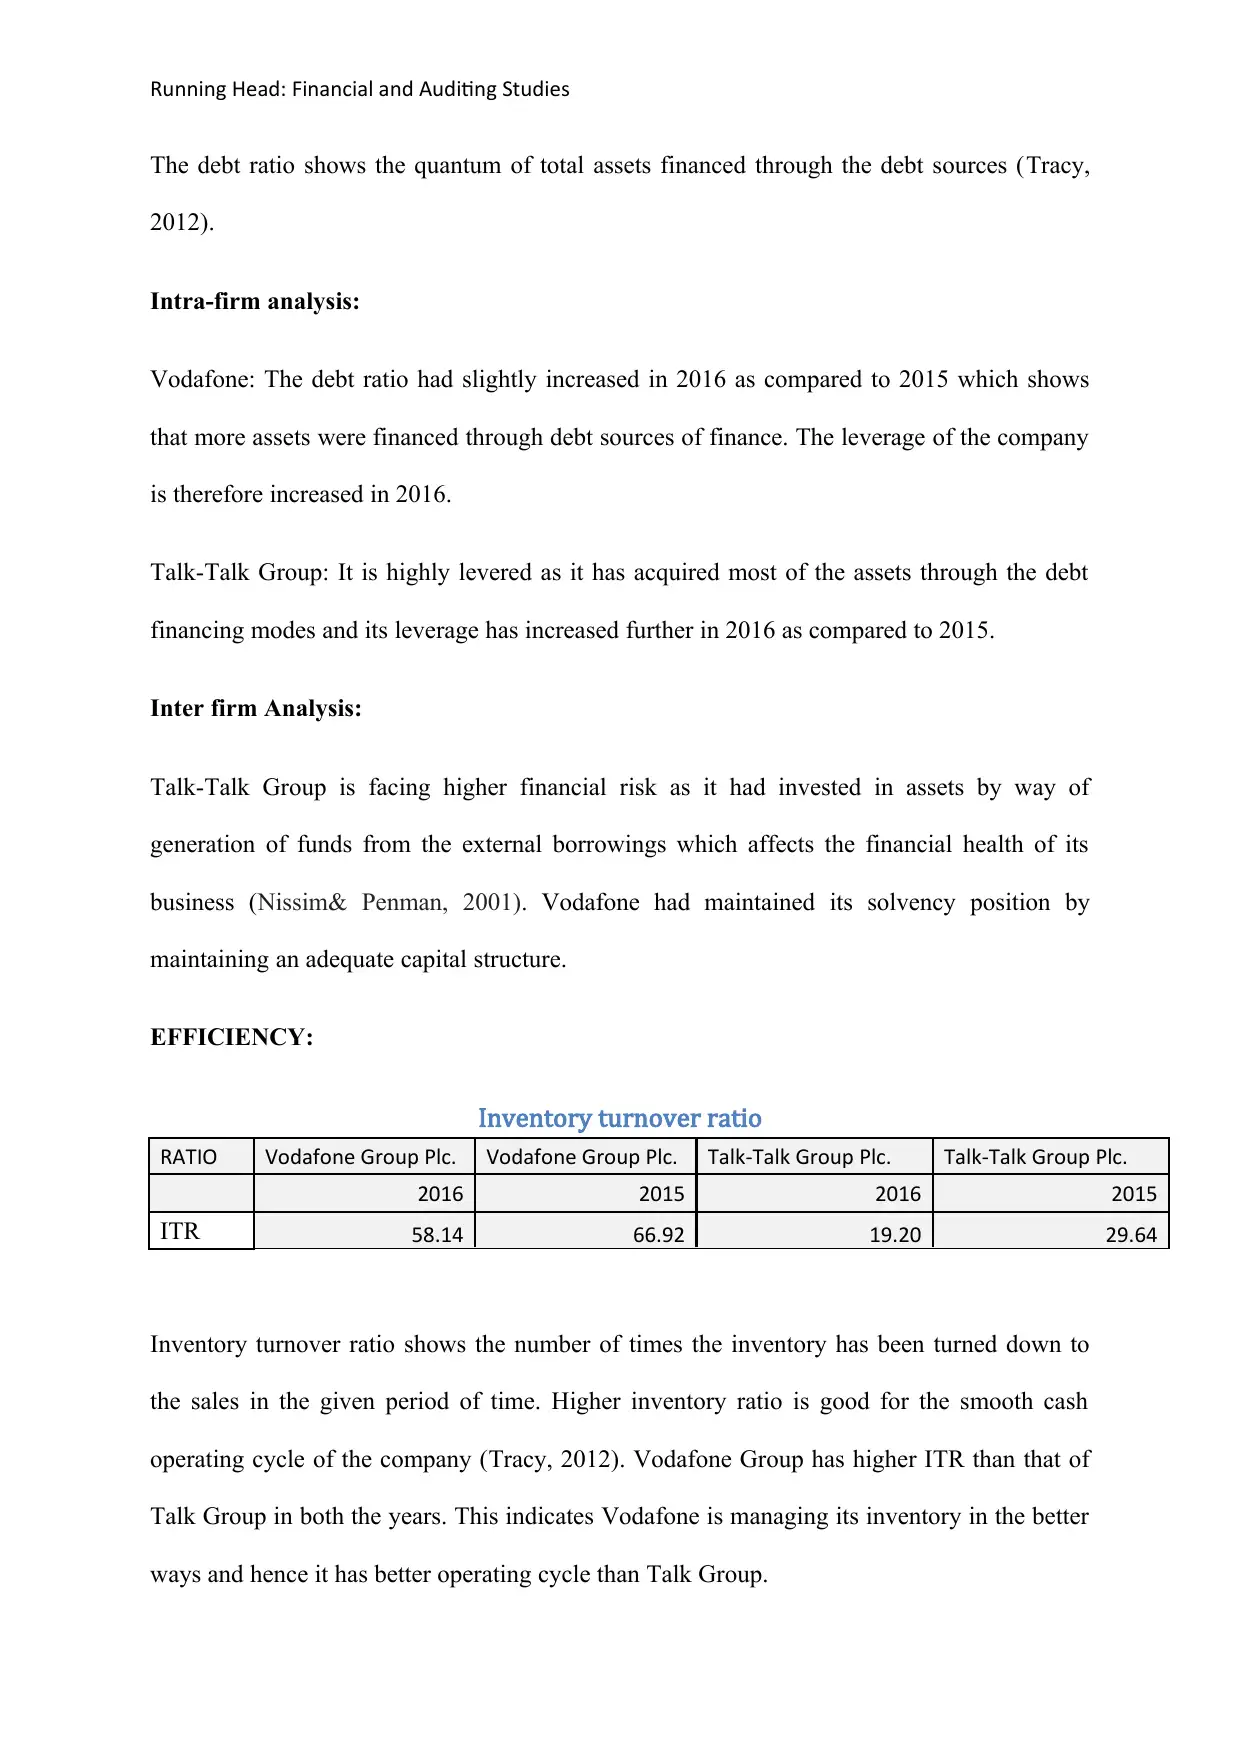
Ratio 0.50 0.45 0.85 0.80
Paraphrase This Document
Need a fresh take? Get an instant paraphrase of this document with our AI Paraphraser
Running Head: Financial and Auditing Studies
The debt ratio shows the quantum of total assets financed through the debt sources (Tracy,
2012).
Intra-firm analysis:
Vodafone: The debt ratio had slightly increased in 2016 as compared to 2015 which shows
that more assets were financed through debt sources of finance. The leverage of the company
is therefore increased in 2016.
Talk-Talk Group: It is highly levered as it has acquired most of the assets through the debt
financing modes and its leverage has increased further in 2016 as compared to 2015.
Inter firm Analysis:
Talk-Talk Group is facing higher financial risk as it had invested in assets by way of
generation of funds from the external borrowings which affects the financial health of its
business (Nissim& Penman, 2001). Vodafone had maintained its solvency position by
maintaining an adequate capital structure.
EFFICIENCY:
Inventory turnover ratio
RATIO Vodafone Group Plc. Vodafone Group Plc. Talk-Talk Group Plc. Talk-Talk Group Plc.
2016 2015 2016 2015
ITR 58.14 66.92 19.20 29.64
Inventory turnover ratio shows the number of times the inventory has been turned down to
the sales in the given period of time. Higher inventory ratio is good for the smooth cash
operating cycle of the company (Tracy, 2012). Vodafone Group has higher ITR than that of
Talk Group in both the years. This indicates Vodafone is managing its inventory in the better
ways and hence it has better operating cycle than Talk Group.
Running Head: Financial and Auditing Studies
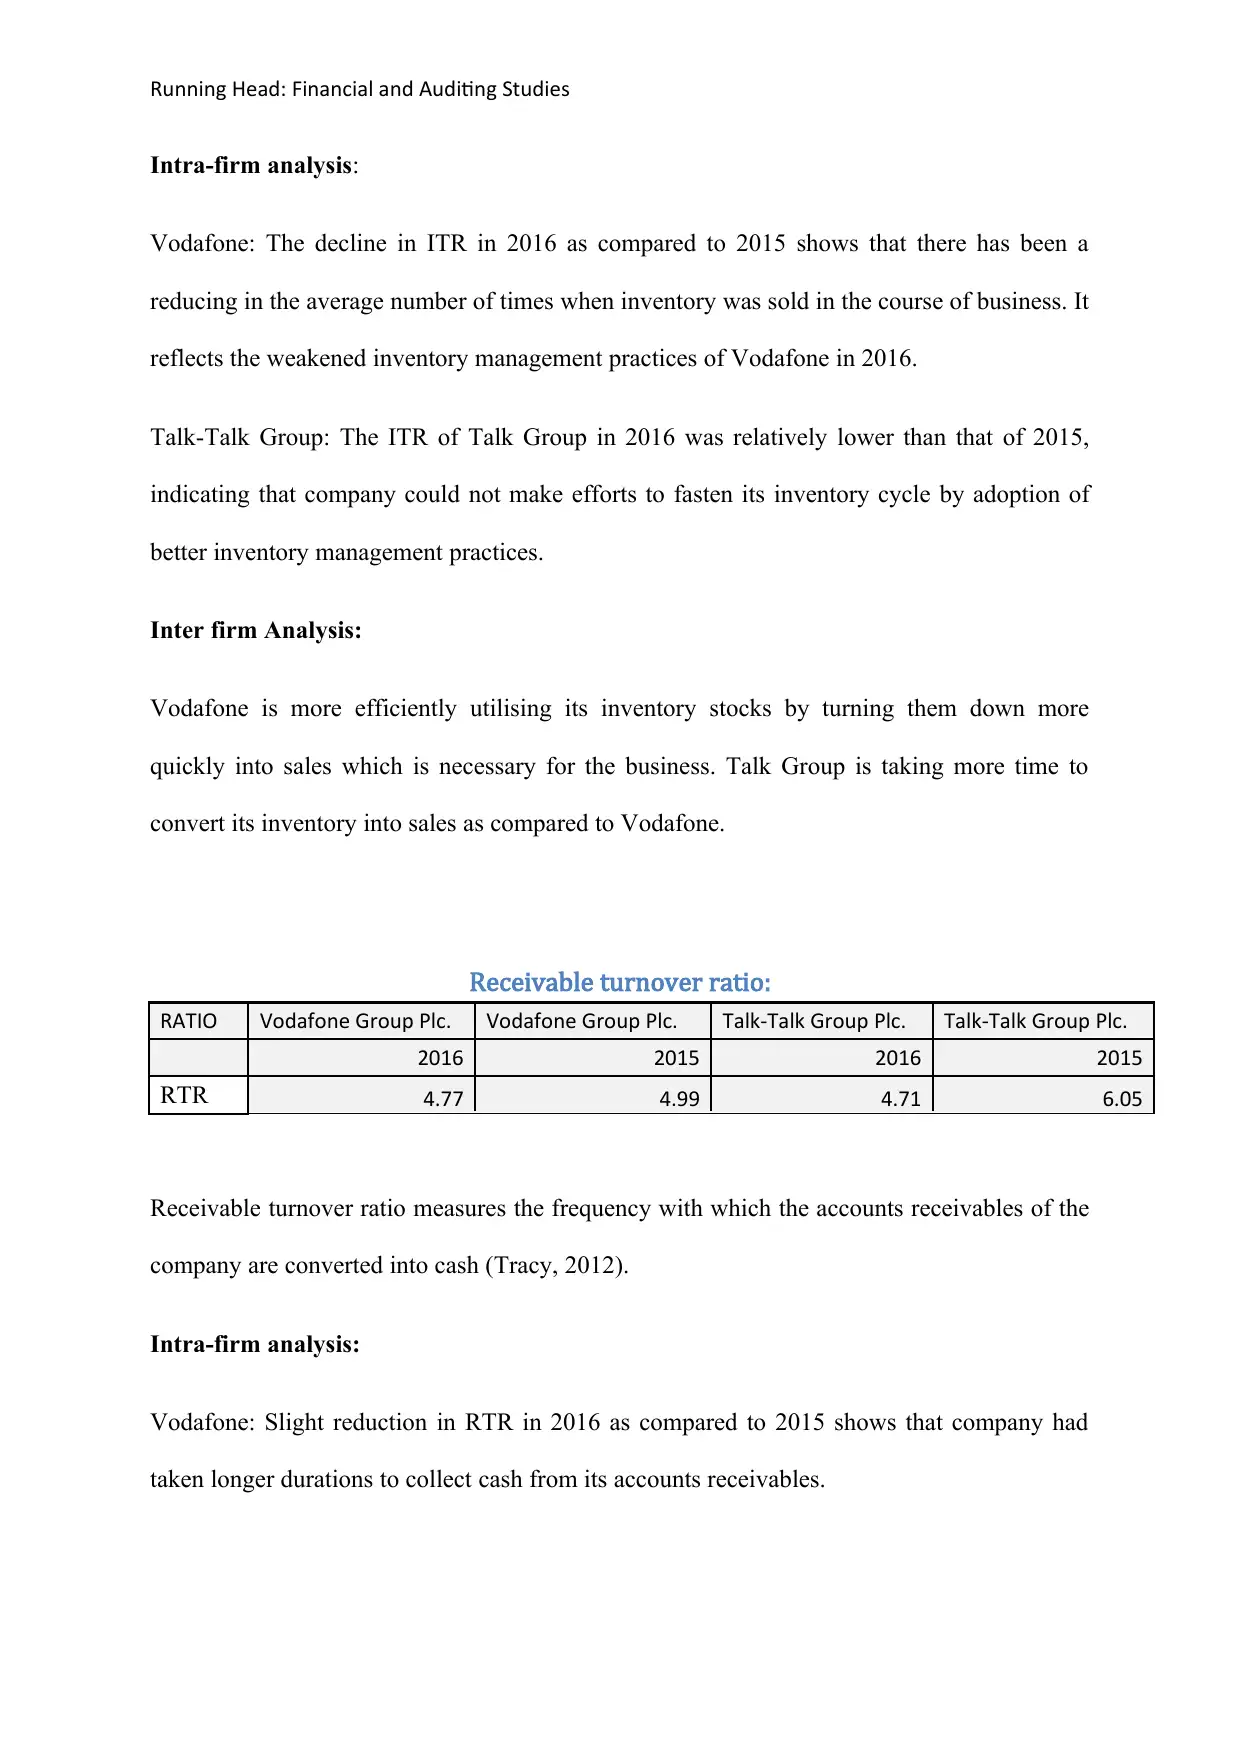
Intra-firm analysis:
Vodafone: The decline in ITR in 2016 as compared to 2015 shows that there has been a
reducing in the average number of times when inventory was sold in the course of business. It
reflects the weakened inventory management practices of Vodafone in 2016.
Talk-Talk Group: The ITR of Talk Group in 2016 was relatively lower than that of 2015,
indicating that company could not make efforts to fasten its inventory cycle by adoption of
better inventory management practices.
Inter firm Analysis:
Vodafone is more efficiently utilising its inventory stocks by turning them down more
quickly into sales which is necessary for the business. Talk Group is taking more time to
convert its inventory into sales as compared to Vodafone.
Receivable turnover ratio:
RATIO Vodafone Group Plc. Vodafone Group Plc. Talk-Talk Group Plc. Talk-Talk Group Plc.
2016 2015 2016 2015
RTR 4.77 4.99 4.71 6.05
Receivable turnover ratio measures the frequency with which the accounts receivables of the
company are converted into cash (Tracy, 2012).
Intra-firm analysis:
Vodafone: Slight reduction in RTR in 2016 as compared to 2015 shows that company had
taken longer durations to collect cash from its accounts receivables.
Intra-firm analysis:
Vodafone: The decline in ITR in 2016 as compared to 2015 shows that there has been a
reducing in the average number of times when inventory was sold in the course of business. It
reflects the weakened inventory management practices of Vodafone in 2016.
Talk-Talk Group: The ITR of Talk Group in 2016 was relatively lower than that of 2015,
indicating that company could not make efforts to fasten its inventory cycle by adoption of
better inventory management practices.
Inter firm Analysis:
Vodafone is more efficiently utilising its inventory stocks by turning them down more
quickly into sales which is necessary for the business. Talk Group is taking more time to
convert its inventory into sales as compared to Vodafone.
Receivable turnover ratio:
RATIO Vodafone Group Plc. Vodafone Group Plc. Talk-Talk Group Plc. Talk-Talk Group Plc.
2016 2015 2016 2015
RTR 4.77 4.99 4.71 6.05
Receivable turnover ratio measures the frequency with which the accounts receivables of the
company are converted into cash (Tracy, 2012).
Intra-firm analysis:
Vodafone: Slight reduction in RTR in 2016 as compared to 2015 shows that company had
taken longer durations to collect cash from its accounts receivables.
⊘ This is a preview!⊘
Do you want full access?
Subscribe today to unlock all pages.
Trusted by 1+ million students worldwide
1 out of 18
Related Documents


Your All-in-One AI-Powered Toolkit for Academic Success.
+13062052269
info@desklib.com
Available 24*7 on WhatsApp / Email
![[object Object]](/_next/static/media/star-bottom.7253800d.svg)
Unlock your academic potential
Copyright © 2020–2026 A2Z Services. All Rights Reserved. Developed and managed by ZUCOL.