Airline Revenue Management Report: Volaris Case Study and Analysis
VerifiedAdded on 2022/08/20
|11
|1858
|18
Report
AI Summary
This report delves into the revenue management strategies of Volaris, an ultra-low-cost carrier. It begins with an introduction to the airline industry and the significance of revenue management. The report then provides a detailed background of Volaris, including its founding, evolution, and current market position, along with its business model and a PESTLE analysis. The analysis covers the airline's cost and revenue performance, highlighting factors such as fleet efficiency, passenger fares, and ancillary revenues. Furthermore, the report examines Volaris's financial performance, including profitability, liquidity, and solvency ratios. The conclusion summarizes the key findings, emphasizing the challenges and opportunities facing Volaris in the competitive airline market, including fluctuating fuel prices and evolving market dynamics.
Running Head: AIRLINE REVENUE MANAGEMENT
AIRLINE REVENUE MANAGEMENT
Name of the Student
Name of the University
Author Note
AIRLINE REVENUE MANAGEMENT
Name of the Student
Name of the University
Author Note
Paraphrase This Document
Need a fresh take? Get an instant paraphrase of this document with our AI Paraphraser
1AIRLINE REVENUE MANAGEMENT
Table of Contents
Introduction................................................................................................................................2
Discussion..................................................................................................................................2
Background of Company and its Current Situation...............................................................2
Cost and Revenue Performance of Airline.............................................................................4
Financial Performance of Airline...........................................................................................6
Conclusion..................................................................................................................................7
Reference....................................................................................................................................9

2AIRLINE REVENUE MANAGEMENT
Introduction
In airline industry, the revenue management is significant tool for validating overall
strategy of airline. This concept is extremely important within airline industry because it
allows the airline for anticipating the demand and optimizing pricing and availability for
achieving best possible financial results (Grauberger and Kimms 2016). Hence, this report
aims to discuss background of Volaris airline, its current and past situations, its business
model and Pestel analysis. Further, cost and revenue of airline will be analyzed followed by
financial performance of the airline. Lastly, conclusion will be given based on critical points.
Discussion
Background of Company and its Current Situation
Volaris was founded in Mexico in year 2005. Televisa and TACA airlines were
among the initial shareholders. After its agreement with Southwest Airlines in 2009, Volaris
started flying from the Mexico to the airports in USA. In 2010, when Mexicana de Aviacion
has stopped flying, Volaris took over its slot. In 2013, agreement between Volaris and
Southwest stopped and later in 2016, Volaris became second largest airline in the Mexico
after Aeromexico. After more than twelve years, this airline is having 187 routes to the 69
different destinations in addition to 50 frontier codeshare destinations (Lin et al. 2018).
Currently, Volaris is largest ultra-lower cost airline in the Latin America and largest domestic
passenger operator in Mexican market. This airline is having family fleet of Airbus A320 of
77 aircraft with the average of around 185 seats that is youngest fleet in the Mexico and most
likely the youngest in continent that is 4.6 years old (S21.q4cdn.com. 2020).
Business Model
The business model of Volaris includes being lower cost airline and offering the
convenient time of the travel to the families, friends and the leisure travelers to the key
⊘ This is a preview!⊘
Do you want full access?
Subscribe today to unlock all pages.
Trusted by 1+ million students worldwide
3AIRLINE REVENUE MANAGEMENT
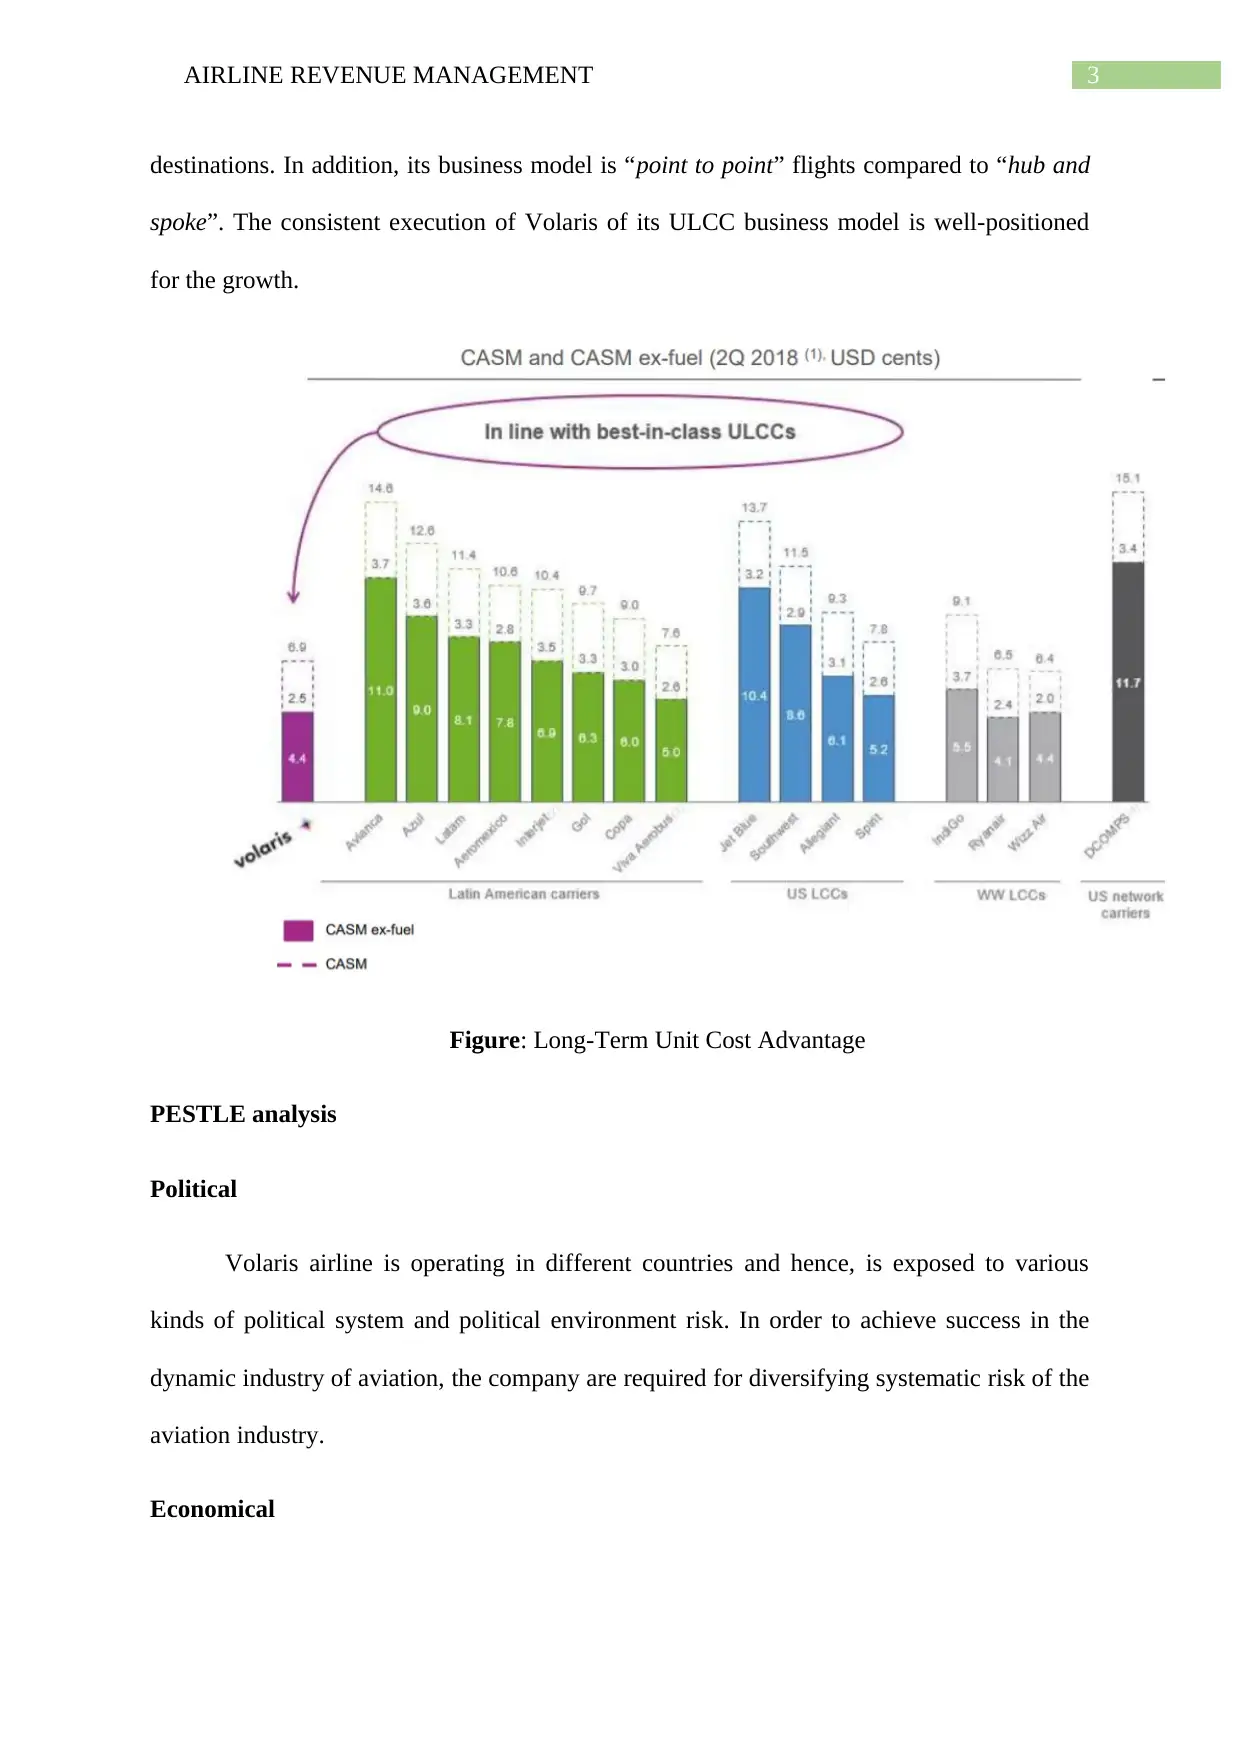
destinations. In addition, its business model is “point to point” flights compared to “hub and
spoke”. The consistent execution of Volaris of its ULCC business model is well-positioned
for the growth.
Figure: Long-Term Unit Cost Advantage
PESTLE analysis
Political
Volaris airline is operating in different countries and hence, is exposed to various
kinds of political system and political environment risk. In order to achieve success in the
dynamic industry of aviation, the company are required for diversifying systematic risk of the
aviation industry.
Economical
Paraphrase This Document
Need a fresh take? Get an instant paraphrase of this document with our AI Paraphraser
4AIRLINE REVENUE MANAGEMENT
The macro environment factors determine aggregate demand as well as aggregate
investment in economy. Volaris airline can use economic factors, for instance growth rate
and economic indicators of industry for forecasting growth trajectory. However, company’s
operations may be affected by changes in fuel prices and adverse movements of currency
(Rastogi and Trivedi 2016).
Social
Shared attitudes and beliefs of population plays significant role in operations of the
company. Volaris airline enjoys wide support and trust of its local and international base of
customer. However, any shift of the consumer preference that is marked by the increase in
the disposable income will affect the airline.
Technology
Volaris may be affected by modern and young aircraft fleet and advanced system of
entertainment in flight.
Legal
Any changes in the global and regional regulatory framework and lawsuits relating to
pricing and deficiencies will affect the operations of Volaris airline.
Environment
Volaris airline are expected to have strong system of environmental management and
green practices as well as optimum resources usage, otherwise, it will have great impact on
its business operations (Ho 2014).
Cost and Revenue Performance of Airline
Volaris airline focuses on the efficiency of fleet that drives lower cost and higher
revenue. Almost 68 percent of the total operating revenues of airline were derived from the
5AIRLINE REVENUE MANAGEMENT
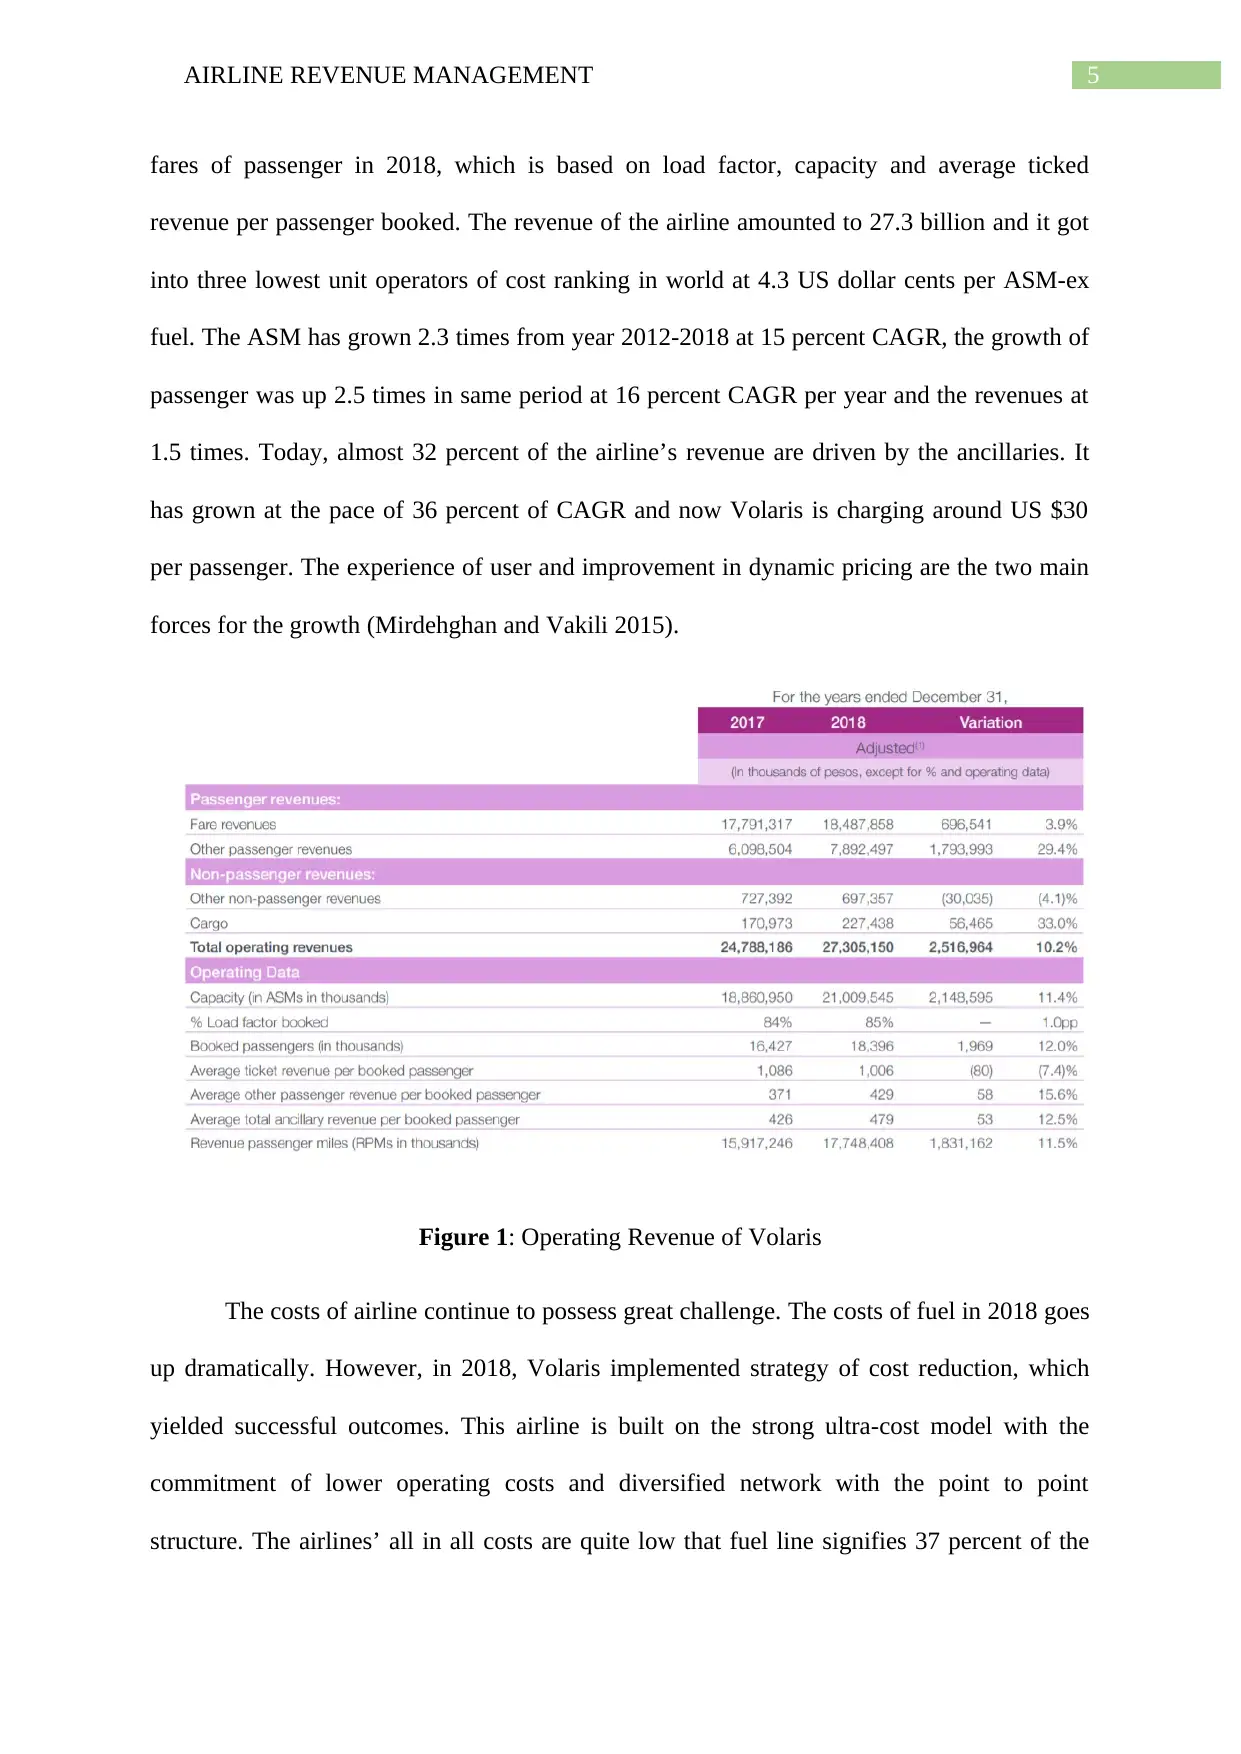
fares of passenger in 2018, which is based on load factor, capacity and average ticked
revenue per passenger booked. The revenue of the airline amounted to 27.3 billion and it got
into three lowest unit operators of cost ranking in world at 4.3 US dollar cents per ASM-ex
fuel. The ASM has grown 2.3 times from year 2012-2018 at 15 percent CAGR, the growth of
passenger was up 2.5 times in same period at 16 percent CAGR per year and the revenues at
1.5 times. Today, almost 32 percent of the airline’s revenue are driven by the ancillaries. It
has grown at the pace of 36 percent of CAGR and now Volaris is charging around US $30
per passenger. The experience of user and improvement in dynamic pricing are the two main
forces for the growth (Mirdehghan and Vakili 2015).
Figure 1: Operating Revenue of Volaris
The costs of airline continue to possess great challenge. The costs of fuel in 2018 goes
up dramatically. However, in 2018, Volaris implemented strategy of cost reduction, which
yielded successful outcomes. This airline is built on the strong ultra-cost model with the
commitment of lower operating costs and diversified network with the point to point
structure. The airlines’ all in all costs are quite low that fuel line signifies 37 percent of the
⊘ This is a preview!⊘
Do you want full access?
Subscribe today to unlock all pages.
Trusted by 1+ million students worldwide
6AIRLINE REVENUE MANAGEMENT
revenues. The key for managing fuel costs include engine technology and new aircraft. The
airline strategies that by 2020, almost 56 percent of fleet will get substituted with the engines,
which burns less fuel and having sharklets for further reducing fuel as well as emission of
CO2. Overall, 18 percent of lower fuel burn is in the favor of airline’s strategy of low cost
(Jayawardhana, Welton and Lindrooth 2014).
Financial Performance of Airline
The financial performance of Volaris airline is explained by calculating three ratios,
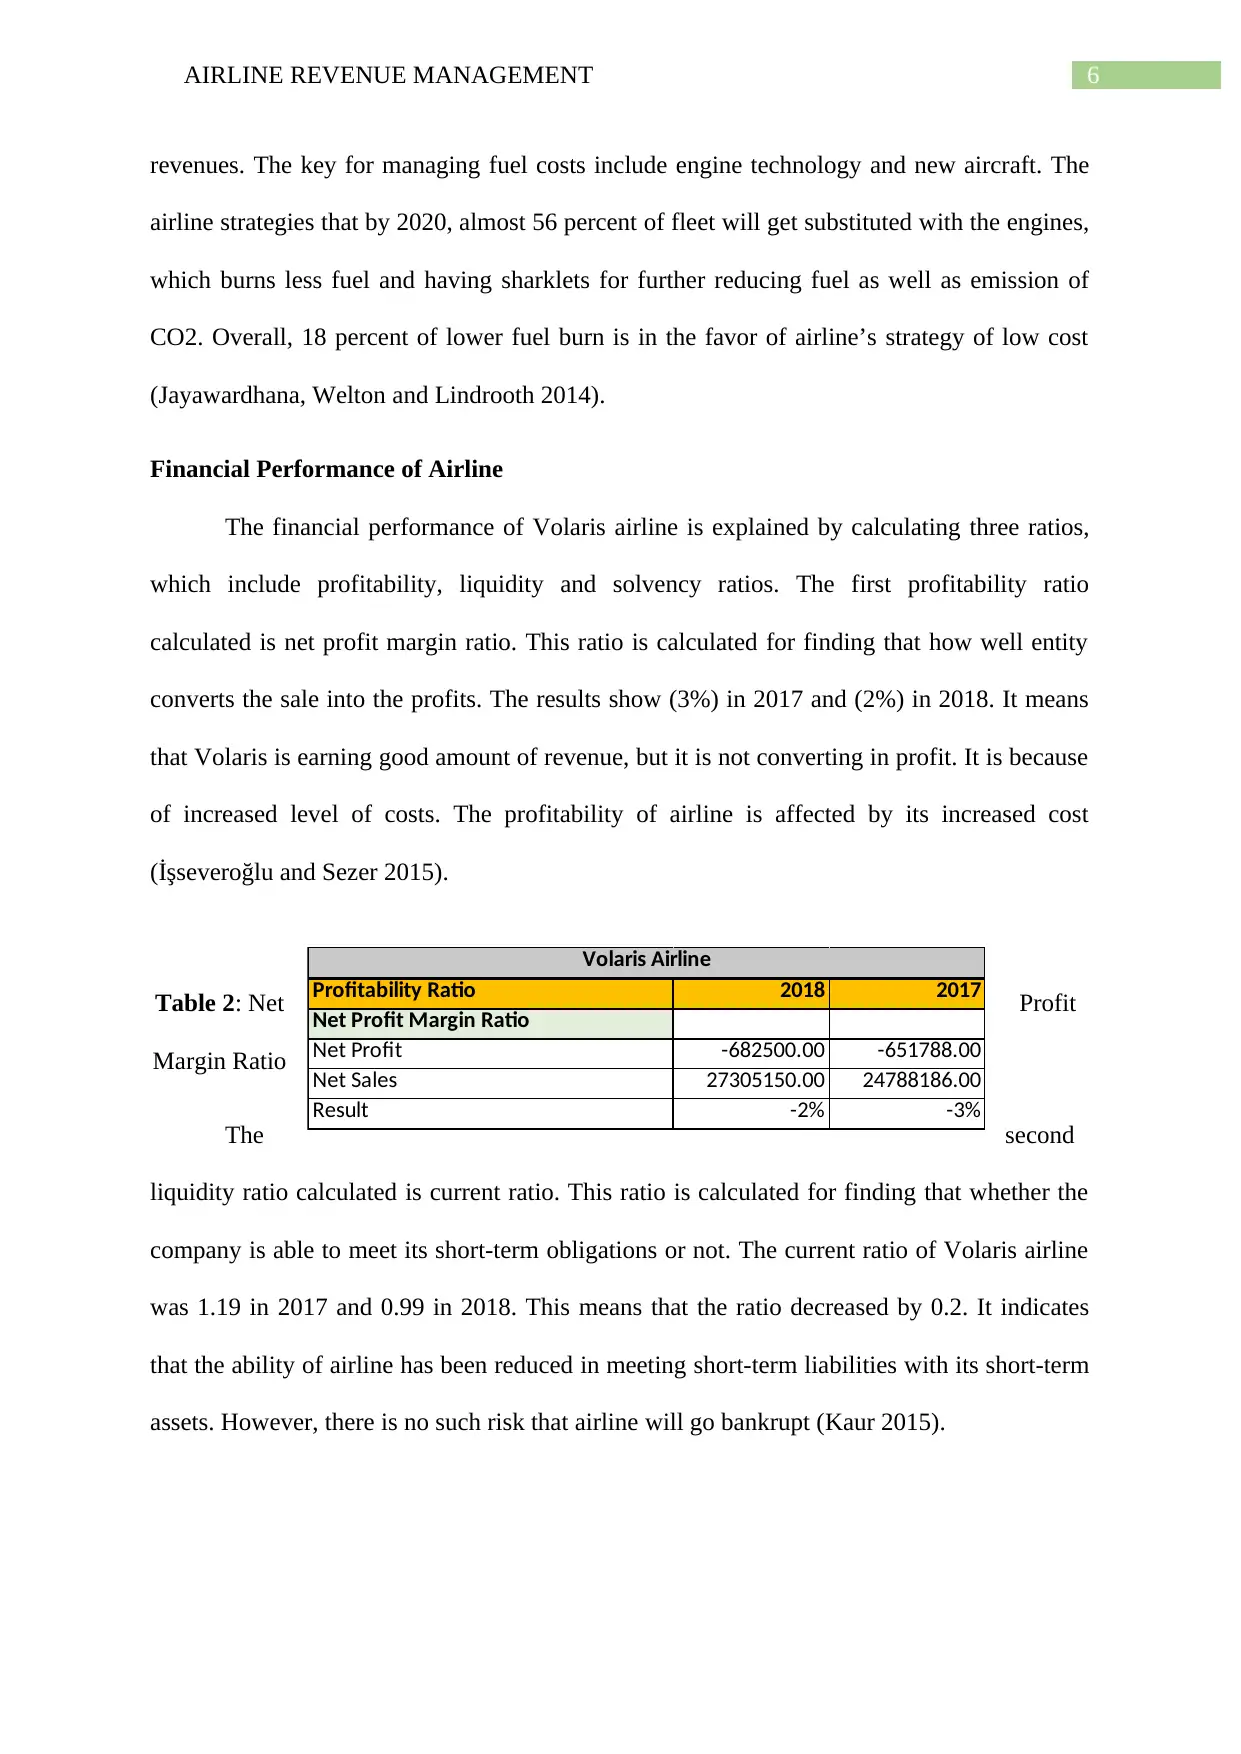
which include profitability, liquidity and solvency ratios. The first profitability ratio
calculated is net profit margin ratio. This ratio is calculated for finding that how well entity
converts the sale into the profits. The results show (3%) in 2017 and (2%) in 2018. It means
that Volaris is earning good amount of revenue, but it is not converting in profit. It is because
of increased level of costs. The profitability of airline is affected by its increased cost
(İşseveroğlu and Sezer 2015).
Table 2: Net Profit
Margin Ratio
The second
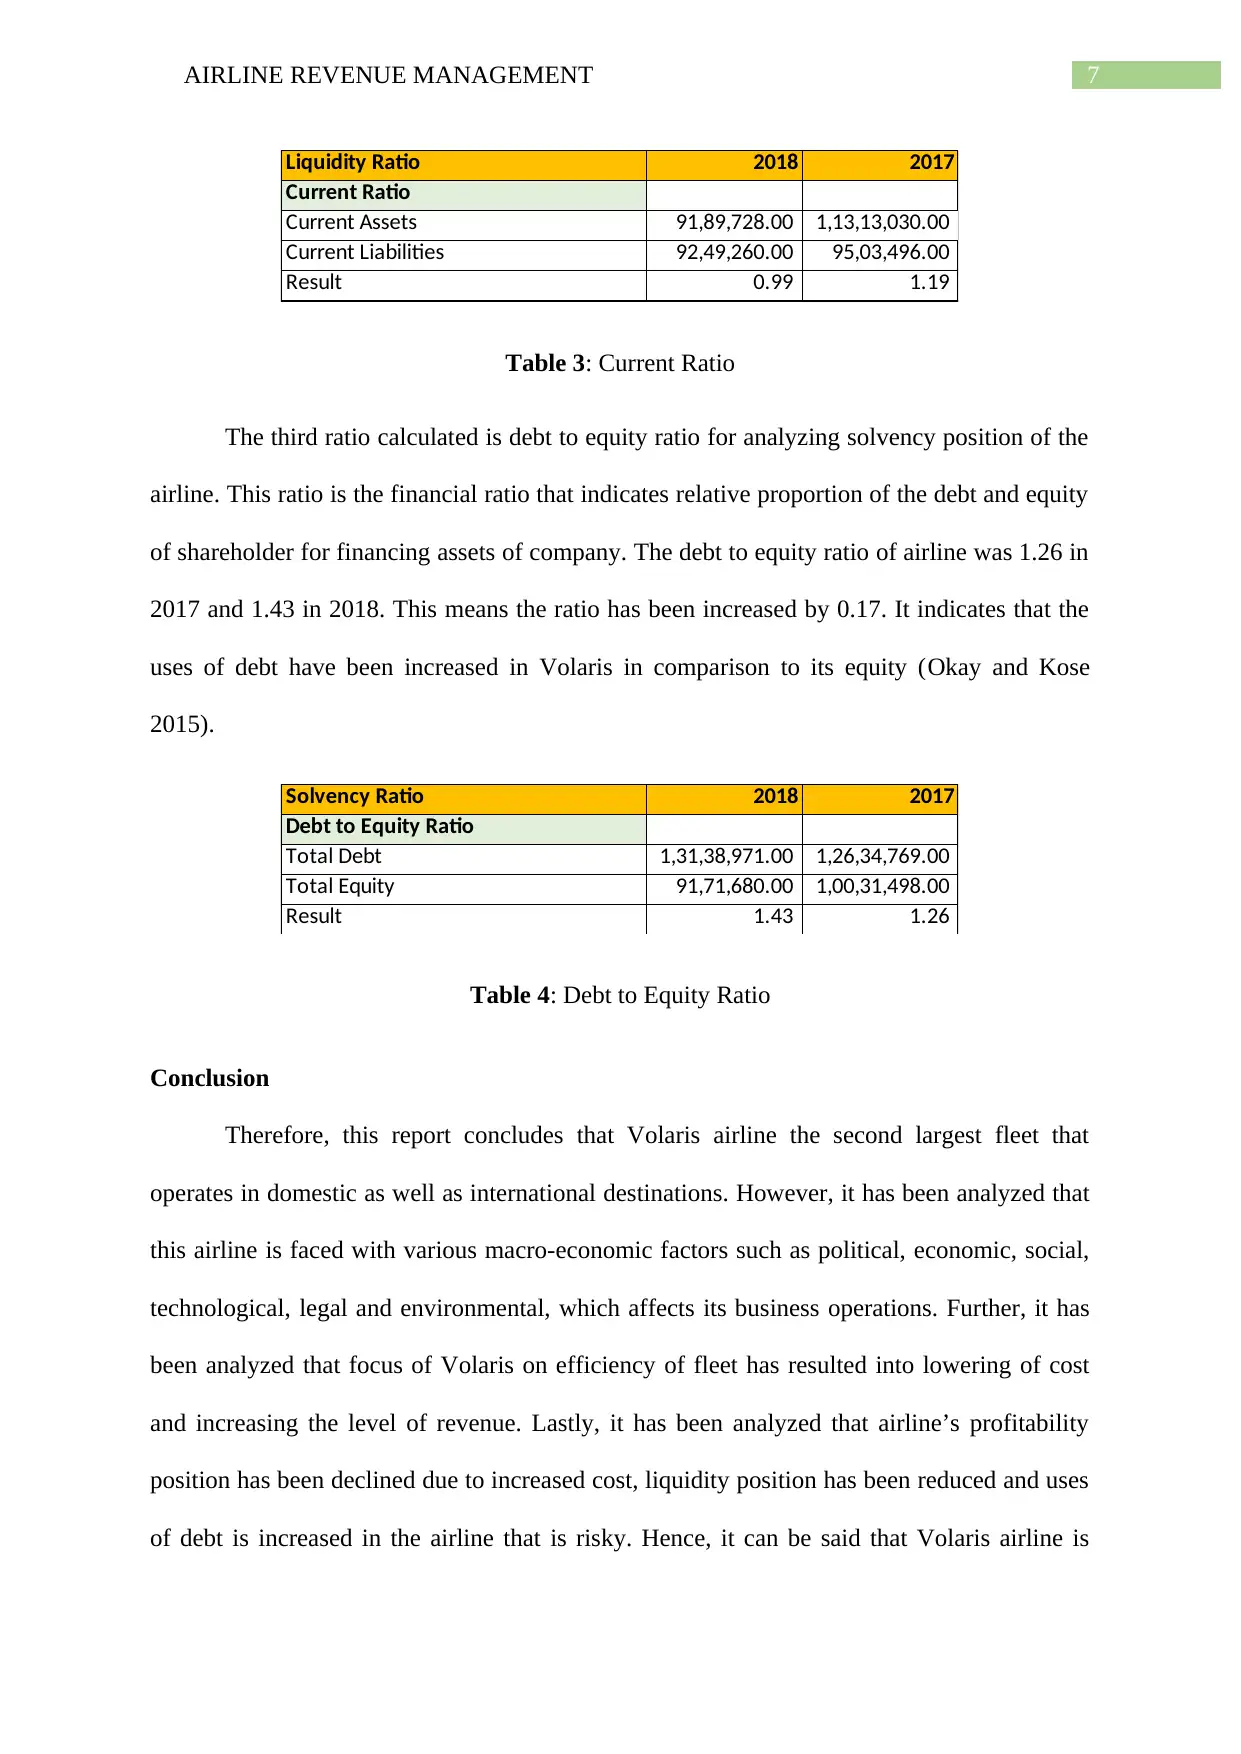
liquidity ratio calculated is current ratio. This ratio is calculated for finding that whether the
company is able to meet its short-term obligations or not. The current ratio of Volaris airline
was 1.19 in 2017 and 0.99 in 2018. This means that the ratio decreased by 0.2. It indicates
that the ability of airline has been reduced in meeting short-term liabilities with its short-term
assets. However, there is no such risk that airline will go bankrupt (Kaur 2015).
Profitability Ratio 2018 2017
Net Profit Margin Ratio
Net Profit -682500.00 -651788.00
Net Sales 27305150.00 24788186.00
Result -2% -3%
Volaris Airline
revenues. The key for managing fuel costs include engine technology and new aircraft. The
airline strategies that by 2020, almost 56 percent of fleet will get substituted with the engines,
which burns less fuel and having sharklets for further reducing fuel as well as emission of
CO2. Overall, 18 percent of lower fuel burn is in the favor of airline’s strategy of low cost
(Jayawardhana, Welton and Lindrooth 2014).
Financial Performance of Airline
The financial performance of Volaris airline is explained by calculating three ratios,
which include profitability, liquidity and solvency ratios. The first profitability ratio
calculated is net profit margin ratio. This ratio is calculated for finding that how well entity
converts the sale into the profits. The results show (3%) in 2017 and (2%) in 2018. It means
that Volaris is earning good amount of revenue, but it is not converting in profit. It is because
of increased level of costs. The profitability of airline is affected by its increased cost
(İşseveroğlu and Sezer 2015).
Table 2: Net Profit
Margin Ratio
The second
liquidity ratio calculated is current ratio. This ratio is calculated for finding that whether the
company is able to meet its short-term obligations or not. The current ratio of Volaris airline
was 1.19 in 2017 and 0.99 in 2018. This means that the ratio decreased by 0.2. It indicates
that the ability of airline has been reduced in meeting short-term liabilities with its short-term
assets. However, there is no such risk that airline will go bankrupt (Kaur 2015).
Profitability Ratio 2018 2017
Net Profit Margin Ratio
Net Profit -682500.00 -651788.00
Net Sales 27305150.00 24788186.00
Result -2% -3%
Volaris Airline
Paraphrase This Document
Need a fresh take? Get an instant paraphrase of this document with our AI Paraphraser
7AIRLINE REVENUE MANAGEMENT
Liquidity Ratio 2018 2017
Current Ratio
Current Assets 91,89,728.00 1,13,13,030.00
Current Liabilities 92,49,260.00 95,03,496.00
Result 0.99 1.19
Table 3: Current Ratio
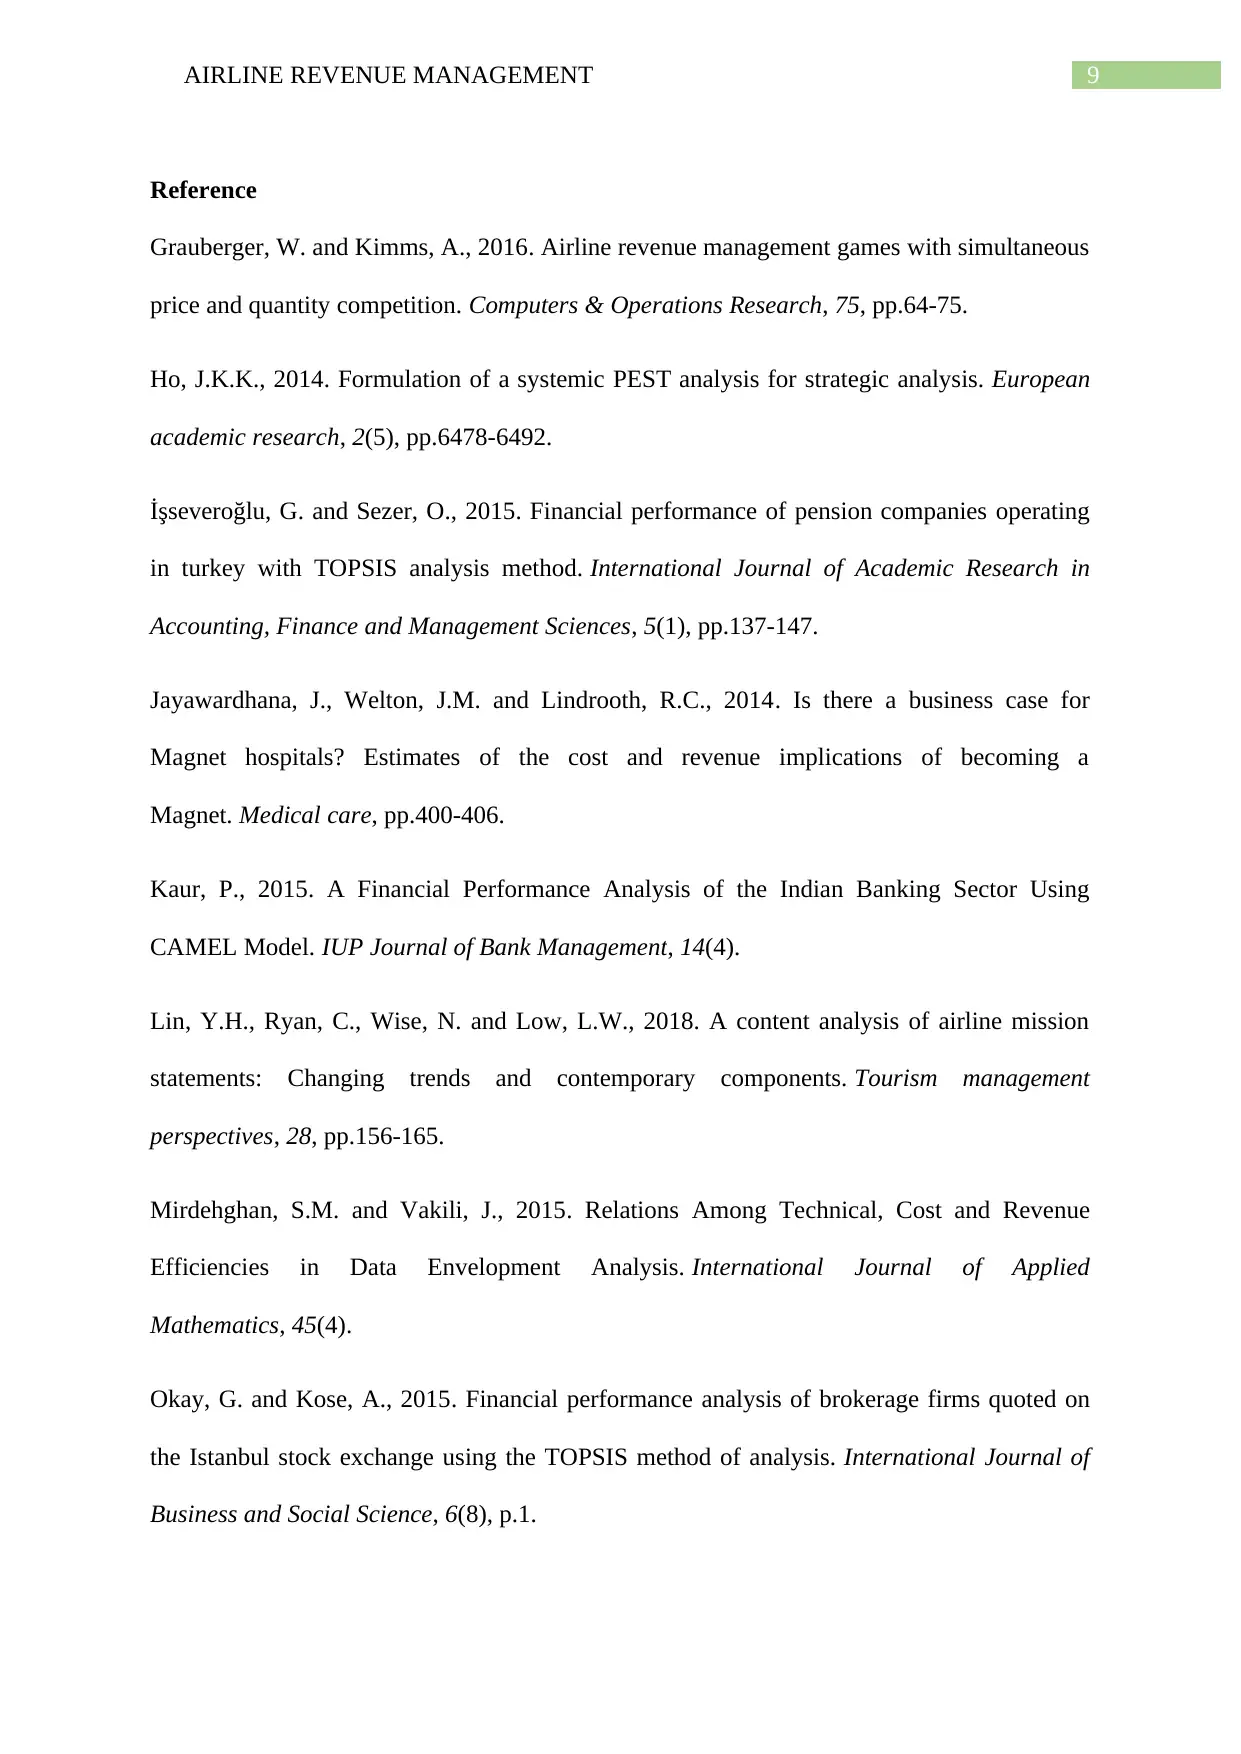
The third ratio calculated is debt to equity ratio for analyzing solvency position of the
airline. This ratio is the financial ratio that indicates relative proportion of the debt and equity
of shareholder for financing assets of company. The debt to equity ratio of airline was 1.26 in
2017 and 1.43 in 2018. This means the ratio has been increased by 0.17. It indicates that the
uses of debt have been increased in Volaris in comparison to its equity (Okay and Kose
2015).
Solvency Ratio 2018 2017
Debt to Equity Ratio
Total Debt 1,31,38,971.00 1,26,34,769.00
Total Equity 91,71,680.00 1,00,31,498.00
Result 1.43 1.26
Table 4: Debt to Equity Ratio
Conclusion
Therefore, this report concludes that Volaris airline the second largest fleet that
operates in domestic as well as international destinations. However, it has been analyzed that
this airline is faced with various macro-economic factors such as political, economic, social,
technological, legal and environmental, which affects its business operations. Further, it has
been analyzed that focus of Volaris on efficiency of fleet has resulted into lowering of cost
and increasing the level of revenue. Lastly, it has been analyzed that airline’s profitability
position has been declined due to increased cost, liquidity position has been reduced and uses
of debt is increased in the airline that is risky. Hence, it can be said that Volaris airline is
Liquidity Ratio 2018 2017
Current Ratio
Current Assets 91,89,728.00 1,13,13,030.00
Current Liabilities 92,49,260.00 95,03,496.00
Result 0.99 1.19
Table 3: Current Ratio
The third ratio calculated is debt to equity ratio for analyzing solvency position of the
airline. This ratio is the financial ratio that indicates relative proportion of the debt and equity
of shareholder for financing assets of company. The debt to equity ratio of airline was 1.26 in
2017 and 1.43 in 2018. This means the ratio has been increased by 0.17. It indicates that the
uses of debt have been increased in Volaris in comparison to its equity (Okay and Kose
2015).
Solvency Ratio 2018 2017
Debt to Equity Ratio
Total Debt 1,31,38,971.00 1,26,34,769.00
Total Equity 91,71,680.00 1,00,31,498.00
Result 1.43 1.26
Table 4: Debt to Equity Ratio
Conclusion
Therefore, this report concludes that Volaris airline the second largest fleet that
operates in domestic as well as international destinations. However, it has been analyzed that
this airline is faced with various macro-economic factors such as political, economic, social,
technological, legal and environmental, which affects its business operations. Further, it has
been analyzed that focus of Volaris on efficiency of fleet has resulted into lowering of cost
and increasing the level of revenue. Lastly, it has been analyzed that airline’s profitability
position has been declined due to increased cost, liquidity position has been reduced and uses
of debt is increased in the airline that is risky. Hence, it can be said that Volaris airline is

8AIRLINE REVENUE MANAGEMENT
having promising opportunities for growth, however, fluctuations in fuel price and strong
competition in airline industry possess great threat.
having promising opportunities for growth, however, fluctuations in fuel price and strong
competition in airline industry possess great threat.
⊘ This is a preview!⊘
Do you want full access?
Subscribe today to unlock all pages.
Trusted by 1+ million students worldwide
9AIRLINE REVENUE MANAGEMENT
Reference
Grauberger, W. and Kimms, A., 2016. Airline revenue management games with simultaneous
price and quantity competition. Computers & Operations Research, 75, pp.64-75.
Ho, J.K.K., 2014. Formulation of a systemic PEST analysis for strategic analysis. European
academic research, 2(5), pp.6478-6492.
İşseveroğlu, G. and Sezer, O., 2015. Financial performance of pension companies operating
in turkey with TOPSIS analysis method. International Journal of Academic Research in
Accounting, Finance and Management Sciences, 5(1), pp.137-147.
Jayawardhana, J., Welton, J.M. and Lindrooth, R.C., 2014. Is there a business case for
Magnet hospitals? Estimates of the cost and revenue implications of becoming a
Magnet. Medical care, pp.400-406.
Kaur, P., 2015. A Financial Performance Analysis of the Indian Banking Sector Using
CAMEL Model. IUP Journal of Bank Management, 14(4).
Lin, Y.H., Ryan, C., Wise, N. and Low, L.W., 2018. A content analysis of airline mission
statements: Changing trends and contemporary components. Tourism management
perspectives, 28, pp.156-165.
Mirdehghan, S.M. and Vakili, J., 2015. Relations Among Technical, Cost and Revenue
Efficiencies in Data Envelopment Analysis. International Journal of Applied
Mathematics, 45(4).
Okay, G. and Kose, A., 2015. Financial performance analysis of brokerage firms quoted on
the Istanbul stock exchange using the TOPSIS method of analysis. International Journal of
Business and Social Science, 6(8), p.1.
Paraphrase This Document
Need a fresh take? Get an instant paraphrase of this document with our AI Paraphraser
10AIRLINE REVENUE MANAGEMENT
Rastogi, N.I.T.A.N.K. and Trivedi, M.K., 2016. PESTLE technique–a tool to identify
external risks in construction projects. International Research Journal of Engineering and
Technology (IRJET), 3(1), pp.384-388.
S21.q4cdn.com. 2020. [online] Available at:
<http://s21.q4cdn.com/752131891/files/doc_financials/2018/annual/AR18-VolarisFin-
050619.pdf> [Accessed 28 March 2020].
1 out of 11
Related Documents


Your All-in-One AI-Powered Toolkit for Academic Success.
+13062052269
info@desklib.com
Available 24*7 on WhatsApp / Email
![[object Object]](/_next/static/media/star-bottom.7253800d.svg)
Unlock your academic potential
Copyright © 2020–2026 A2Z Services. All Rights Reserved. Developed and managed by ZUCOL.