Financial Statement Analysis of Volkswagen Group: A Detailed Report
VerifiedAdded on 2019/12/03
|19
|4451
|375
Report
AI Summary
This report provides a comprehensive financial statement analysis of the Volkswagen Group, a leading German automobile manufacturer. The analysis employs ratio analysis, including profitability, liquidity, activity, and solvency ratios, to evaluate the company's financial performance from 2012 to 2014. The report examines key financial indicators such as gross profit ratio, net profit ratio, current ratio, debt-equity ratio, and asset turnover ratio. Furthermore, the study investigates the impact of internal and external factors on the business and includes a comparative analysis with Daimler Co. Ltd, a major competitor. The report concludes with recommendations for the company's shareholders based on the findings of the financial analysis, highlighting areas of concern and opportunities for improvement. The report aims to provide a detailed understanding of Volkswagen's financial health and strategic position within the automotive industry.

Financial statement analysis
Paraphrase This Document
Need a fresh take? Get an instant paraphrase of this document with our AI Paraphraser
Table of Contents
INTRODUCTION......................................................................................................................1
Approaches to analyze the financial statement of the company............................................1
Ratio Analysis for Volkswagen group...................................................................................3
Impact of internal and external factors on the business.........................................................7
Comparative study of Financial statement analysis of Volkswagen with Daimler Co. Ltd.. 8
Recommendation to the shareholders of the company........................................................11
REFERENCES.........................................................................................................................13
List of tables
Table 1: Ratio analysis – Volkswagen group.............................................................................3
Table 2: Ratio analysis - Daimler...............................................................................................9
List of figures
Figure 1: Profitability ratios – Volkswagen...............................................................................4
Figure 2: Debt- equity ratio – Volkswagen................................................................................5
Figure 3: Liquidity position – Volkswagen...............................................................................5
Figure 4: Comparison of net profit ratio for Volkswagen and Daimler...................................10
1 | P a g e
⊘ This is a preview!⊘
Do you want full access?
Subscribe today to unlock all pages.
Trusted by 1+ million students worldwide
INTRODUCTION
Volkswagen is a German automobile manufacturing company which was established in
the year 1937 and it is headquartered in Wolfsburg, Lower Saxony. Volkswagen AG is the
parent company of Volkswagen group whereas Audi, Skoda, Seat and Lamborghini are its
subsidiary companies. The activities of Volkswagen group falls in an automotive industry
and it was the second largest auto maker in the world in the year 2012. Presently, the
company aims at becoming the world's largest car maker by the year 2018 (Robinson and et.
al., 2015). Volkswagen group consists of two divisions; automotive division and financial
services division. The automotive division deals with production of passenger cars, light
commercial vehicles, trucks and buses and sale of genuine parts. On the other hand, the
financial services division emphasizes on dealer and customer financing, leasing, banking
and insurance activities, fleet division and mobility offerings. It is a large international
corporation in charge of multiple car and truck brands. The company conducts its
manufacturing and assembling activities in different part of the world. In the presented report,
we analyse the financial statements of Volkswagen group by adopting ratio analysis method.
On contrary, it's financial statements will also analyse with the competitor Daimler Co. Ltd.
Approaches to analyse the financial statement of the company
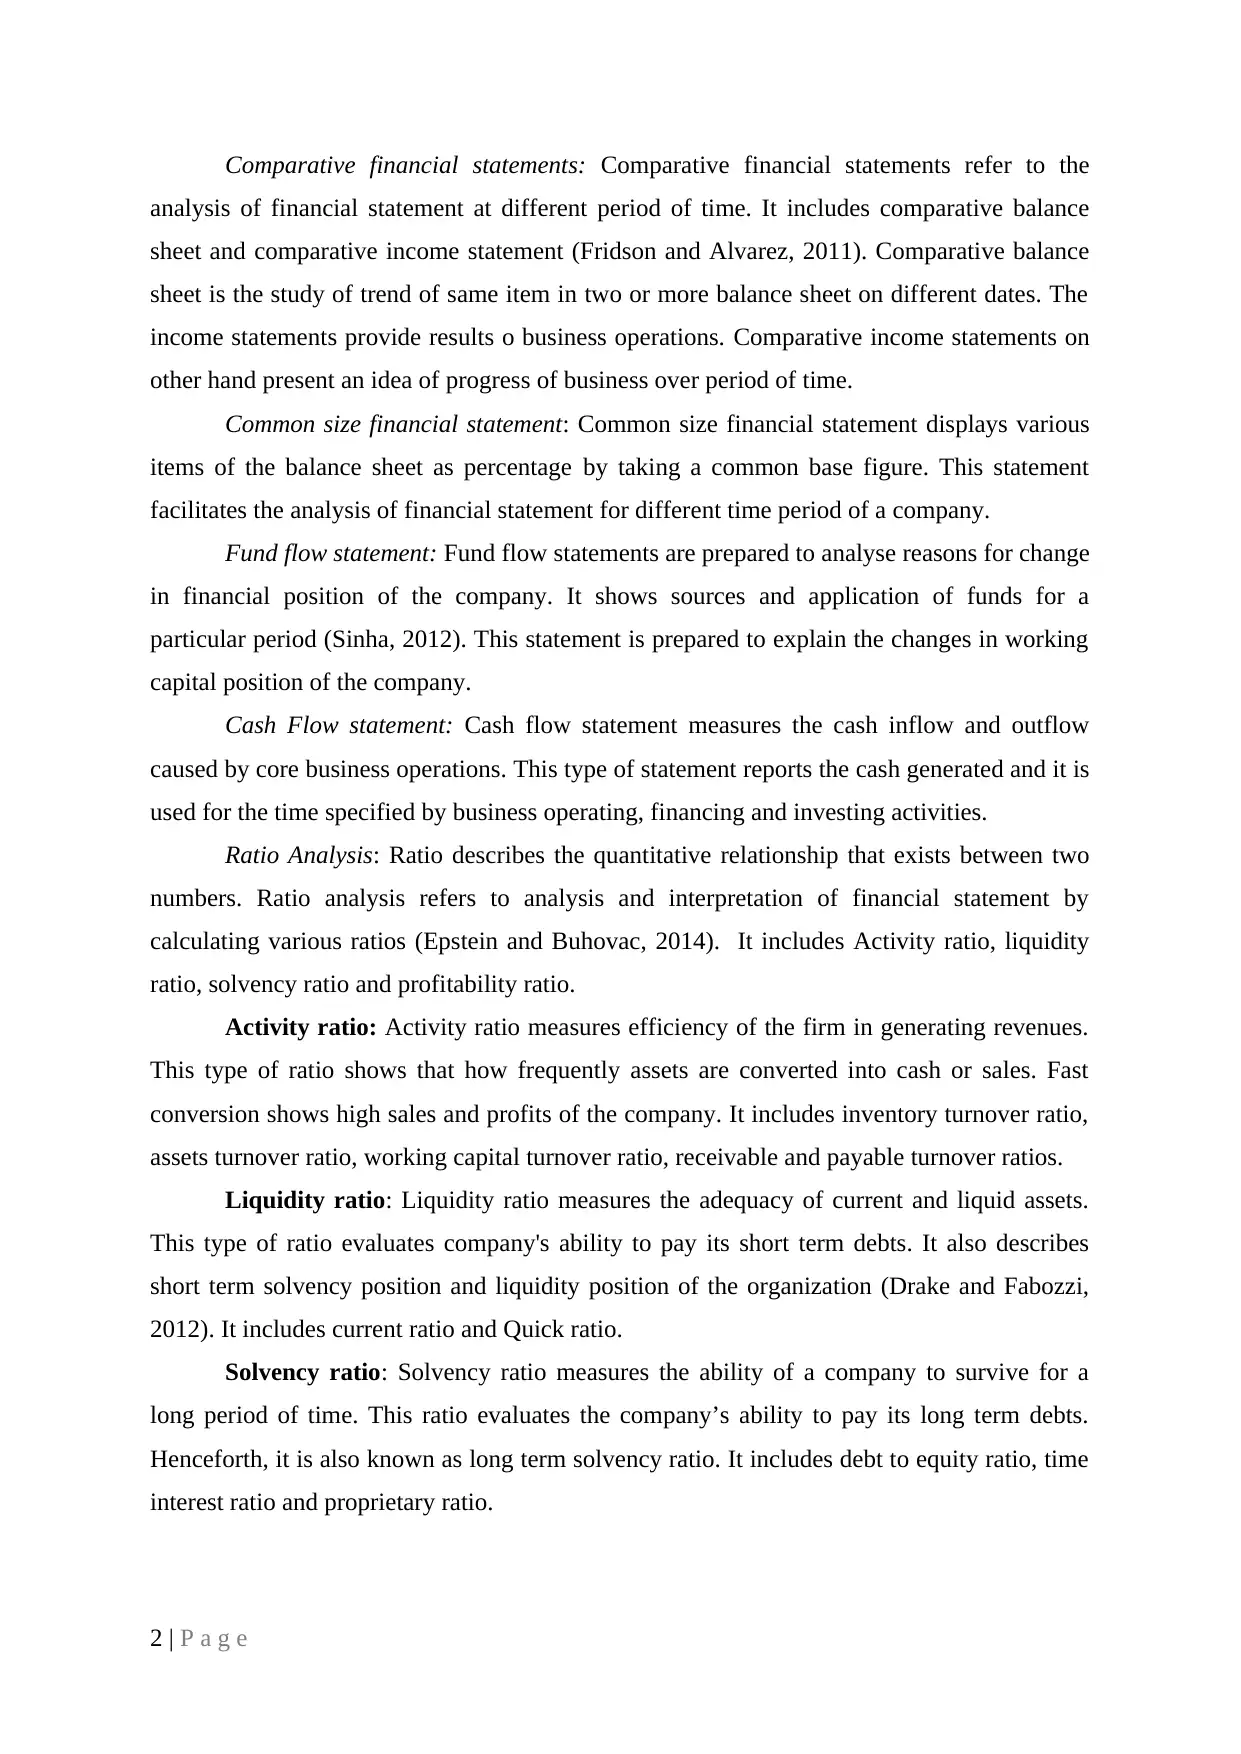
Financial statements are basically summary of operating, financing and investing
activities of the company. Financial statements analysis is the process of reviewing and
evaluating company's financial statement to make better economic decisions. Financial
statement analysis is an effectual device to review prosperity and reliability of financial
statement. The main aim of this analysis is to provide useful information to different users of
financial statement. It facilitates the investors and creditors to evaluate past performance and
financial status. Moreover, it helps in predicting future performance of the company (Wahlen,
Baginski and Bradshaw, 2014). There are two approaches to analyse financial statements:
traditional and modern approach. Traditional approach emphasizes on evaluating financial
data in financial statements and considers income statement as well as balance sheet. Under
this approach, ratio analysis, common size statement and comparative financial statement
analysis can be used. However, Modern approach is not only based on historical data
contained in income and balance sheet but also uses other financial statements such as cash
flow and fund flow. Under this approach, Modern statistical and mathematical tools are used
to analyse financial statements.
1 | P a g e
Volkswagen is a German automobile manufacturing company which was established in
the year 1937 and it is headquartered in Wolfsburg, Lower Saxony. Volkswagen AG is the
parent company of Volkswagen group whereas Audi, Skoda, Seat and Lamborghini are its
subsidiary companies. The activities of Volkswagen group falls in an automotive industry
and it was the second largest auto maker in the world in the year 2012. Presently, the
company aims at becoming the world's largest car maker by the year 2018 (Robinson and et.
al., 2015). Volkswagen group consists of two divisions; automotive division and financial
services division. The automotive division deals with production of passenger cars, light
commercial vehicles, trucks and buses and sale of genuine parts. On the other hand, the
financial services division emphasizes on dealer and customer financing, leasing, banking
and insurance activities, fleet division and mobility offerings. It is a large international
corporation in charge of multiple car and truck brands. The company conducts its
manufacturing and assembling activities in different part of the world. In the presented report,
we analyse the financial statements of Volkswagen group by adopting ratio analysis method.
On contrary, it's financial statements will also analyse with the competitor Daimler Co. Ltd.
Approaches to analyse the financial statement of the company
Financial statements are basically summary of operating, financing and investing
activities of the company. Financial statements analysis is the process of reviewing and
evaluating company's financial statement to make better economic decisions. Financial
statement analysis is an effectual device to review prosperity and reliability of financial
statement. The main aim of this analysis is to provide useful information to different users of
financial statement. It facilitates the investors and creditors to evaluate past performance and
financial status. Moreover, it helps in predicting future performance of the company (Wahlen,
Baginski and Bradshaw, 2014). There are two approaches to analyse financial statements:
traditional and modern approach. Traditional approach emphasizes on evaluating financial
data in financial statements and considers income statement as well as balance sheet. Under
this approach, ratio analysis, common size statement and comparative financial statement
analysis can be used. However, Modern approach is not only based on historical data
contained in income and balance sheet but also uses other financial statements such as cash
flow and fund flow. Under this approach, Modern statistical and mathematical tools are used
to analyse financial statements.
1 | P a g e
Paraphrase This Document
Need a fresh take? Get an instant paraphrase of this document with our AI Paraphraser
Comparative financial statements: Comparative financial statements refer to the
analysis of financial statement at different period of time. It includes comparative balance
sheet and comparative income statement (Fridson and Alvarez, 2011). Comparative balance
sheet is the study of trend of same item in two or more balance sheet on different dates. The
income statements provide results o business operations. Comparative income statements on
other hand present an idea of progress of business over period of time.
Common size financial statement: Common size financial statement displays various
items of the balance sheet as percentage by taking a common base figure. This statement
facilitates the analysis of financial statement for different time period of a company.
Fund flow statement: Fund flow statements are prepared to analyse reasons for change
in financial position of the company. It shows sources and application of funds for a
particular period (Sinha, 2012). This statement is prepared to explain the changes in working
capital position of the company.
Cash Flow statement: Cash flow statement measures the cash inflow and outflow
caused by core business operations. This type of statement reports the cash generated and it is
used for the time specified by business operating, financing and investing activities.
Ratio Analysis: Ratio describes the quantitative relationship that exists between two
numbers. Ratio analysis refers to analysis and interpretation of financial statement by
calculating various ratios (Epstein and Buhovac, 2014). It includes Activity ratio, liquidity
ratio, solvency ratio and profitability ratio.
Activity ratio: Activity ratio measures efficiency of the firm in generating revenues.
This type of ratio shows that how frequently assets are converted into cash or sales. Fast
conversion shows high sales and profits of the company. It includes inventory turnover ratio,
assets turnover ratio, working capital turnover ratio, receivable and payable turnover ratios.
Liquidity ratio: Liquidity ratio measures the adequacy of current and liquid assets.
This type of ratio evaluates company's ability to pay its short term debts. It also describes
short term solvency position and liquidity position of the organization (Drake and Fabozzi,
2012). It includes current ratio and Quick ratio.
Solvency ratio: Solvency ratio measures the ability of a company to survive for a
long period of time. This ratio evaluates the company’s ability to pay its long term debts.
Henceforth, it is also known as long term solvency ratio. It includes debt to equity ratio, time
interest ratio and proprietary ratio.
2 | P a g e
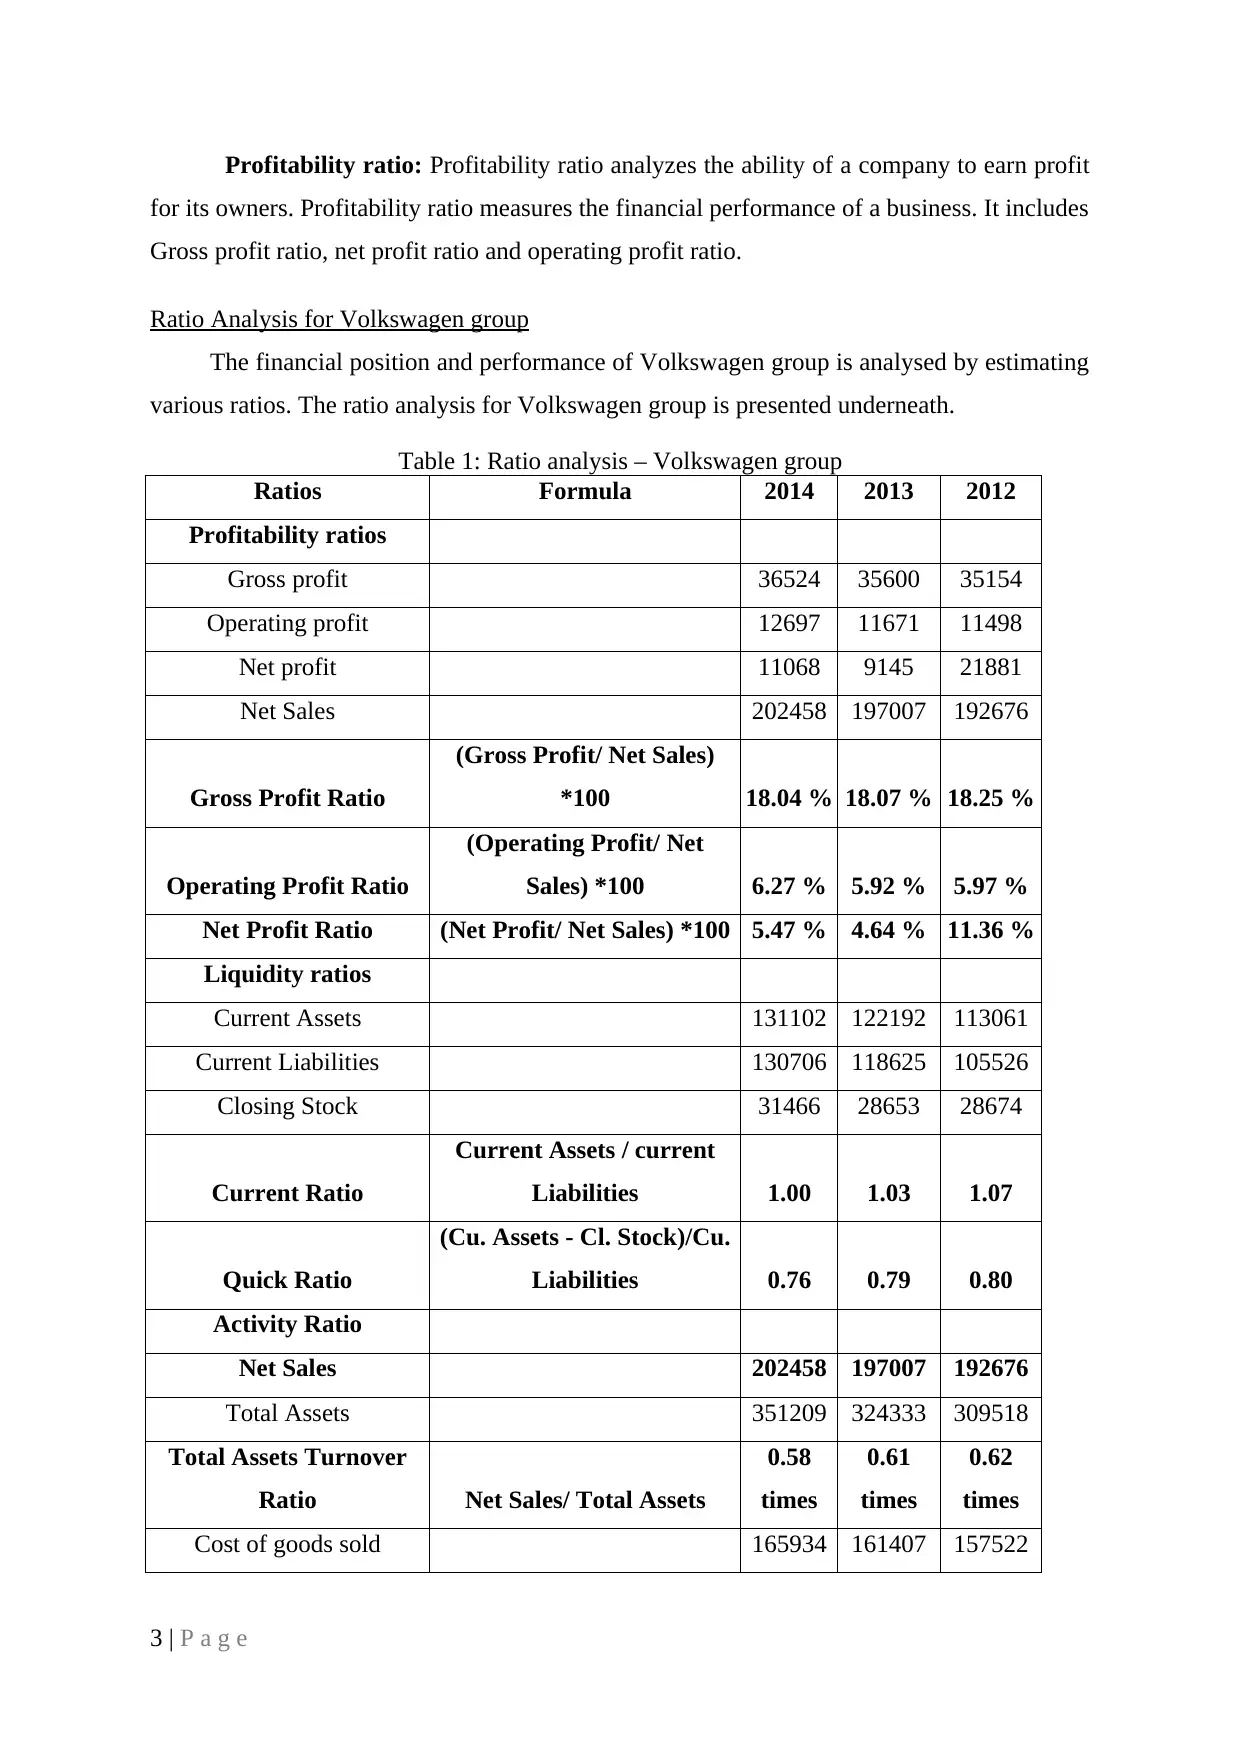
Profitability ratio: Profitability ratio analyzes the ability of a company to earn profit
for its owners. Profitability ratio measures the financial performance of a business. It includes
Gross profit ratio, net profit ratio and operating profit ratio.
Ratio Analysis for Volkswagen group
The financial position and performance of Volkswagen group is analysed by estimating
various ratios. The ratio analysis for Volkswagen group is presented underneath.
Table 1: Ratio analysis – Volkswagen group
Ratios Formula 2014 2013 2012
Profitability ratios
Gross profit 36524 35600 35154
Operating profit 12697 11671 11498
Net profit 11068 9145 21881
Net Sales 202458 197007 192676
Gross Profit Ratio
(Gross Profit/ Net Sales)
*100 18.04 % 18.07 % 18.25 %
Operating Profit Ratio
(Operating Profit/ Net
Sales) *100 6.27 % 5.92 % 5.97 %
Net Profit Ratio (Net Profit/ Net Sales) *100 5.47 % 4.64 % 11.36 %
Liquidity ratios
Current Assets 131102 122192 113061
Current Liabilities 130706 118625 105526
Closing Stock 31466 28653 28674
Current Ratio
Current Assets / current
Liabilities 1.00 1.03 1.07
Quick Ratio
(Cu. Assets - Cl. Stock)/Cu.
Liabilities 0.76 0.79 0.80
Activity Ratio
Net Sales 202458 197007 192676
Total Assets 351209 324333 309518
Total Assets Turnover
Ratio Net Sales/ Total Assets
0.58
times
0.61
times
0.62
times
Cost of goods sold 165934 161407 157522
3 | P a g e
⊘ This is a preview!⊘
Do you want full access?
Subscribe today to unlock all pages.
Trusted by 1+ million students worldwide
Inventory 31466 28653 28674
Inventory Turnover ratio COGS/Inventory 5.27 5.63 5.49
Solvency Ratio
Debt 130314 115672 121996
Equity 90189 90037 81995
Debt Equity Ratio Debt/ Equity 1.44:1 1.28:1 1.49:1
Net income 11068 9145 21881
Annual Interest Expense 2658 2366 2546
Times Interest Ratio
Net Income/ Interest
expense
4.16
times
3.87
times
8.59
times
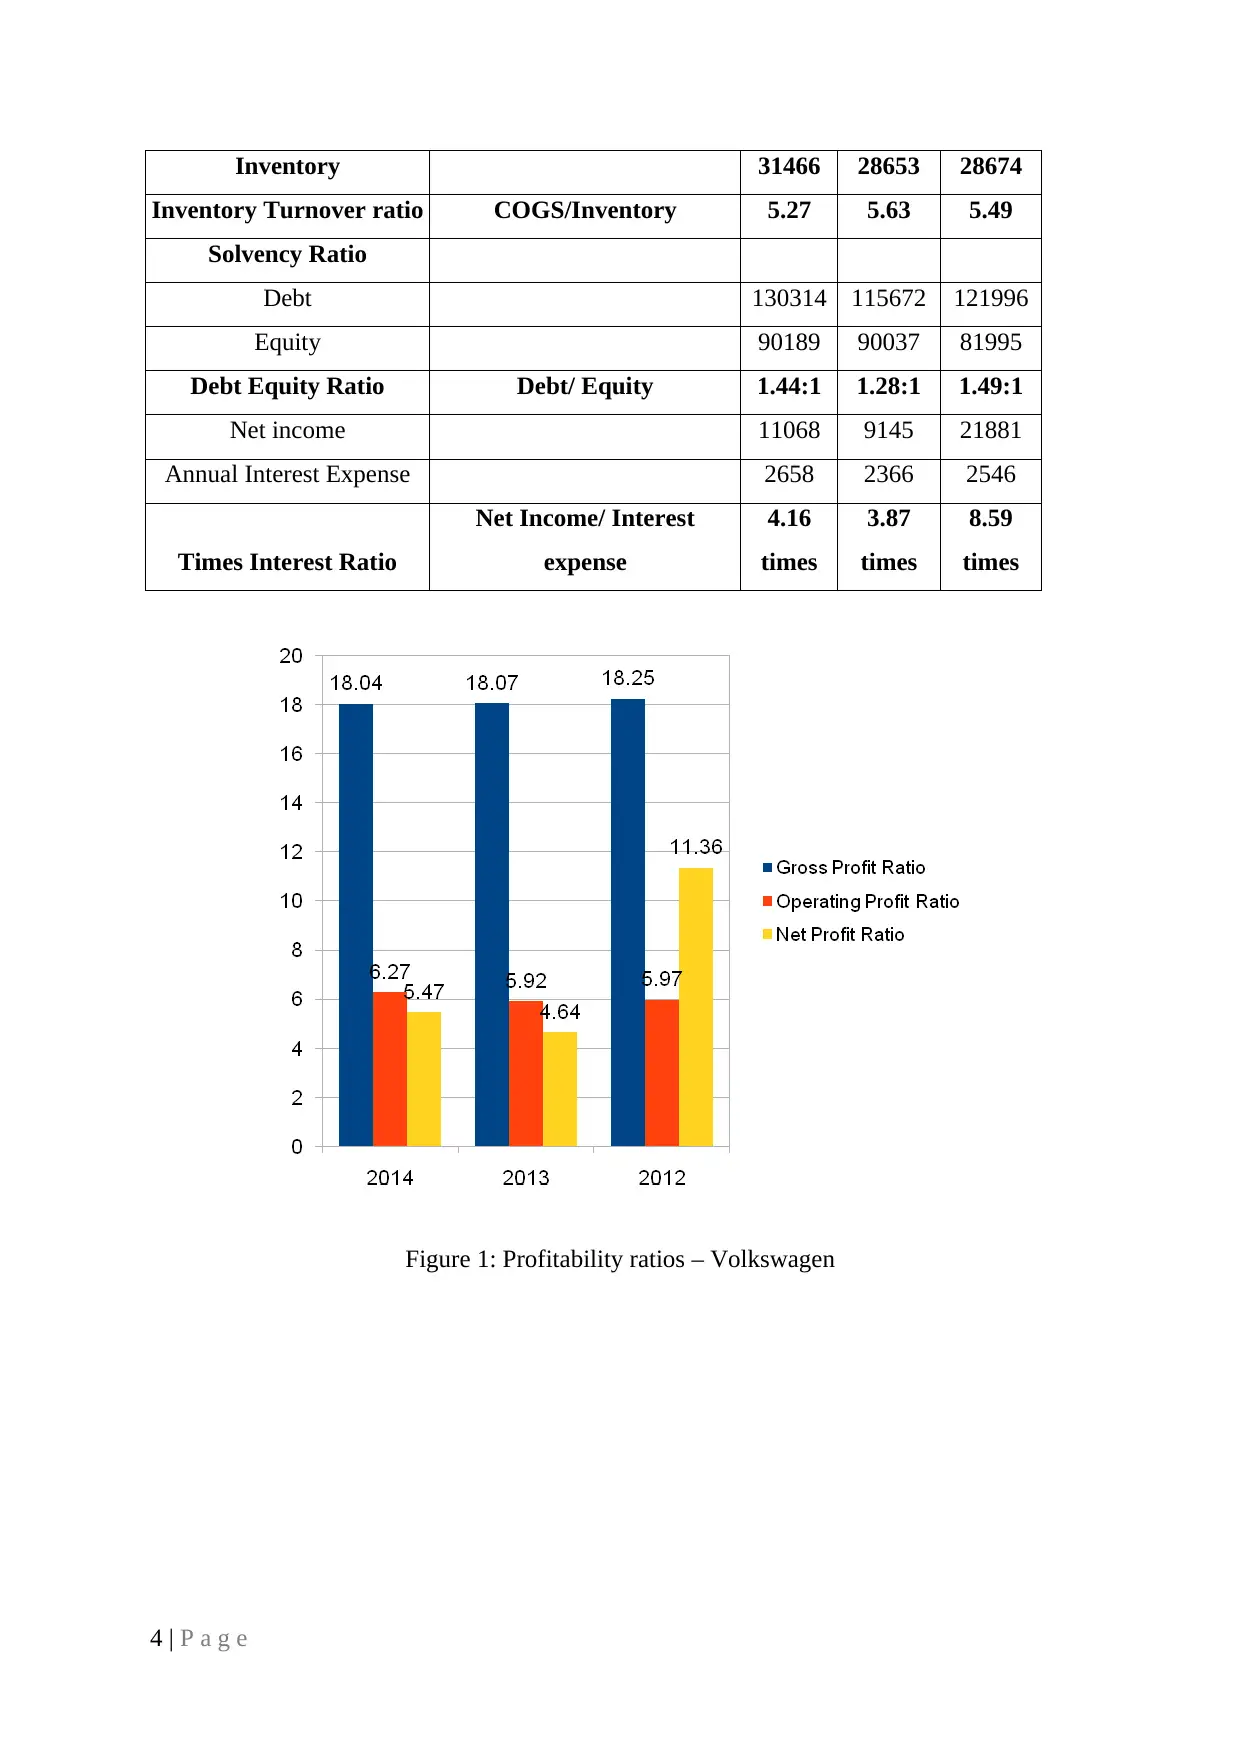
Figure 1: Profitability ratios – Volkswagen
4 | P a g e
Inventory Turnover ratio COGS/Inventory 5.27 5.63 5.49
Solvency Ratio
Debt 130314 115672 121996
Equity 90189 90037 81995
Debt Equity Ratio Debt/ Equity 1.44:1 1.28:1 1.49:1
Net income 11068 9145 21881
Annual Interest Expense 2658 2366 2546
Times Interest Ratio
Net Income/ Interest
expense
4.16
times
3.87
times
8.59
times
Figure 1: Profitability ratios – Volkswagen
4 | P a g e
Paraphrase This Document
Need a fresh take? Get an instant paraphrase of this document with our AI Paraphraser
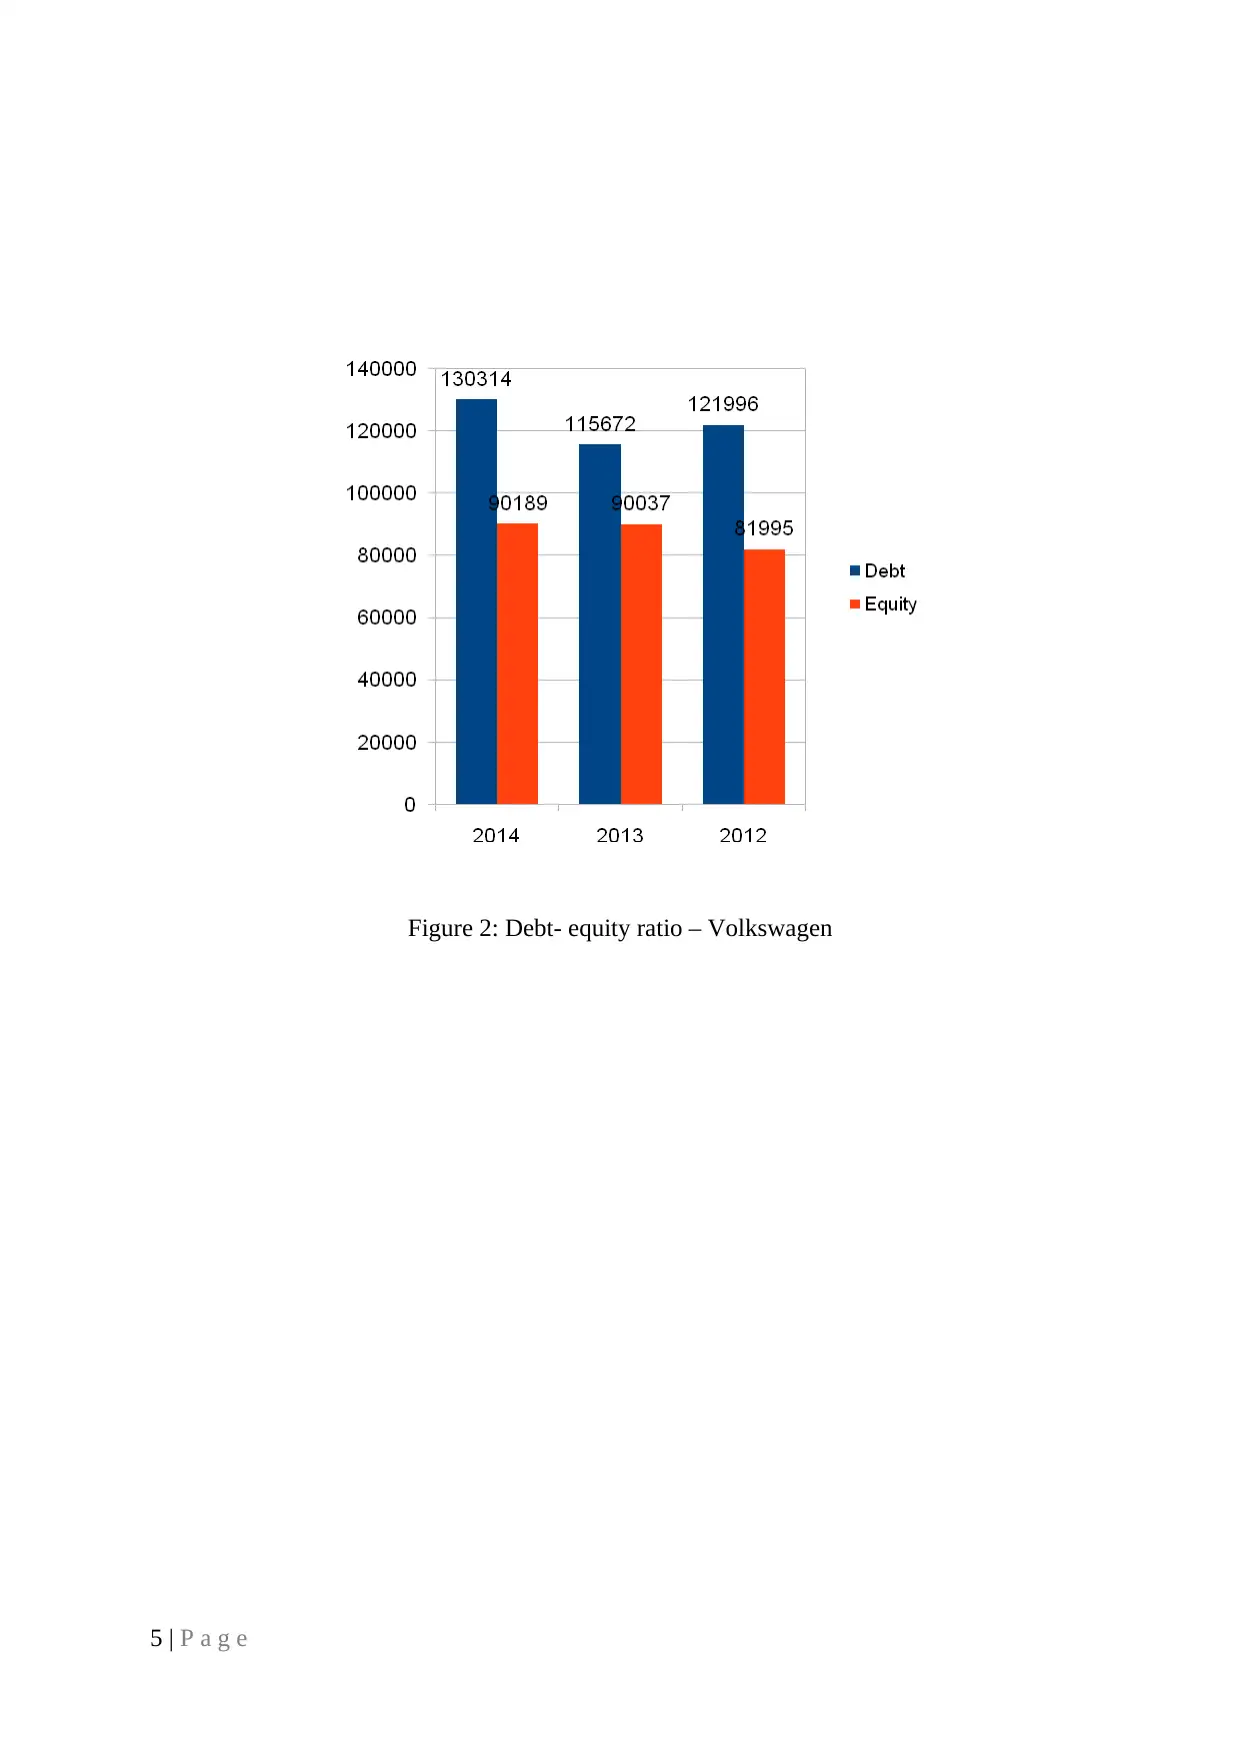
Figure 2: Debt- equity ratio – Volkswagen
5 | P a g e
5 | P a g e
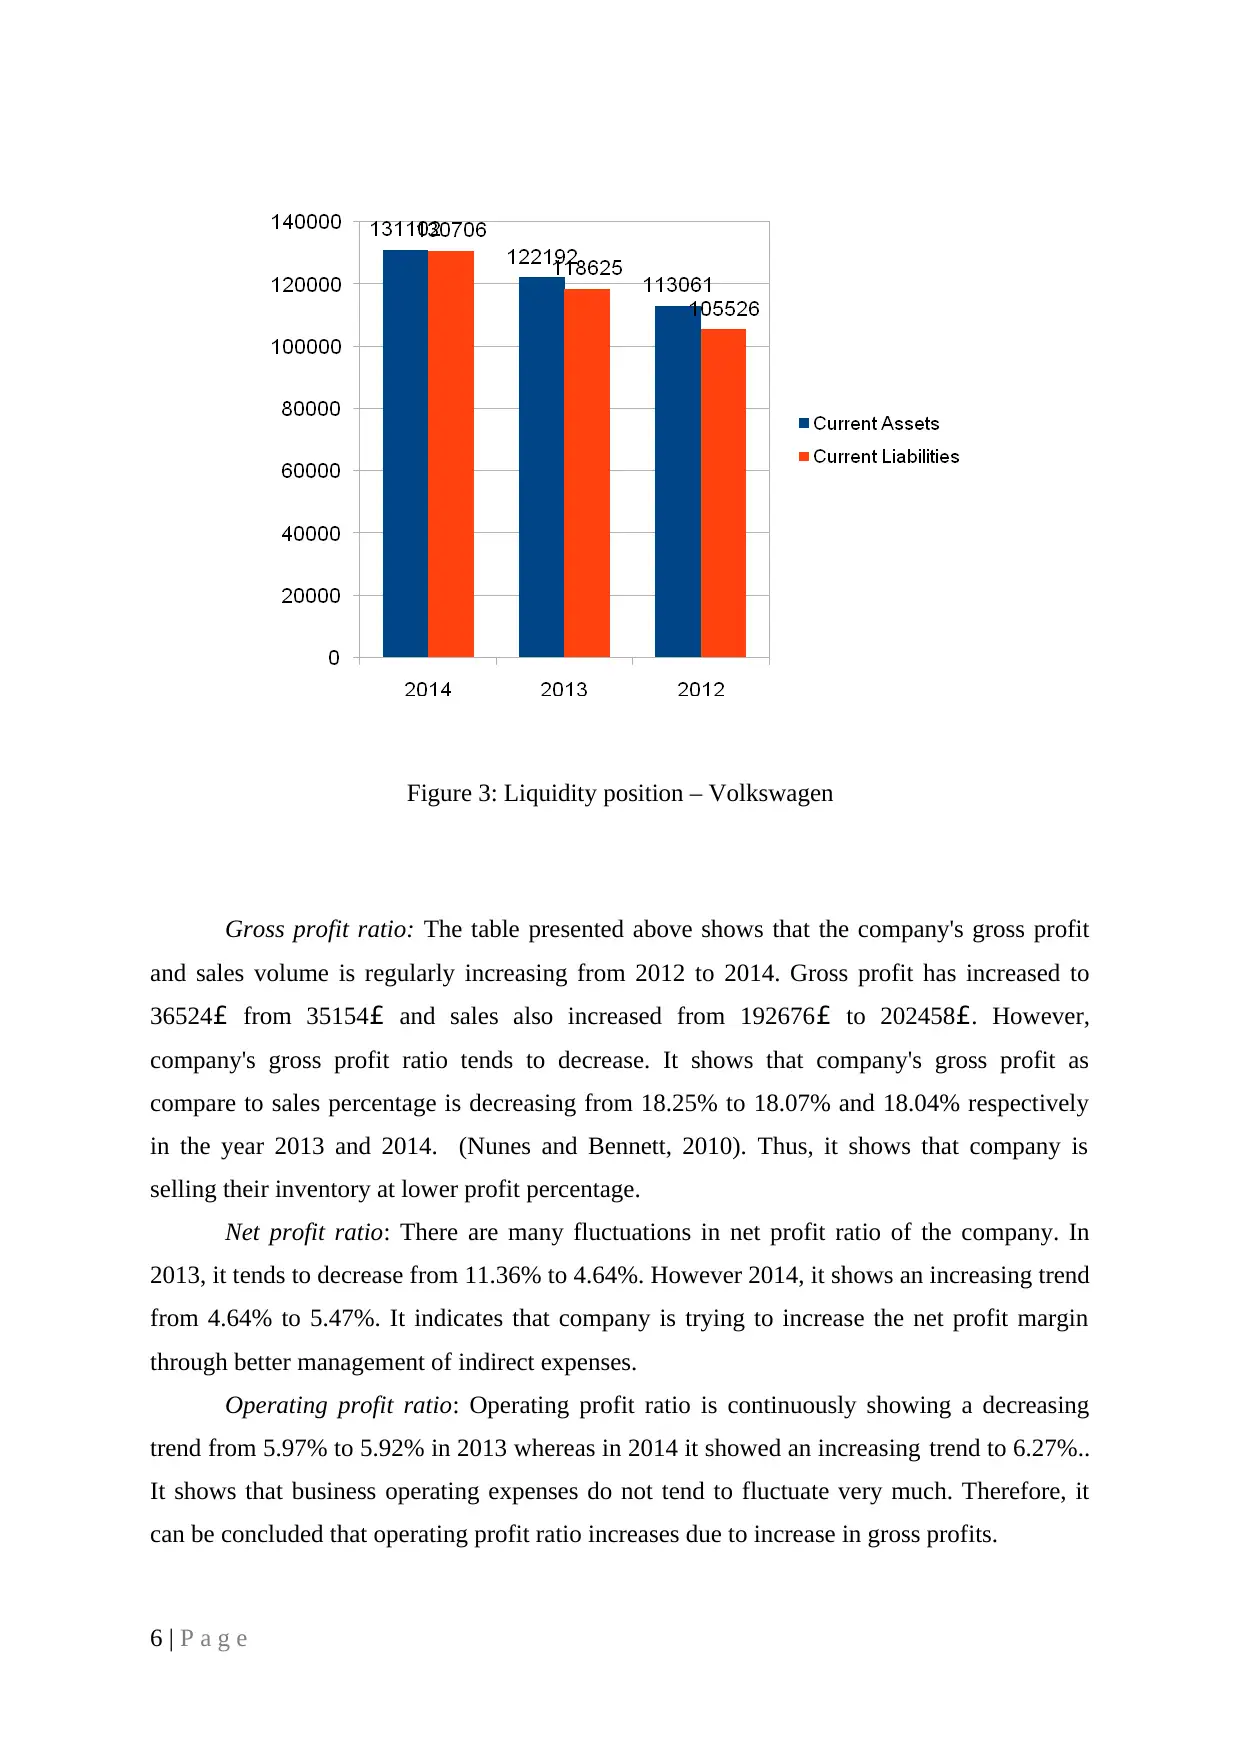
Figure 3: Liquidity position – Volkswagen
Gross profit ratio: The table presented above shows that the company's gross profit
and sales volume is regularly increasing from 2012 to 2014. Gross profit has increased to
36524£ from 35154£ and sales also increased from 192676£ to 202458£. However,
company's gross profit ratio tends to decrease. It shows that company's gross profit as
compare to sales percentage is decreasing from 18.25% to 18.07% and 18.04% respectively
in the year 2013 and 2014. (Nunes and Bennett, 2010). Thus, it shows that company is
selling their inventory at lower profit percentage.
Net profit ratio: There are many fluctuations in net profit ratio of the company. In
2013, it tends to decrease from 11.36% to 4.64%. However 2014, it shows an increasing trend
from 4.64% to 5.47%. It indicates that company is trying to increase the net profit margin
through better management of indirect expenses.
Operating profit ratio: Operating profit ratio is continuously showing a decreasing
trend from 5.97% to 5.92% in 2013 whereas in 2014 it showed an increasing trend to 6.27%..
It shows that business operating expenses do not tend to fluctuate very much. Therefore, it
can be concluded that operating profit ratio increases due to increase in gross profits.
6 | P a g e
⊘ This is a preview!⊘
Do you want full access?
Subscribe today to unlock all pages.
Trusted by 1+ million students worldwide
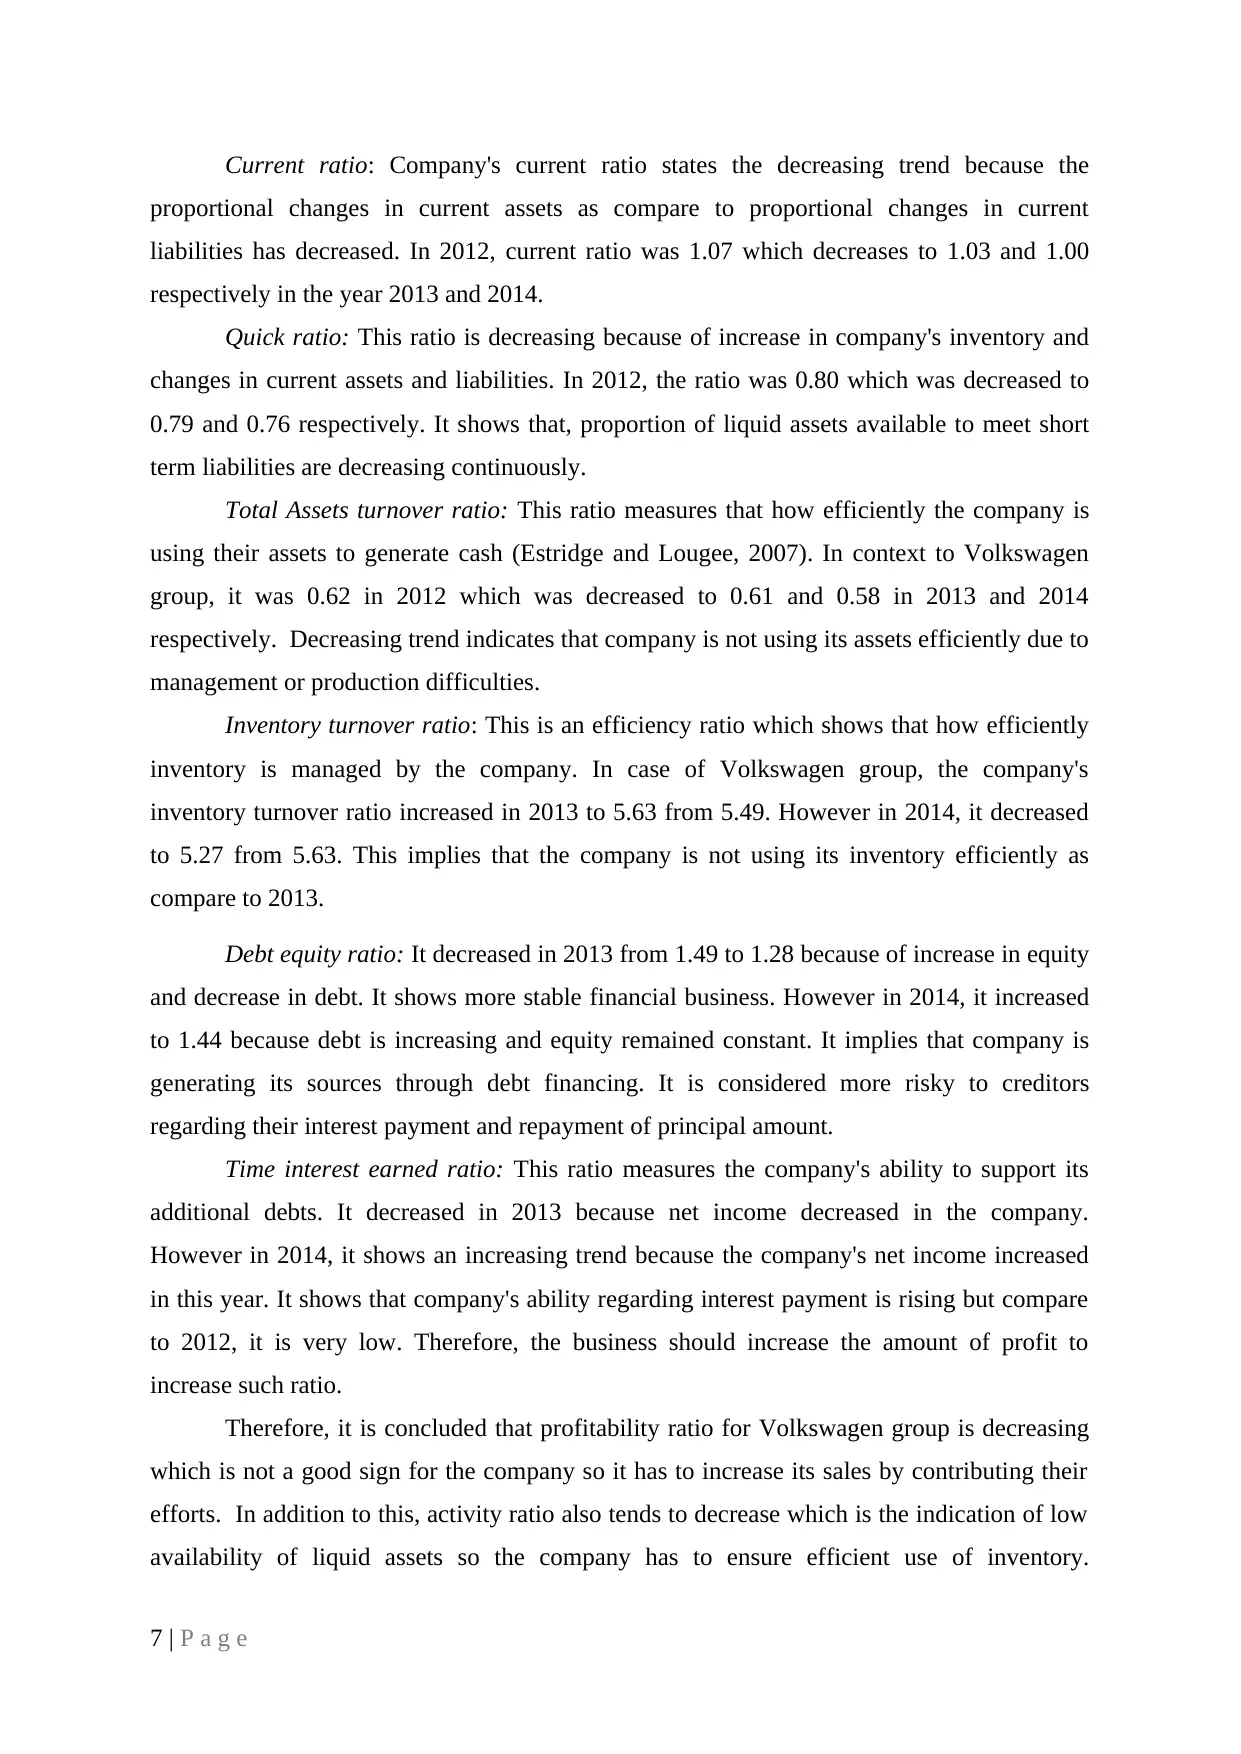
Current ratio: Company's current ratio states the decreasing trend because the
proportional changes in current assets as compare to proportional changes in current
liabilities has decreased. In 2012, current ratio was 1.07 which decreases to 1.03 and 1.00
respectively in the year 2013 and 2014.
Quick ratio: This ratio is decreasing because of increase in company's inventory and
changes in current assets and liabilities. In 2012, the ratio was 0.80 which was decreased to
0.79 and 0.76 respectively. It shows that, proportion of liquid assets available to meet short
term liabilities are decreasing continuously.
Total Assets turnover ratio: This ratio measures that how efficiently the company is
using their assets to generate cash (Estridge and Lougee, 2007). In context to Volkswagen
group, it was 0.62 in 2012 which was decreased to 0.61 and 0.58 in 2013 and 2014
respectively. Decreasing trend indicates that company is not using its assets efficiently due to
management or production difficulties.
Inventory turnover ratio: This is an efficiency ratio which shows that how efficiently
inventory is managed by the company. In case of Volkswagen group, the company's
inventory turnover ratio increased in 2013 to 5.63 from 5.49. However in 2014, it decreased
to 5.27 from 5.63. This implies that the company is not using its inventory efficiently as
compare to 2013.
Debt equity ratio: It decreased in 2013 from 1.49 to 1.28 because of increase in equity
and decrease in debt. It shows more stable financial business. However in 2014, it increased
to 1.44 because debt is increasing and equity remained constant. It implies that company is
generating its sources through debt financing. It is considered more risky to creditors
regarding their interest payment and repayment of principal amount.
Time interest earned ratio: This ratio measures the company's ability to support its
additional debts. It decreased in 2013 because net income decreased in the company.
However in 2014, it shows an increasing trend because the company's net income increased
in this year. It shows that company's ability regarding interest payment is rising but compare
to 2012, it is very low. Therefore, the business should increase the amount of profit to
increase such ratio.
Therefore, it is concluded that profitability ratio for Volkswagen group is decreasing
which is not a good sign for the company so it has to increase its sales by contributing their
efforts. In addition to this, activity ratio also tends to decrease which is the indication of low
availability of liquid assets so the company has to ensure efficient use of inventory.
7 | P a g e
Paraphrase This Document
Need a fresh take? Get an instant paraphrase of this document with our AI Paraphraser
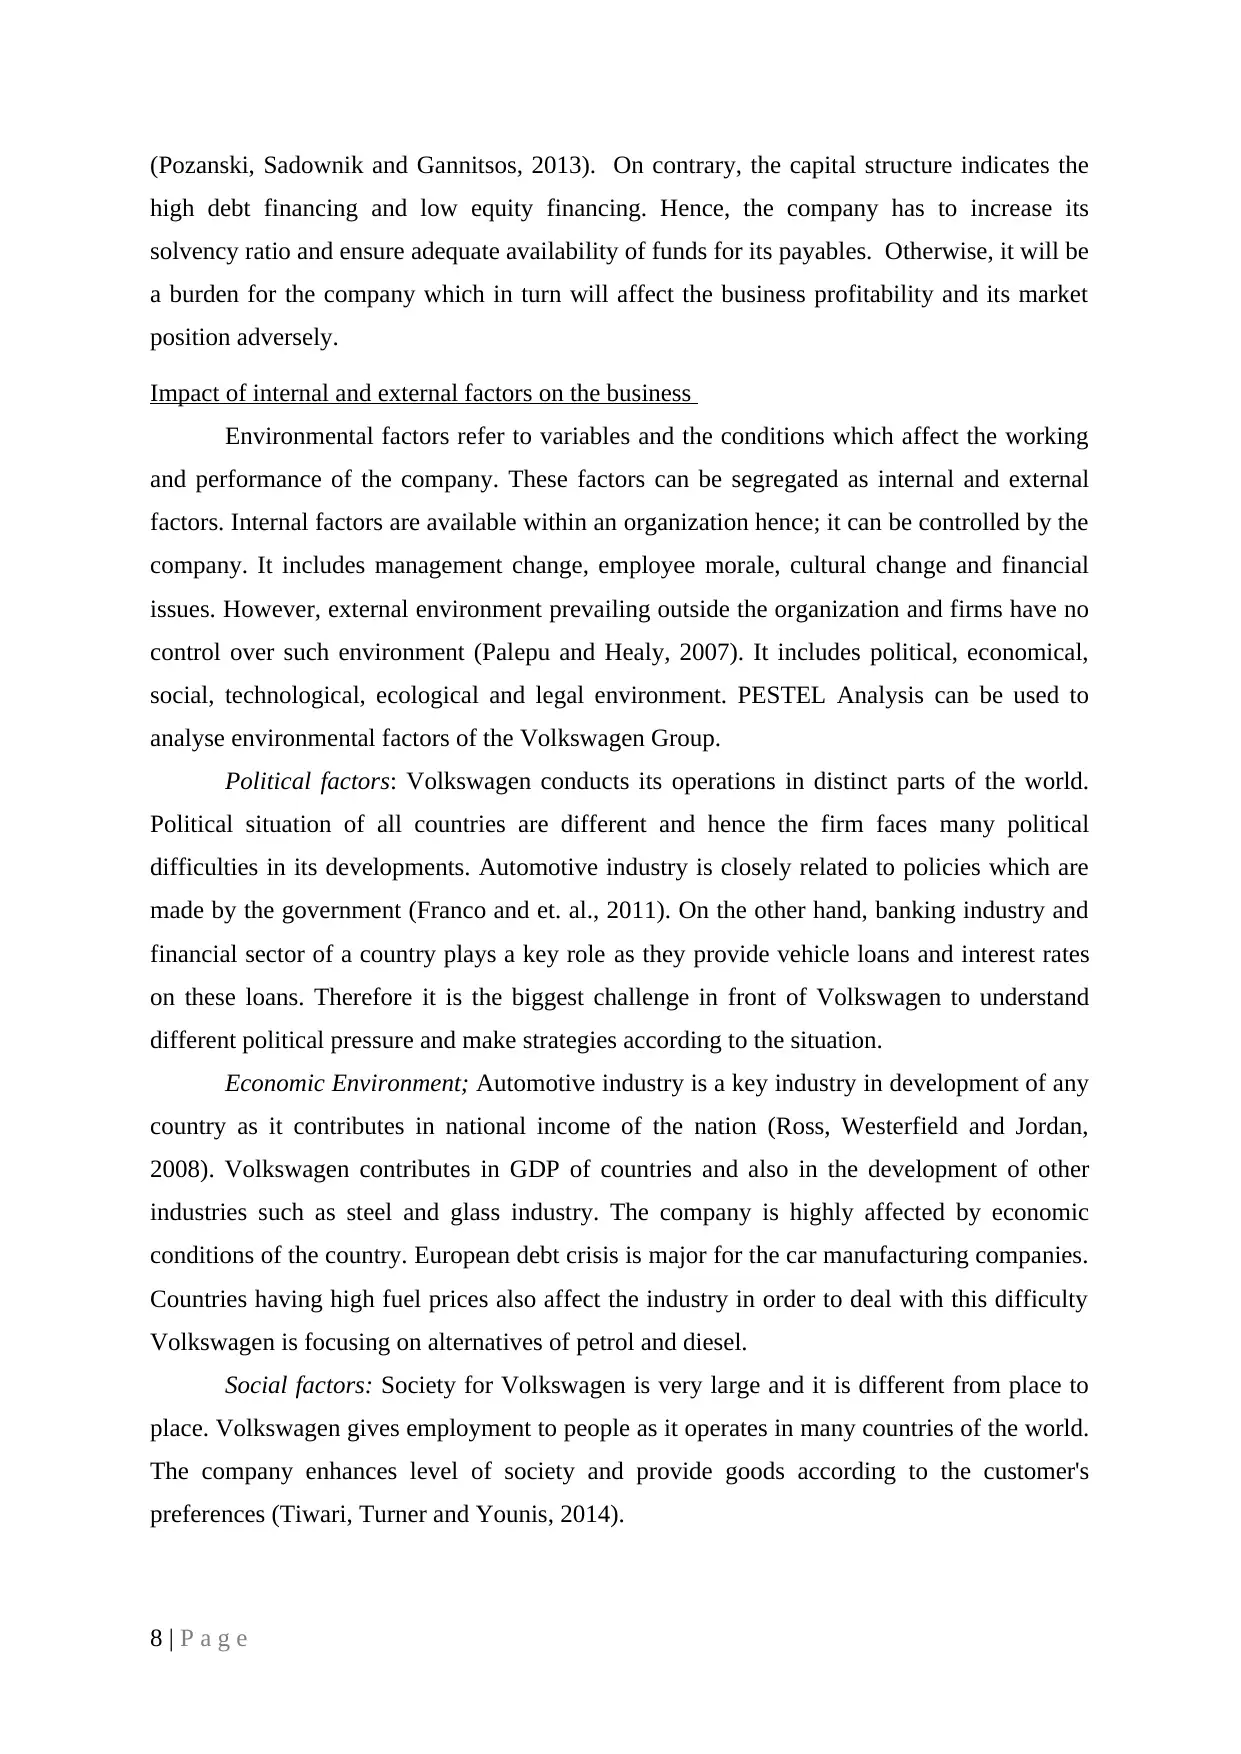
(Pozanski, Sadownik and Gannitsos, 2013). On contrary, the capital structure indicates the
high debt financing and low equity financing. Hence, the company has to increase its
solvency ratio and ensure adequate availability of funds for its payables. Otherwise, it will be
a burden for the company which in turn will affect the business profitability and its market
position adversely.
Impact of internal and external factors on the business
Environmental factors refer to variables and the conditions which affect the working
and performance of the company. These factors can be segregated as internal and external
factors. Internal factors are available within an organization hence; it can be controlled by the
company. It includes management change, employee morale, cultural change and financial
issues. However, external environment prevailing outside the organization and firms have no
control over such environment (Palepu and Healy, 2007). It includes political, economical,
social, technological, ecological and legal environment. PESTEL Analysis can be used to
analyse environmental factors of the Volkswagen Group.
Political factors: Volkswagen conducts its operations in distinct parts of the world.
Political situation of all countries are different and hence the firm faces many political
difficulties in its developments. Automotive industry is closely related to policies which are
made by the government (Franco and et. al., 2011). On the other hand, banking industry and
financial sector of a country plays a key role as they provide vehicle loans and interest rates
on these loans. Therefore it is the biggest challenge in front of Volkswagen to understand
different political pressure and make strategies according to the situation.
Economic Environment; Automotive industry is a key industry in development of any
country as it contributes in national income of the nation (Ross, Westerfield and Jordan,
2008). Volkswagen contributes in GDP of countries and also in the development of other
industries such as steel and glass industry. The company is highly affected by economic
conditions of the country. European debt crisis is major for the car manufacturing companies.
Countries having high fuel prices also affect the industry in order to deal with this difficulty
Volkswagen is focusing on alternatives of petrol and diesel.
Social factors: Society for Volkswagen is very large and it is different from place to
place. Volkswagen gives employment to people as it operates in many countries of the world.
The company enhances level of society and provide goods according to the customer's
preferences (Tiwari, Turner and Younis, 2014).
8 | P a g e
Technological Factors: Volkswagen operates in both segments classical as well as
sporty. Brands such as Audi, Bentley and Skoda are highly technology upgraded well
maintained cars (Robinson and et. al., 2015). Technology helps in the production of the cars
which in turn helps in increasing sales and profitability.
Environmental factors: The car manufacturing company has vital impact on the
environment of nation. A car uses diesel and petrol as fuel which pollutes the environment.
Moreover, the raw material used, steel made from iron and smoke also pollutes the
environment. Therefore, the company needs to take care of natural environment.
Legal Factors: Automotive industry needs to follow rules and regulations as per the
legal requirement of nation (Wahlen, Baginski and Bradshaw, 2014). It is a big challenge for
Volkswagen as it is operating in many countries of the world with different legal
requirements. Therefore, the company needs to follow consumer protection law, labour law,
competition law, emission law and taxation law.
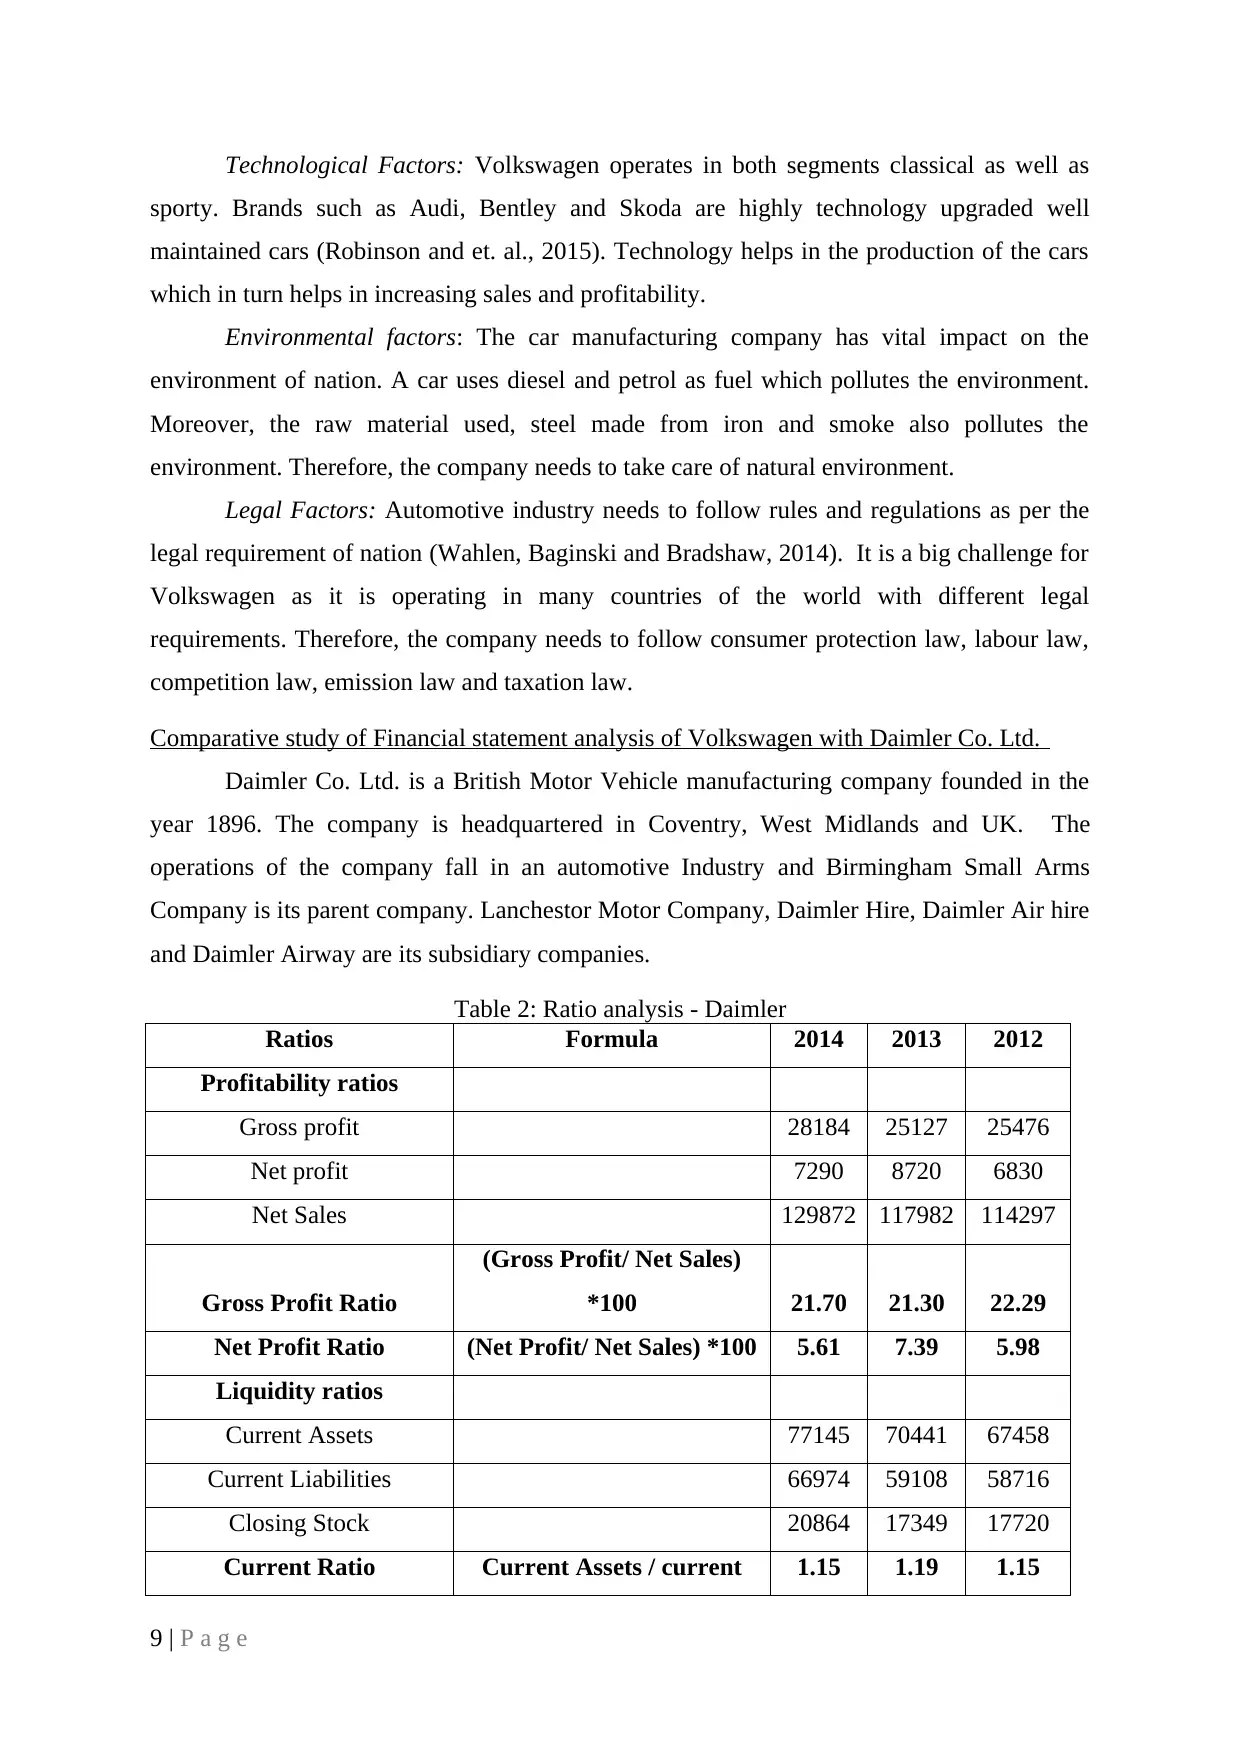
Comparative study of Financial statement analysis of Volkswagen with Daimler Co. Ltd.
Daimler Co. Ltd. is a British Motor Vehicle manufacturing company founded in the
year 1896. The company is headquartered in Coventry, West Midlands and UK. The
operations of the company fall in an automotive Industry and Birmingham Small Arms
Company is its parent company. Lanchestor Motor Company, Daimler Hire, Daimler Air hire
and Daimler Airway are its subsidiary companies.
Table 2: Ratio analysis - Daimler
Ratios Formula 2014 2013 2012
Profitability ratios
Gross profit 28184 25127 25476
Net profit 7290 8720 6830
Net Sales 129872 117982 114297
Gross Profit Ratio
(Gross Profit/ Net Sales)
*100 21.70 21.30 22.29
Net Profit Ratio (Net Profit/ Net Sales) *100 5.61 7.39 5.98
Liquidity ratios
Current Assets 77145 70441 67458
Current Liabilities 66974 59108 58716
Closing Stock 20864 17349 17720
Current Ratio Current Assets / current 1.15 1.19 1.15
9 | P a g e
sporty. Brands such as Audi, Bentley and Skoda are highly technology upgraded well
maintained cars (Robinson and et. al., 2015). Technology helps in the production of the cars
which in turn helps in increasing sales and profitability.
Environmental factors: The car manufacturing company has vital impact on the
environment of nation. A car uses diesel and petrol as fuel which pollutes the environment.
Moreover, the raw material used, steel made from iron and smoke also pollutes the
environment. Therefore, the company needs to take care of natural environment.
Legal Factors: Automotive industry needs to follow rules and regulations as per the
legal requirement of nation (Wahlen, Baginski and Bradshaw, 2014). It is a big challenge for
Volkswagen as it is operating in many countries of the world with different legal
requirements. Therefore, the company needs to follow consumer protection law, labour law,
competition law, emission law and taxation law.
Comparative study of Financial statement analysis of Volkswagen with Daimler Co. Ltd.
Daimler Co. Ltd. is a British Motor Vehicle manufacturing company founded in the
year 1896. The company is headquartered in Coventry, West Midlands and UK. The
operations of the company fall in an automotive Industry and Birmingham Small Arms
Company is its parent company. Lanchestor Motor Company, Daimler Hire, Daimler Air hire
and Daimler Airway are its subsidiary companies.
Table 2: Ratio analysis - Daimler
Ratios Formula 2014 2013 2012
Profitability ratios
Gross profit 28184 25127 25476
Net profit 7290 8720 6830
Net Sales 129872 117982 114297
Gross Profit Ratio
(Gross Profit/ Net Sales)
*100 21.70 21.30 22.29
Net Profit Ratio (Net Profit/ Net Sales) *100 5.61 7.39 5.98
Liquidity ratios
Current Assets 77145 70441 67458
Current Liabilities 66974 59108 58716
Closing Stock 20864 17349 17720
Current Ratio Current Assets / current 1.15 1.19 1.15
9 | P a g e
⊘ This is a preview!⊘
Do you want full access?
Subscribe today to unlock all pages.
Trusted by 1+ million students worldwide
1 out of 19
Related Documents


Your All-in-One AI-Powered Toolkit for Academic Success.
+13062052269
info@desklib.com
Available 24*7 on WhatsApp / Email
![[object Object]](/_next/static/media/star-bottom.7253800d.svg)
Unlock your academic potential
Copyright © 2020–2026 A2Z Services. All Rights Reserved. Developed and managed by ZUCOL.