Rotterdam EMBA Business Case Analysis: Vox Inc. Salary Discrimination
VerifiedAdded on 2022/09/06
|21
|1800
|21
Report
AI Summary
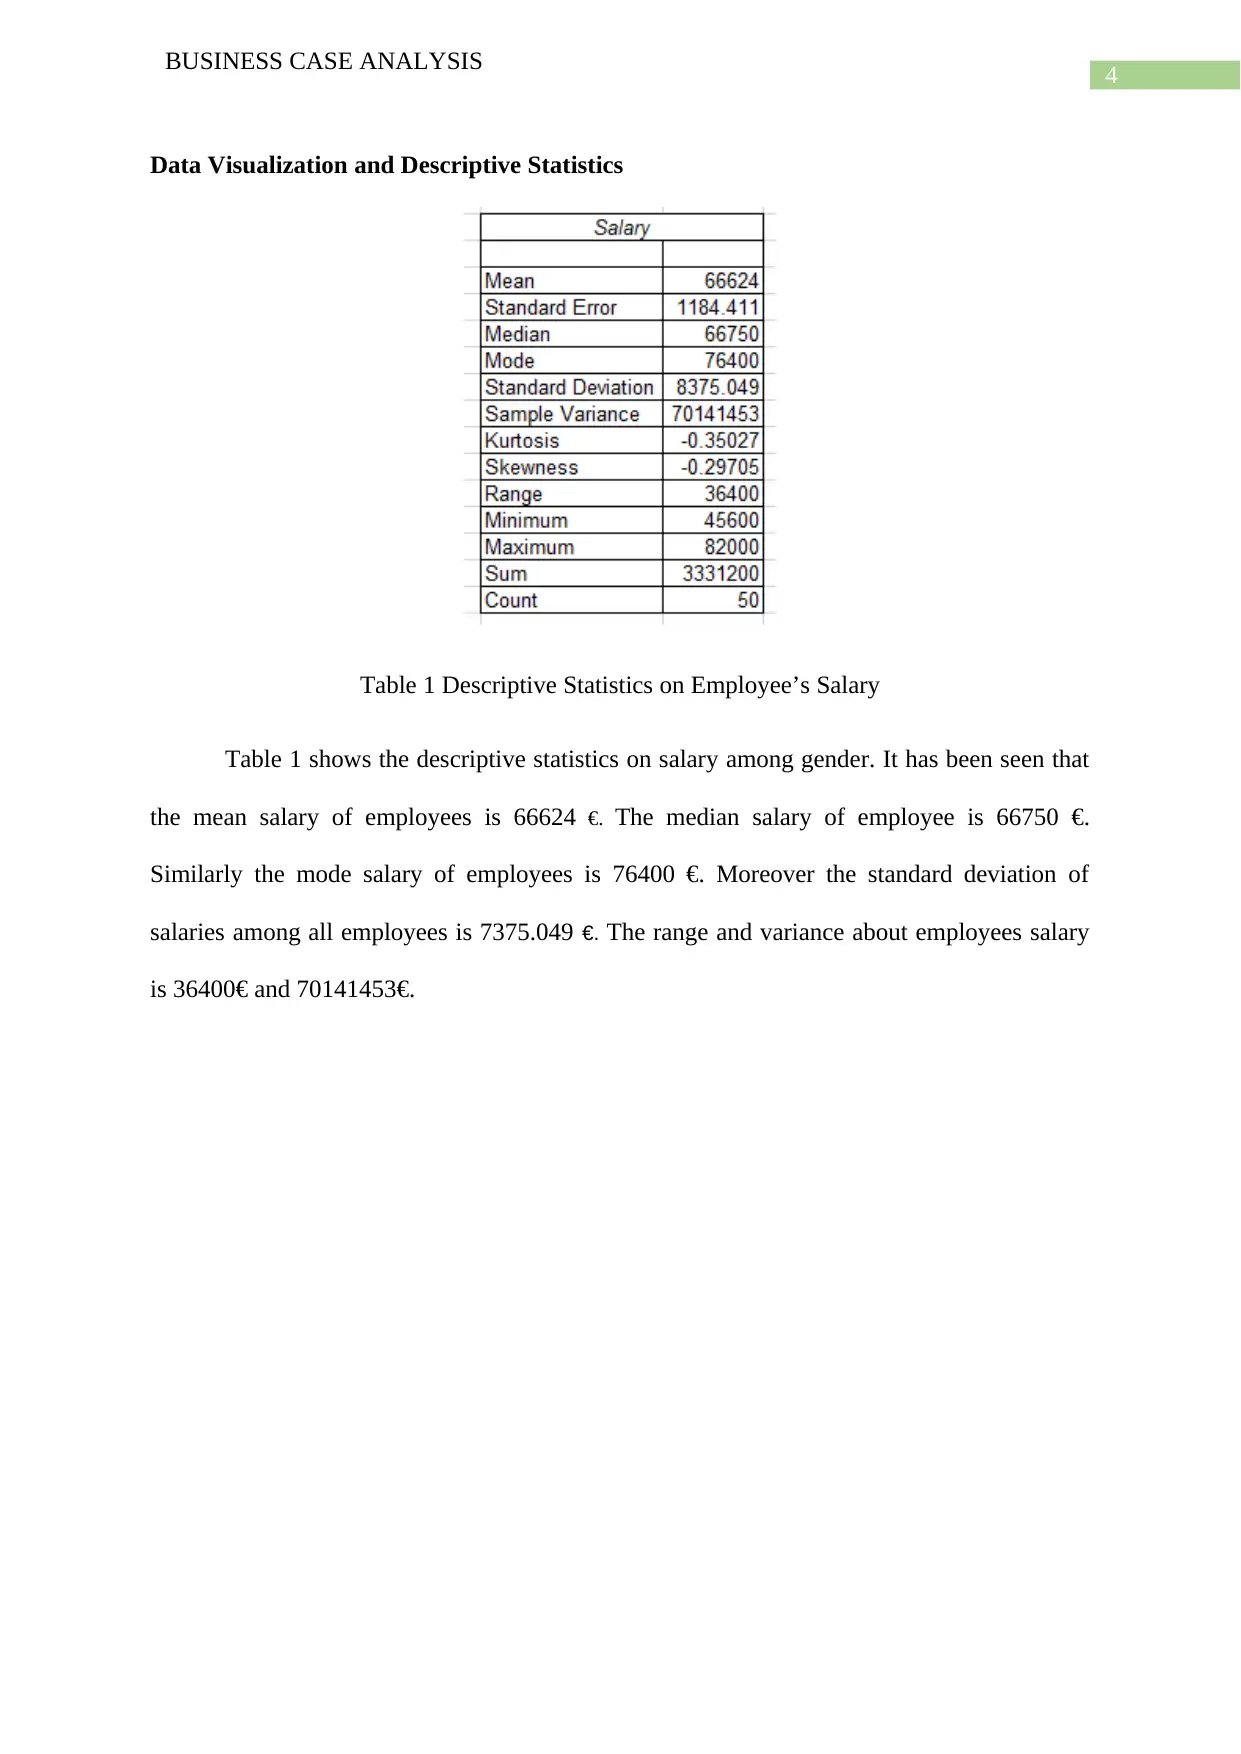
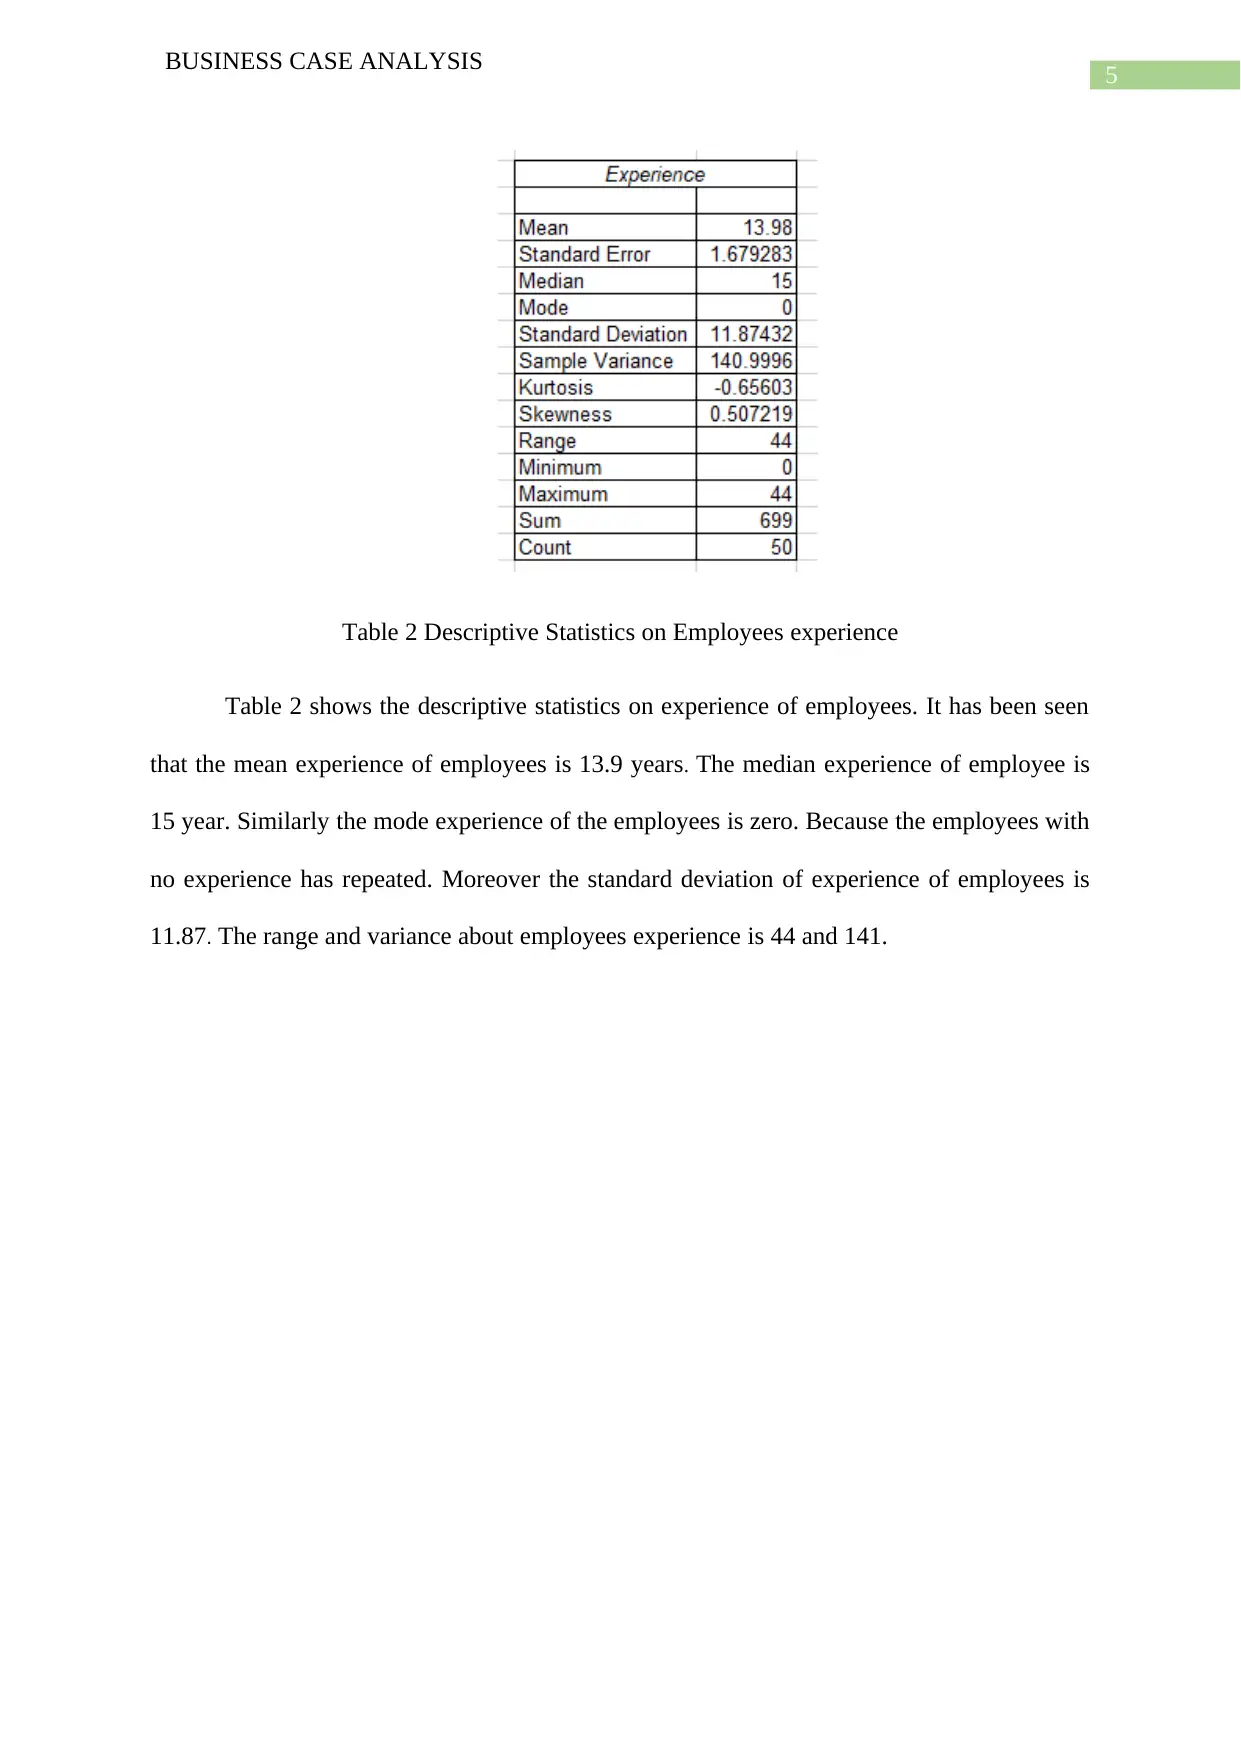
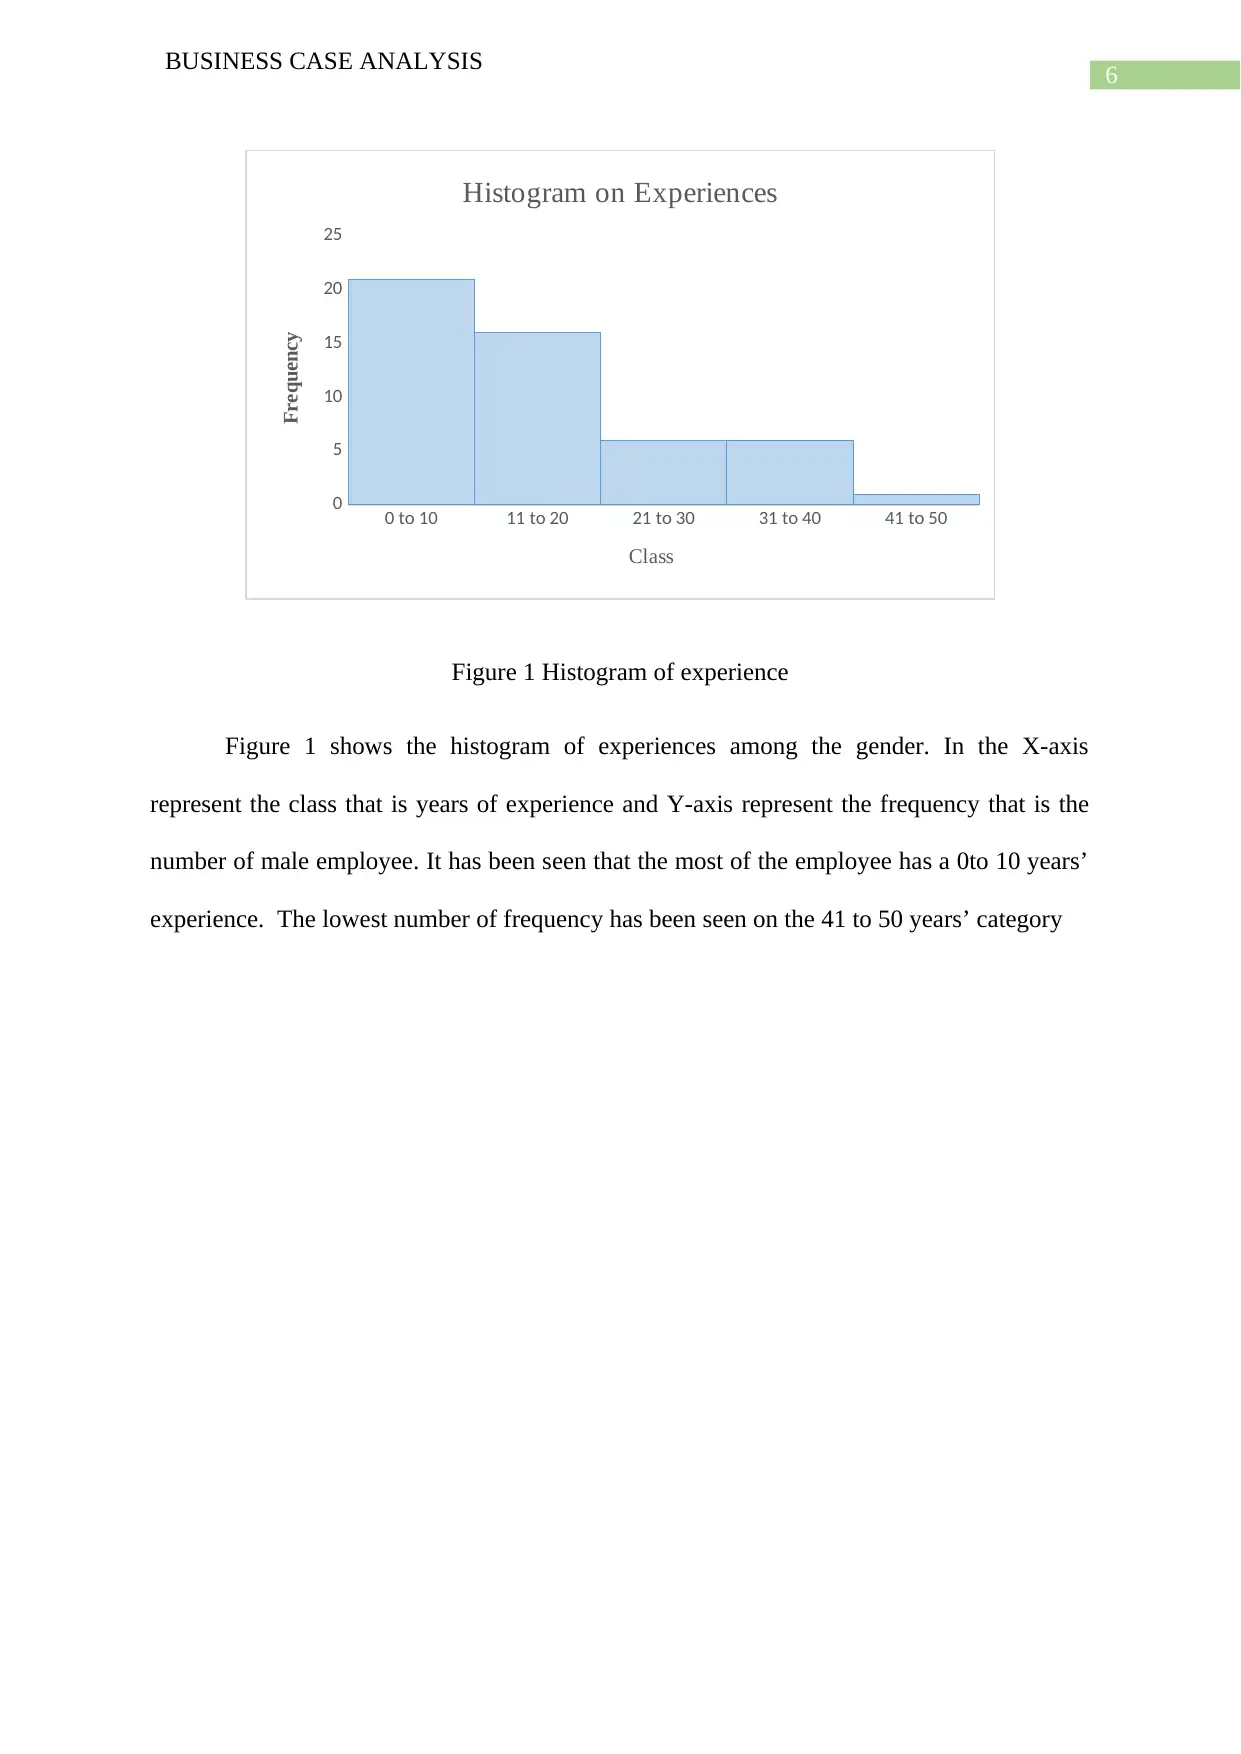
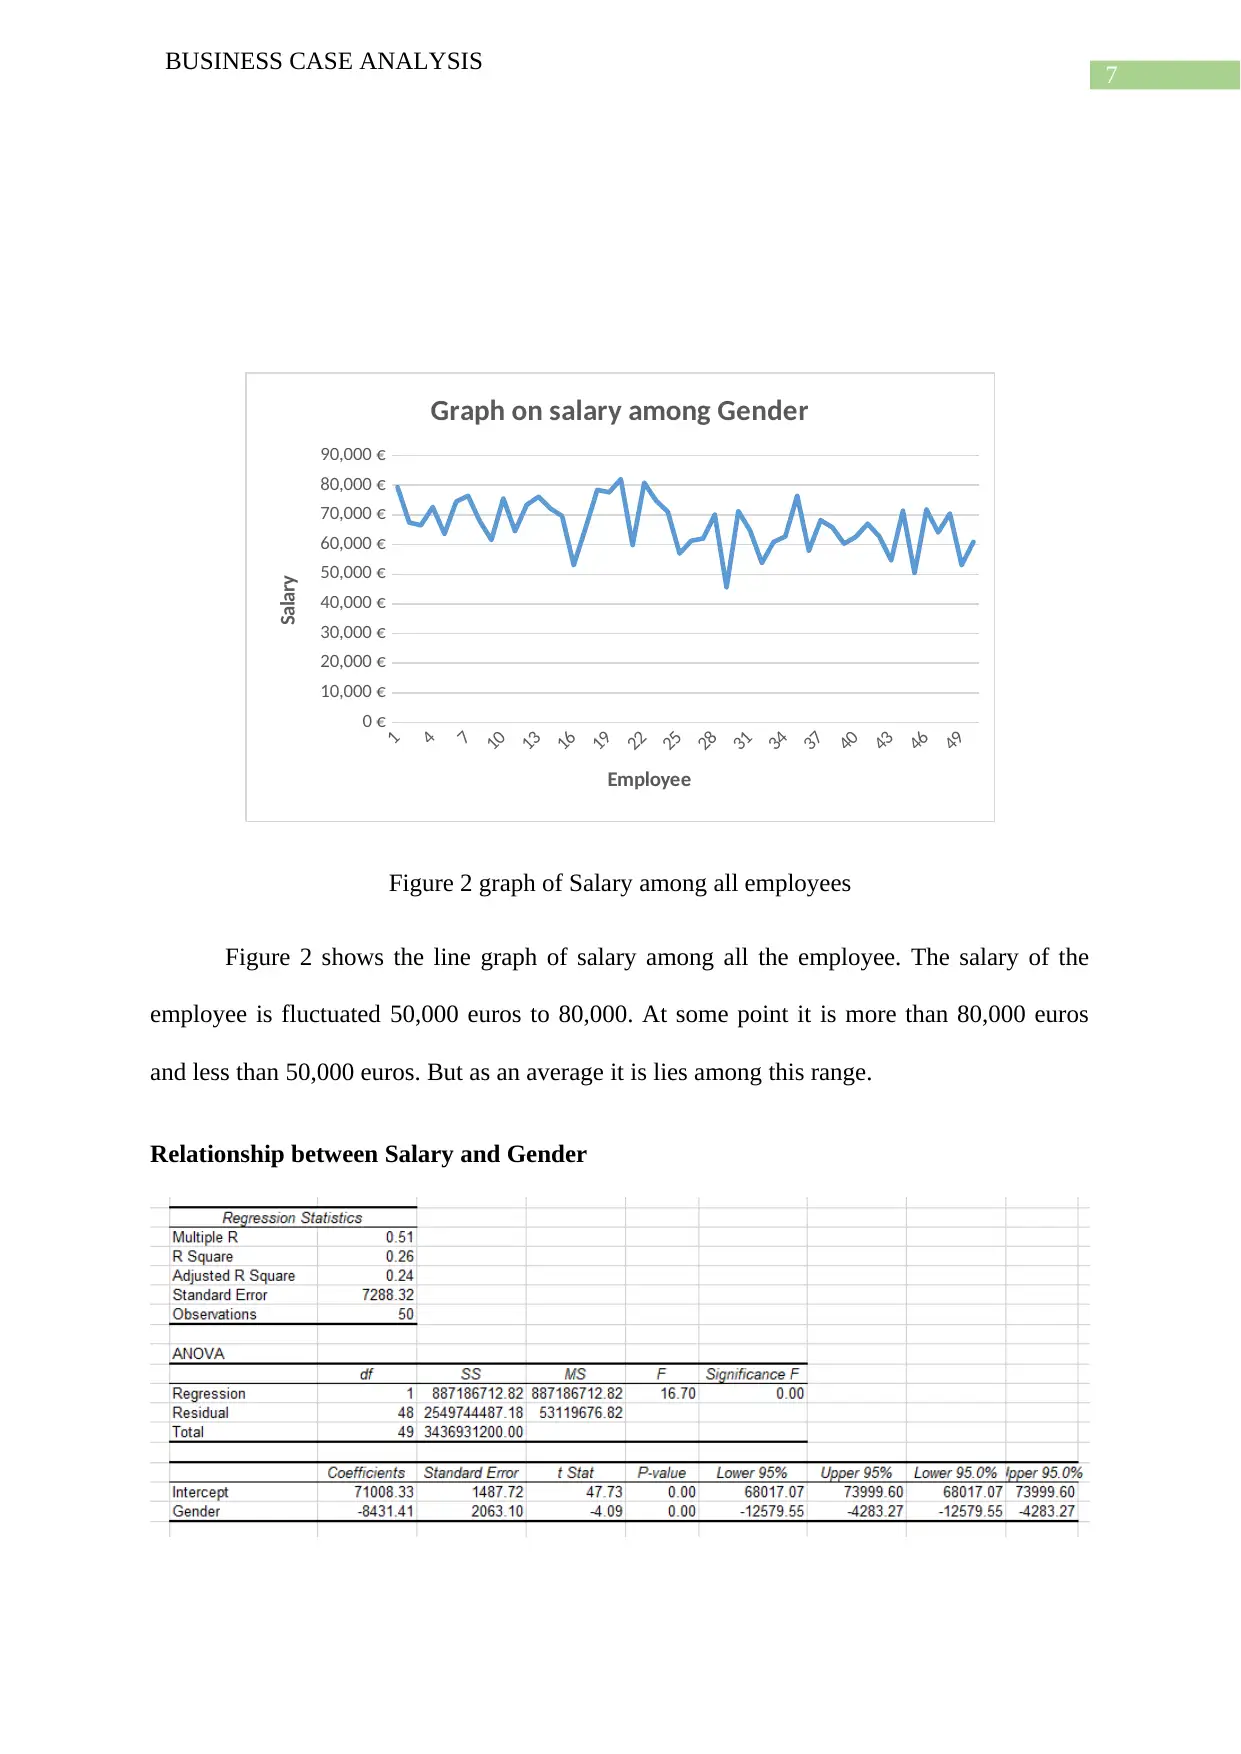
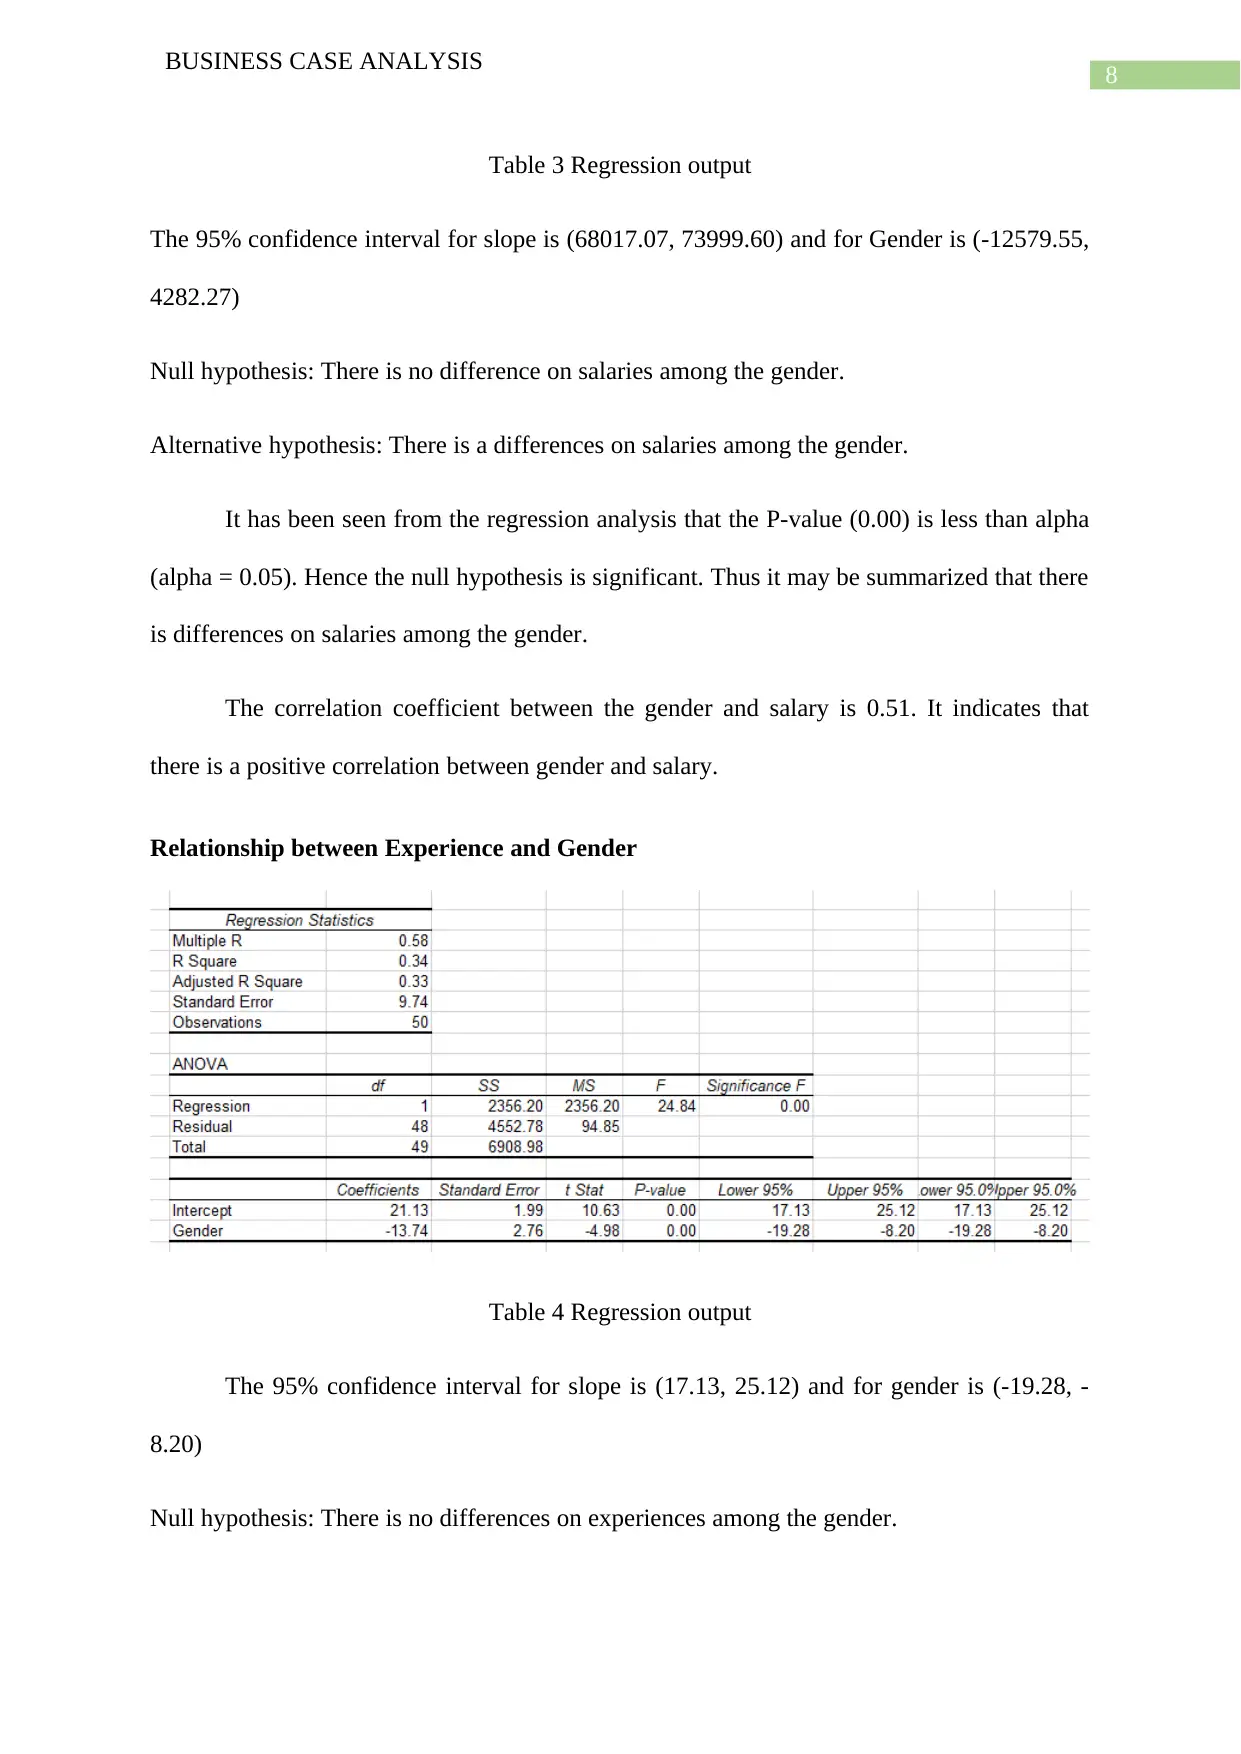
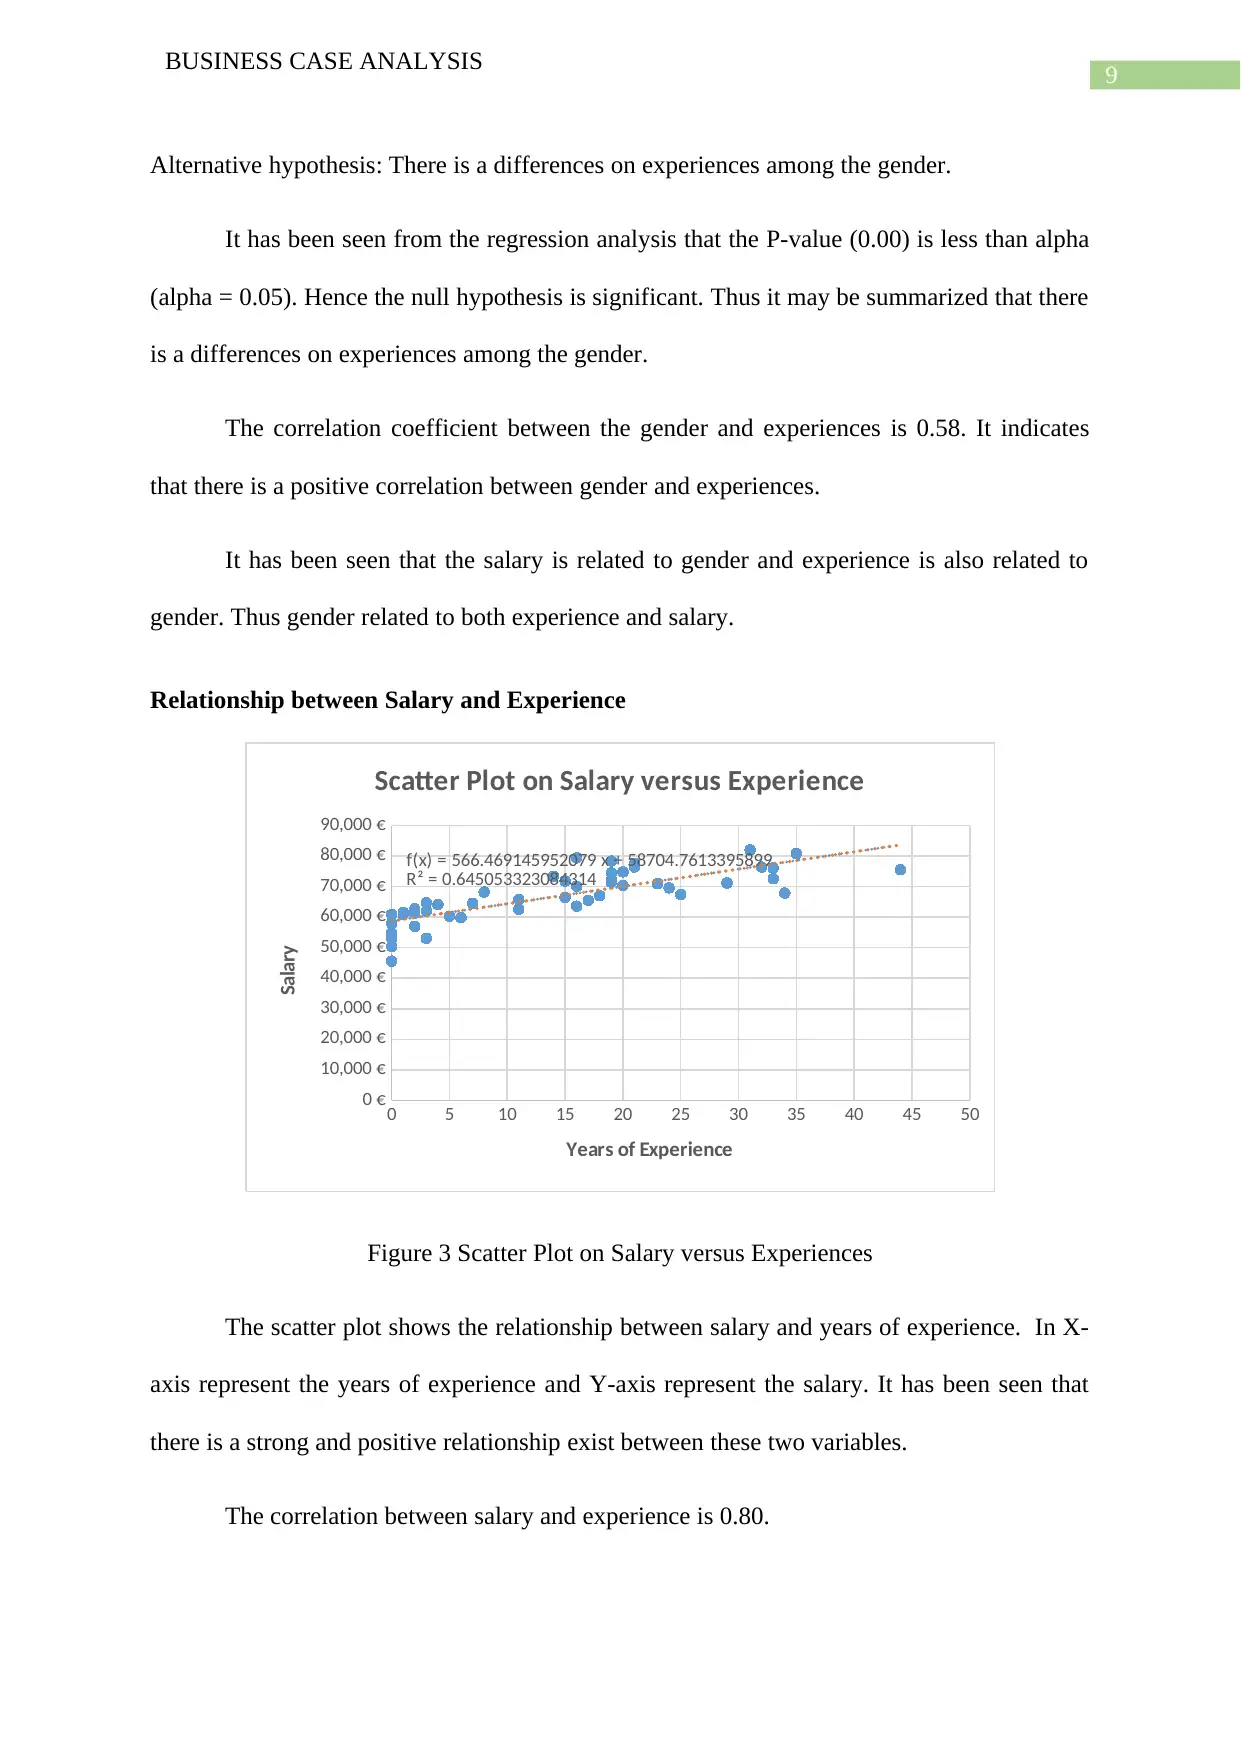
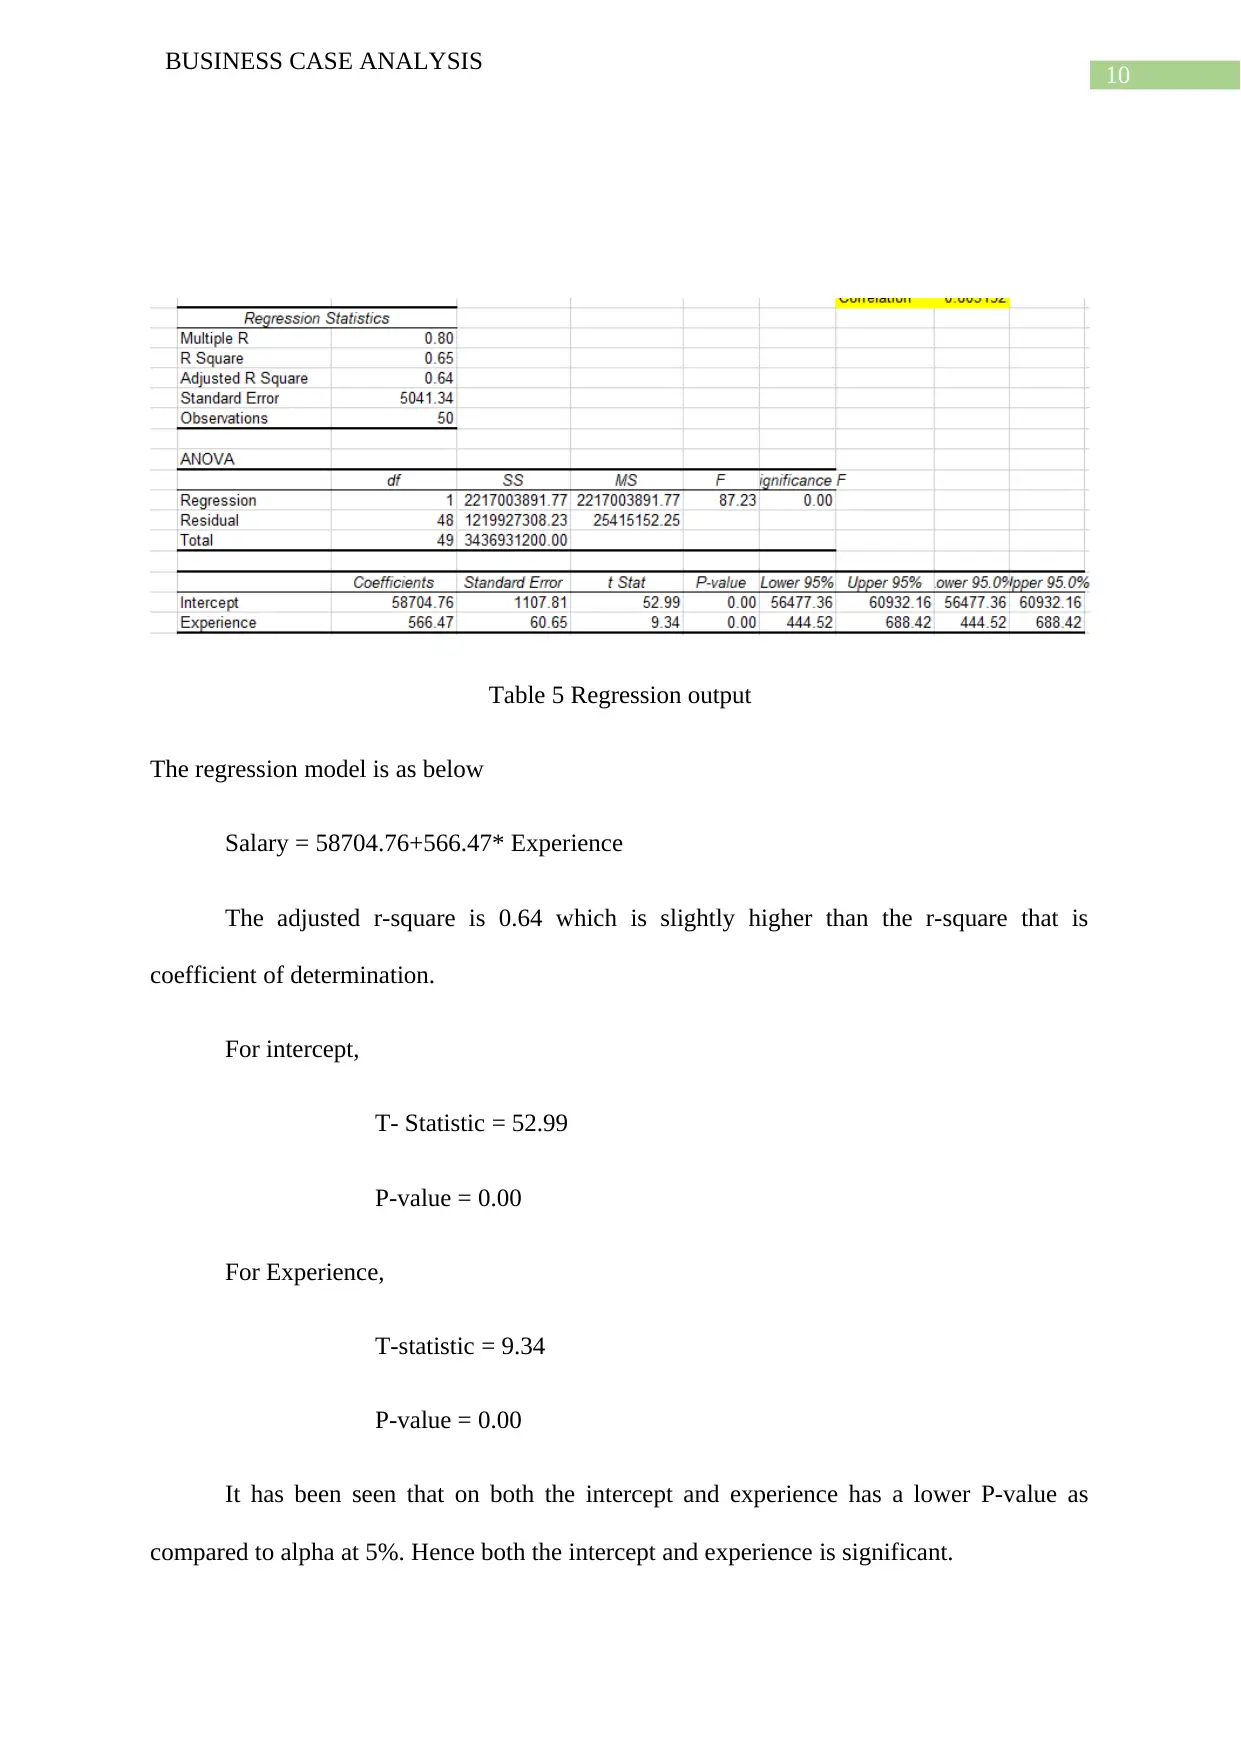
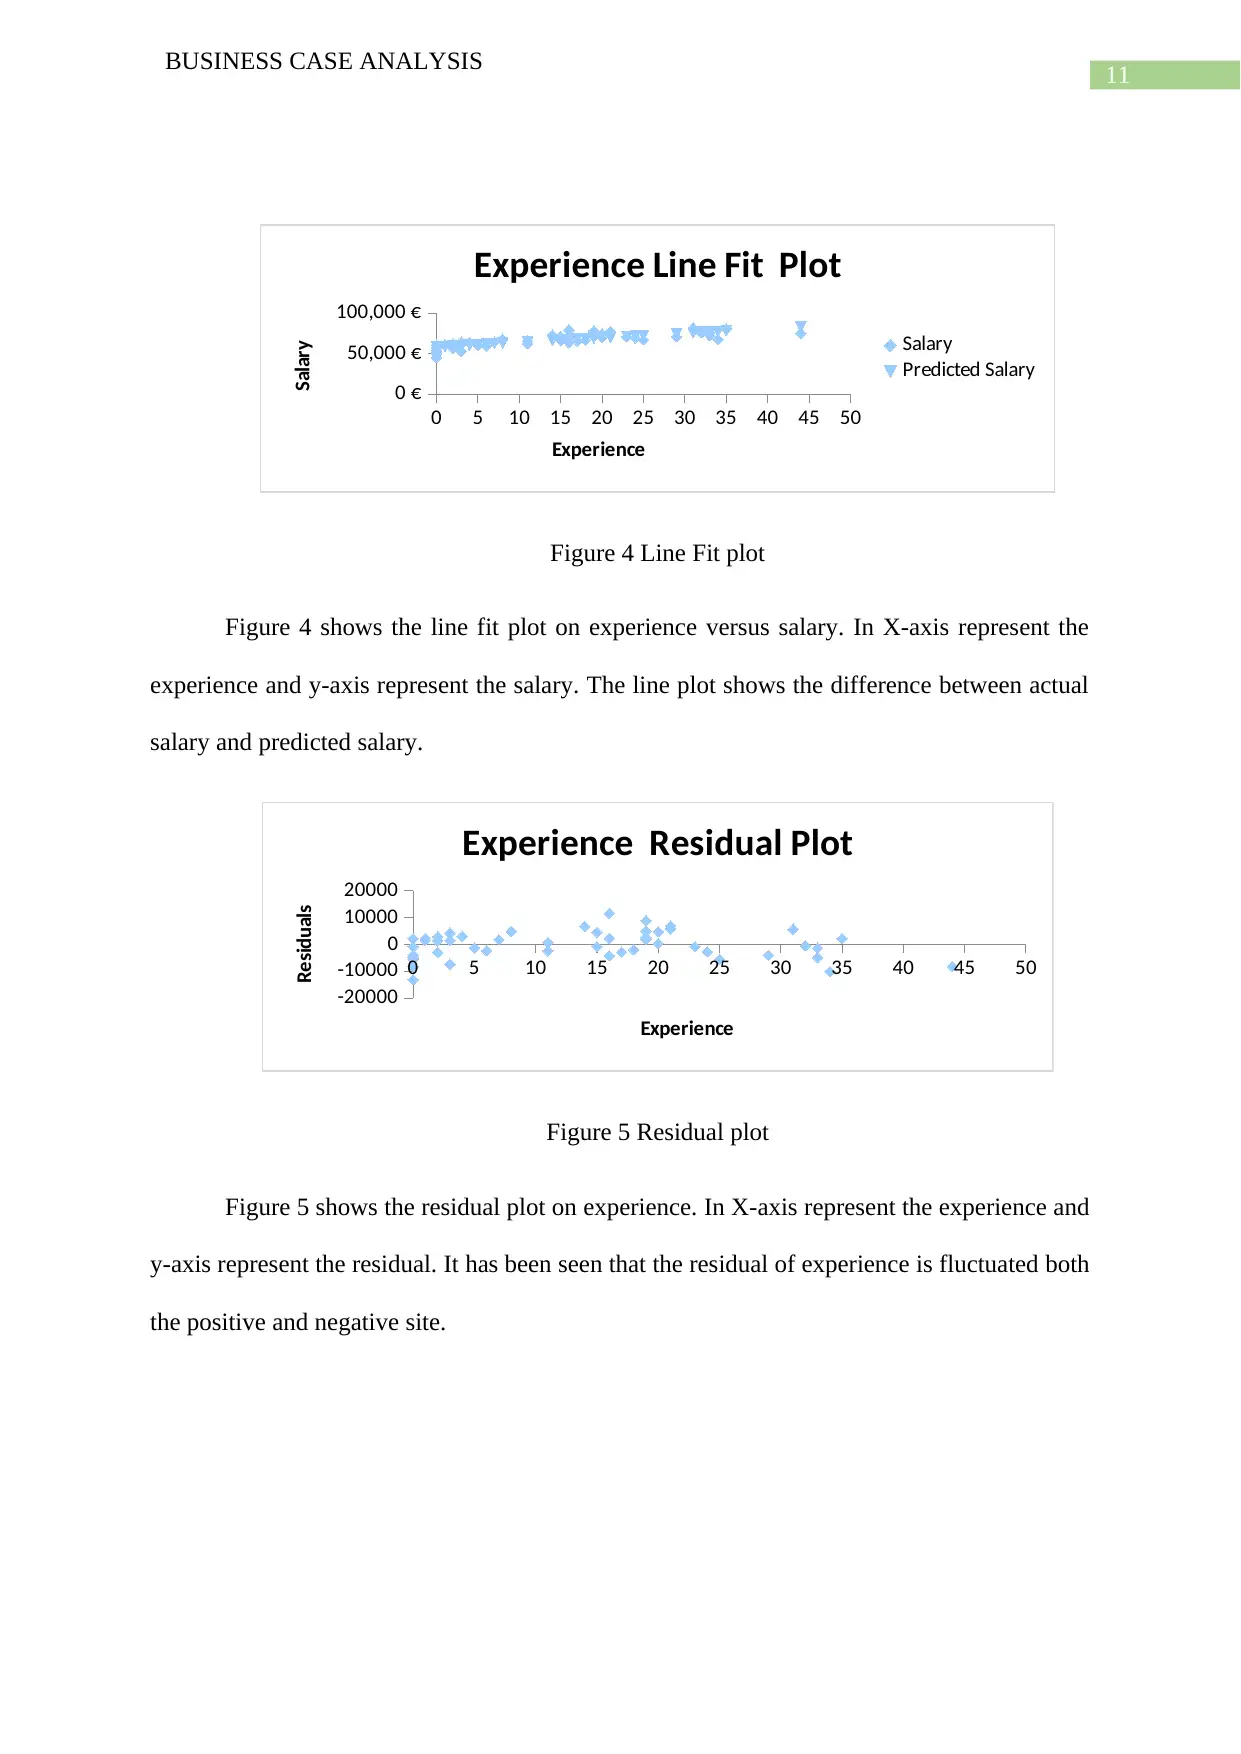
This report presents a business case analysis of salary discrimination at Vox Inc., a multinational company. The analysis, conducted using data visualization, descriptive statistics, and regression analysis, examines a sample of 50 employees to determine if significant differences exist between the salaries of men and women. The study explores the relationships between salary, gender, and experience, including the use of regression models to assess the impact of each variable. The findings indicate a positive correlation between gender and salary, and between experience and salary. The report concludes that experience and working expertise are the primary determinants of salary, and that gender is not a disadvantage. The analysis includes tables of descriptive statistics, histogram, scatter plots, and regression outputs to support the conclusions. The study also suggests improvements to the model by removing an insignificant variable and presents the final model.
Contribute Materials
Your contribution can guide someone’s learning journey. Share your
documents today.

Running head: BUSINESS CASE ANALYSIS
Business Case Analysis
Name of the Student:
Name of the University:
Author note:
Business Case Analysis
Name of the Student:
Name of the University:
Author note:
Secure Best Marks with AI Grader
Need help grading? Try our AI Grader for instant feedback on your assignments.

1
BUSINESS CASE ANALYSIS
Executive Summary
The study is based on data visualization, summary statistics and regression analysis. The
study shows the effect of experiences on salaries. There is a sample of 50 observations has
been taken in this study. In which 24 men and 26 are women. Moreover in inferential
statistics the co linearity has been cheeked. The residual plot, scatter plot and line plot shows
the relationship among these variables.

2
BUSINESS CASE ANALYSIS
Table of Contents
Executive Summary...................................................................................................................1
Introduction................................................................................................................................3
Data Visualization and Descriptive Statistics............................................................................4
Relationship between Salary and Gender..................................................................................7
Relationship between Experience and Gender...........................................................................8
Relationship between Salary and Experience............................................................................9
Relationship between Salary, gender and Experience.............................................................12
Improving the model................................................................................................................12
Conclusion................................................................................................................................14
Bibliography.............................................................................................................................15
Appendices...............................................................................................................................16

3
BUSINESS CASE ANALYSIS
Introduction
The study is based on data visualization, summary statistics and regression analysis.
The study shows the effect of experiences on salaries. There is a sample of 50 observations
has been taken in this study. In which 24 men and 26 are women. Moreover in inferential
statistics the co linearity has been cheeked. The histogram shows that the data of this study is
normal or skewed. There are 4 regression analysis has been done, in which one is multiple
regression.
Hypothesis:
To determine the difference on salaries among the gender.
To test the difference on salaries among the gender.
To test the differences on experiences among the gender.
To test the differences on experiences among the gender, experiences and salaries.
Moreover to cheek the multi co linearity.
Secure Best Marks with AI Grader
Need help grading? Try our AI Grader for instant feedback on your assignments.

4
BUSINESS CASE ANALYSIS
Data Visualization and Descriptive Statistics
Table 1 Descriptive Statistics on Employee’s Salary
Table 1 shows the descriptive statistics on salary among gender. It has been seen that
the mean salary of employees is 66624 €. The median salary of employee is 66750 €.
Similarly the mode salary of employees is 76400 €. Moreover the standard deviation of
salaries among all employees is 7375.049 €. The range and variance about employees salary
is 36400€ and 70141453€.

5
BUSINESS CASE ANALYSIS
Table 2 Descriptive Statistics on Employees experience
Table 2 shows the descriptive statistics on experience of employees. It has been seen
that the mean experience of employees is 13.9 years. The median experience of employee is
15 year. Similarly the mode experience of the employees is zero. Because the employees with
no experience has repeated. Moreover the standard deviation of experience of employees is
11.87. The range and variance about employees experience is 44 and 141.

6
BUSINESS CASE ANALYSIS
0 to 10 11 to 20 21 to 30 31 to 40 41 to 50
0
5
10
15
20
25
Histogram on Experiences
Class
Frequency
Figure 1 Histogram of experience
Figure 1 shows the histogram of experiences among the gender. In the X-axis
represent the class that is years of experience and Y-axis represent the frequency that is the
number of male employee. It has been seen that the most of the employee has a 0to 10 years’
experience. The lowest number of frequency has been seen on the 41 to 50 years’ category
Paraphrase This Document
Need a fresh take? Get an instant paraphrase of this document with our AI Paraphraser

7
BUSINESS CASE ANALYSIS
1
4
7
10
13
16
19
22
25
28
31
34
37
40
43
46
49
0 €
10,000 €
20,000 €
30,000 €
40,000 €
50,000 €
60,000 €
70,000 €
80,000 €
90,000 €
Graph on salary among Gender
Employee
Salary
Figure 2 graph of Salary among all employees
Figure 2 shows the line graph of salary among all the employee. The salary of the
employee is fluctuated 50,000 euros to 80,000. At some point it is more than 80,000 euros
and less than 50,000 euros. But as an average it is lies among this range.
Relationship between Salary and Gender

8
BUSINESS CASE ANALYSIS
Table 3 Regression output
The 95% confidence interval for slope is (68017.07, 73999.60) and for Gender is (-12579.55,
4282.27)
Null hypothesis: There is no difference on salaries among the gender.
Alternative hypothesis: There is a differences on salaries among the gender.
It has been seen from the regression analysis that the P-value (0.00) is less than alpha
(alpha = 0.05). Hence the null hypothesis is significant. Thus it may be summarized that there
is differences on salaries among the gender.
The correlation coefficient between the gender and salary is 0.51. It indicates that
there is a positive correlation between gender and salary.
Relationship between Experience and Gender
Table 4 Regression output
The 95% confidence interval for slope is (17.13, 25.12) and for gender is (-19.28, -
8.20)
Null hypothesis: There is no differences on experiences among the gender.

9
BUSINESS CASE ANALYSIS
Alternative hypothesis: There is a differences on experiences among the gender.
It has been seen from the regression analysis that the P-value (0.00) is less than alpha
(alpha = 0.05). Hence the null hypothesis is significant. Thus it may be summarized that there
is a differences on experiences among the gender.
The correlation coefficient between the gender and experiences is 0.58. It indicates
that there is a positive correlation between gender and experiences.
It has been seen that the salary is related to gender and experience is also related to
gender. Thus gender related to both experience and salary.
Relationship between Salary and Experience
0 5 10 15 20 25 30 35 40 45 50
0 €
10,000 €
20,000 €
30,000 €
40,000 €
50,000 €
60,000 €
70,000 €
80,000 €
90,000 €
f(x) = 566.469145952079 x + 58704.7613395899
R² = 0.645053323084314
Scatter Plot on Salary versus Experience
Years of Experience
Salary
Figure 3 Scatter Plot on Salary versus Experiences
The scatter plot shows the relationship between salary and years of experience. In X-
axis represent the years of experience and Y-axis represent the salary. It has been seen that
there is a strong and positive relationship exist between these two variables.
The correlation between salary and experience is 0.80.
Secure Best Marks with AI Grader
Need help grading? Try our AI Grader for instant feedback on your assignments.

10
BUSINESS CASE ANALYSIS
Table 5 Regression output
The regression model is as below
Salary = 58704.76+566.47* Experience
The adjusted r-square is 0.64 which is slightly higher than the r-square that is
coefficient of determination.
For intercept,
T- Statistic = 52.99
P-value = 0.00
For Experience,
T-statistic = 9.34
P-value = 0.00
It has been seen that on both the intercept and experience has a lower P-value as
compared to alpha at 5%. Hence both the intercept and experience is significant.

11
BUSINESS CASE ANALYSIS
0 5 10 15 20 25 30 35 40 45 50
0 €
50,000 €
100,000 €
Experience Line Fit Plot
Salary
Predicted Salary
Experience
Salary
Figure 4 Line Fit plot
Figure 4 shows the line fit plot on experience versus salary. In X-axis represent the
experience and y-axis represent the salary. The line plot shows the difference between actual
salary and predicted salary.
0 5 10 15 20 25 30 35 40 45 50
-20000
-10000
0
10000
20000
Experience Residual Plot
Experience
Residuals
Figure 5 Residual plot
Figure 5 shows the residual plot on experience. In X-axis represent the experience and
y-axis represent the residual. It has been seen that the residual of experience is fluctuated both
the positive and negative site.

12
BUSINESS CASE ANALYSIS
Relationship between Salary, gender and Experience
Table 6 Regression output
The regression model becomes
Salary = 59557.19 + (-983.22) *gender + 542.07 * experience
It has been seen from this output (6) that there is two independent variables. These are
gender and experience. The variable experience is significant, because their P-value is
smaller than the alpha at 5%. But at the same time the variable gender is not significant,
because their P-value higher than the alpha at 5%. Hence the variable gender may be omitted
and produce a new regression model. The correlation coefficient is 0.8.
From all of the model it has been summarized that the model salary versus experience
is the best and strong fitted model.
Improving the model
After reducing the gender independent variable the regression model becomes
Salary = 58704.76+566.47* Experience (output 5)
After removing the insignificant variable the produced new regression model is a
better and strong model.
Paraphrase This Document
Need a fresh take? Get an instant paraphrase of this document with our AI Paraphraser

13
BUSINESS CASE ANALYSIS
Yes, higher experiences gives higher salary. In this model taking as example. If taking
the values experiences is equal to 26 and28 and again put experience is equal to 2 and 4.
Then it has been seen that higher experiences gives higher salary.
No gender is not a disadvantage of salary. The salary is depends upon experiences and
quality of working and expertise. In today’s world male and female all are equal in working
and every purpose. Hence it may be concluded that salary is depends upon experience and
working expertise and quality, gender is not disadvantage.

14
BUSINESS CASE ANALYSIS
Conclusion
The study is based on data visualization, summary statistics and regression analysis.
The study shows that is there any significant difference between the salaries of men and
women. The following points has been concluded in this study.
The mean salary of employees is 66624 €. The median salary of employee is
66750 €. Similarly the mode salary of employees is 76400 €. Moreover the
standard deviation of salaries among all employees is 7375.049 €.
The mean experience of employees is 13.9 years and the median experience is
15 years.
It has been seen that the most of the male employee has 11 to 20 years’
experience. Similarly the most of the female employee has 0 to 5 years’
experience.
There is differences on salaries among the gender. The correlation coefficient
between the gender and salary is 0.51.
Among all the regression model it is clear that salary versus experience model
is the best model.
Hence it may be concluded that salary is depends upon experience and
working expertise and quality, gender is not disadvantage.

15
BUSINESS CASE ANALYSIS
Bibliography
Chatterjee, S. and Hadi, A.S., 2015. Regression analysis by example. John Wiley & Sons.
Fox, J., 2015. Applied regression analysis and generalized linear models. Sage Publications.
Kleinbaum, D.G., Kupper, L.L., Nizam, A. and Rosenberg, E.S., 2013. Applied regression
analysis and other multivariable methods. Nelson Education.
Plonsky, L., 2015. Statistical power, p values, descriptive statistics, and effect sizes: A “back-
to-basics” approach to advancing quantitative methods in L2 research. In Advancing
quantitative methods in second language research (pp. 23-45). Routledge.
Thiem, A., 2014. Membership function sensitivity of descriptive statistics in fuzzy-set
relations. International Journal of Social Research Methodology, 17(6), pp.625-642.
Secure Best Marks with AI Grader
Need help grading? Try our AI Grader for instant feedback on your assignments.

16
BUSINESS CASE ANALYSIS
Appendices
Table 1 Descriptive Statistics on Employee’s Salary
Table 2 Descriptive Statistics on Employees experience
BUSINESS CASE ANALYSIS
Appendices
Table 1 Descriptive Statistics on Employee’s Salary
Table 2 Descriptive Statistics on Employees experience

17
BUSINESS CASE ANALYSIS
Table 3 Regression output
Table 4 Regression output
BUSINESS CASE ANALYSIS
Table 3 Regression output
Table 4 Regression output

18
BUSINESS CASE ANALYSIS
Table 5 Regression output
Table 6 Regression output
0 to 10 11 to 20 21 to 30 31 to 40 41 to 50
0
5
10
15
20
25
Histogram on Experiences
Class
Frequency
Figure 1 Histogram of experiences among Gender
BUSINESS CASE ANALYSIS
Table 5 Regression output
Table 6 Regression output
0 to 10 11 to 20 21 to 30 31 to 40 41 to 50
0
5
10
15
20
25
Histogram on Experiences
Class
Frequency
Figure 1 Histogram of experiences among Gender
Paraphrase This Document
Need a fresh take? Get an instant paraphrase of this document with our AI Paraphraser

19
BUSINESS CASE ANALYSIS
1
4
7
10
13
16
19
22
25
28
31
34
37
40
43
46
49
0 €
10,000 €
20,000 €
30,000 €
40,000 €
50,000 €
60,000 €
70,000 €
80,000 €
90,000 €
Graph on salary among Gender
Employee
Salary
Figure 2 graph of Salary among all employees
0 5 10 15 20 25 30 35 40 45 50
0 €
10,000 €
20,000 €
30,000 €
40,000 €
50,000 €
60,000 €
70,000 €
80,000 €
90,000 €
f(x) = 566.469145952079 x + 58704.7613395899
R² = 0.645053323084314
Scatter Plot on Salary versus Experience
Years of Experience
Salary
Figure 3 Scatter Plot on Salary versus Experiences

20
BUSINESS CASE ANALYSIS
0 5 10 15 20 25 30 35 40 45 50
0 €
50,000 €
100,000 €
Experience Line Fit Plot
Salary
Predicted Salary
Experience
Salary
Figure 4 Line Fit plot
0 5 10 15 20 25 30 35 40 45 50
-20000
-10000
0
10000
20000
Experience Residual Plot
Experience
Residuals
Figure 5 Residual plot
BUSINESS CASE ANALYSIS
0 5 10 15 20 25 30 35 40 45 50
0 €
50,000 €
100,000 €
Experience Line Fit Plot
Salary
Predicted Salary
Experience
Salary
Figure 4 Line Fit plot
0 5 10 15 20 25 30 35 40 45 50
-20000
-10000
0
10000
20000
Experience Residual Plot
Experience
Residuals
Figure 5 Residual plot
1 out of 21
Related Documents

Your All-in-One AI-Powered Toolkit for Academic Success.
+13062052269
info@desklib.com
Available 24*7 on WhatsApp / Email
Unlock your academic potential
© 2024 | Zucol Services PVT LTD | All rights reserved.