Financial Performance Evaluation: A Comparative Study of VS & SKP
VerifiedAdded on 2023/06/09
|26
|4450
|468
Report
AI Summary
This report provides a detailed financial analysis comparing V.S. Industry Berhad (VS) and SKP Resources Berhad over five years (2013-2017). It utilizes various financial ratios, including profitability, liquidity, efficiency, solvency, and investor ratios, to assess and compare their financial performance. The analysis identifies strategic and operational issues for both companies, offering recommendations for improvement. Key findings include fluctuating profitability trends, varying liquidity positions, and efficiency differences in inventory management. The report also addresses the limitations of ratio analysis and provides suggestions for a more comprehensive evaluation. Desklib offers this report as a resource for students, alongside a wide array of study tools, solved assignments, and past papers.
Running head: FINANCIAL ANALYSIS
Financial analysis
Name of the student
Name of the university
Student ID
Author note
Financial analysis
Name of the student
Name of the university
Student ID
Author note
Paraphrase This Document
Need a fresh take? Get an instant paraphrase of this document with our AI Paraphraser
1FINANCIAL ANALYSIS
Table of Contents
1.0 Introduction..........................................................................................................................4
2.0 Background of v.s. industry Berhad (vs).............................................................................5
2.1 Nature of core business....................................................................................................5
2.2 Future Outlook.................................................................................................................5
2.3 Key Challenges................................................................................................................5
3.0 Relative position in the industry..........................................................................................6
4.0 Ratios analysis of financial performance of VS vs SKP......................................................6
4.1 Background to ratio analysis............................................................................................6
4.2 Rationale for selecting VS and SKP for comparison.......................................................7
4.3 Profitability Analysis.......................................................................................................7
4.3.1 Background...................................................................................................................7
4.3.2 Table of Profitability ratios...........................................................................................8
4.3.3 Line Graph....................................................................................................................8
4.3.4 Interpretation...............................................................................................................10
4.4 Liquidity Analysis..........................................................................................................11
4.4.1 Background.................................................................................................................11
4.4.2 Table of Liquidity Analysis....................................................................................11
4.4.3 Line Graph..................................................................................................................12
4.4.4 Interpretations.............................................................................................................12
2FINANCIAL ANALYSIS
4.5 Efficiency Analysis........................................................................................................13
4.5.1 Background.................................................................................................................13
4.5.2 Table of Efficiency Ratio............................................................................................13
4.5.3 Line Graph..................................................................................................................14
4.5.4 Interpretation...............................................................................................................15
4.6 Solvency Analysis..........................................................................................................16
4.6.1 Background.................................................................................................................16
4.6.2 Table of Solvency ratios...........................................................................................16
4.6.3 Line Graph..................................................................................................................17
4.6.4 Interpretation...............................................................................................................17
4.7 Investors Analysis..........................................................................................................18
4.7.1 Background.................................................................................................................18
4.7.2 Table of Investors Ratios............................................................................................19
4.7.3 Line Graph..................................................................................................................19
4.7.4 Interpretation...............................................................................................................21
5.0 Identification of strategic and operational issues and recommendations...........................22
5.1 Profitability....................................................................................................................22
5.1.1 Strategic issue..............................................................................................................22
5.1.2 Recommendation.........................................................................................................22
5.2 Gearing strategy.............................................................................................................22
5.2.1 Problem.......................................................................................................................22
⊘ This is a preview!⊘
Do you want full access?
Subscribe today to unlock all pages.
Trusted by 1+ million students worldwide
3FINANCIAL ANALYSIS
5.2.3 Recommendation.........................................................................................................22
6.0 Limitation analysis.............................................................................................................23
6.1 Limitation of ratio analysis............................................................................................23
6.2 Recommendation............................................................................................................23
Reference..................................................................................................................................24
Paraphrase This Document
Need a fresh take? Get an instant paraphrase of this document with our AI Paraphraser
4FINANCIAL ANALYSIS
1.0 Introduction
Main objective of the report is to focus on the financial performance and position of
V.S. Industry Berhad (VS) agisnt SKP Resources Berhad (SKP) for the last 5 years that is
from 2013 to 2017. For the purpose of analysis various ratios like profitability ratios, liquidity
ratios, efficiency ratios, solvency ratios and investor’s ratios. Further, the report will identify
the operational and strategic issues of both the companies and will provide recommendations
based on the findings. Finally, the report will provide the limitations of ratio analysis.
V.S. Industry Berhad is the Malaysian company that operates under electronic
components sector. It is an investment holding company that assembles, manufactures and
sells the electrical and electronic products, plastic molded parts and components in Malaysia,
Europe, Indonesia and various other countries. Various manufacturing solutions provided by
the company includes mold design, fabrication services, product design, electronics, final
assembly, testing and services related to supply chain management (Vs-i.com 2018).
On the other hand, SKP Resources Berhad is the investment holding company and is
engaged in delivering management services to the subsidiaries. Further, the company is
engaged in sub-assembly of electrical and electronic equipments and various other secondary
processes. It offers wide range of products that includes video accessories, computer
accessories, audio accessories and various other miscellaneous accessories (Skpres.com
2018).
5FINANCIAL ANALYSIS
2.0 Background of v.s. industry Berhad (vs)
V.S. Industry Berhad (VS) was founded in 1982 and listed on the Main Market of
Stock Exchange Malaysia in 1998. VS has been classified in the Industrial Products sector.
2.1 Nature of core business
The company’s principal activities are manufacturing, assembling and sale of
electronic and electrical products and plastic moulded components and parts such as speakers
and remote controls. It also markets, distributes, and sells plastic household products. VS also
operates a palm oil plantation. Geographically the company is spread across Malaysia, United
States of America, Europe, Indonesia and Taiwan.
2.2 Future Outlook
VS is a global leader in integrated Electronics Manufacturing Services (EMS) for
office and household electrical and electronic products. In the EMS sector, the rapid pace of
globalization and technological adoptions, as well as innovation-led product replacements,
are expected to fuel growth in manufacturing activity. Increasing collaboration between brand
owners and manufacturing partners in crucial phases of product development and delivery
will be ongoing. Therefore, EMS players with in-house R&D as well as integrated global
supply chain expertise, are well-positioned to gain an upper hand.
2.3 Key Challenges
Operating environment remains challenging such as rising cost of materials,
escalating wages and utility costs, fluctuation in currency exchange, juggling human
resources especially on the production floors and talent engineer. Also, balancing between
costs down pressures from customers and managing upward cost increase remain as key
challenge.
⊘ This is a preview!⊘
Do you want full access?
Subscribe today to unlock all pages.
Trusted by 1+ million students worldwide
6FINANCIAL ANALYSIS
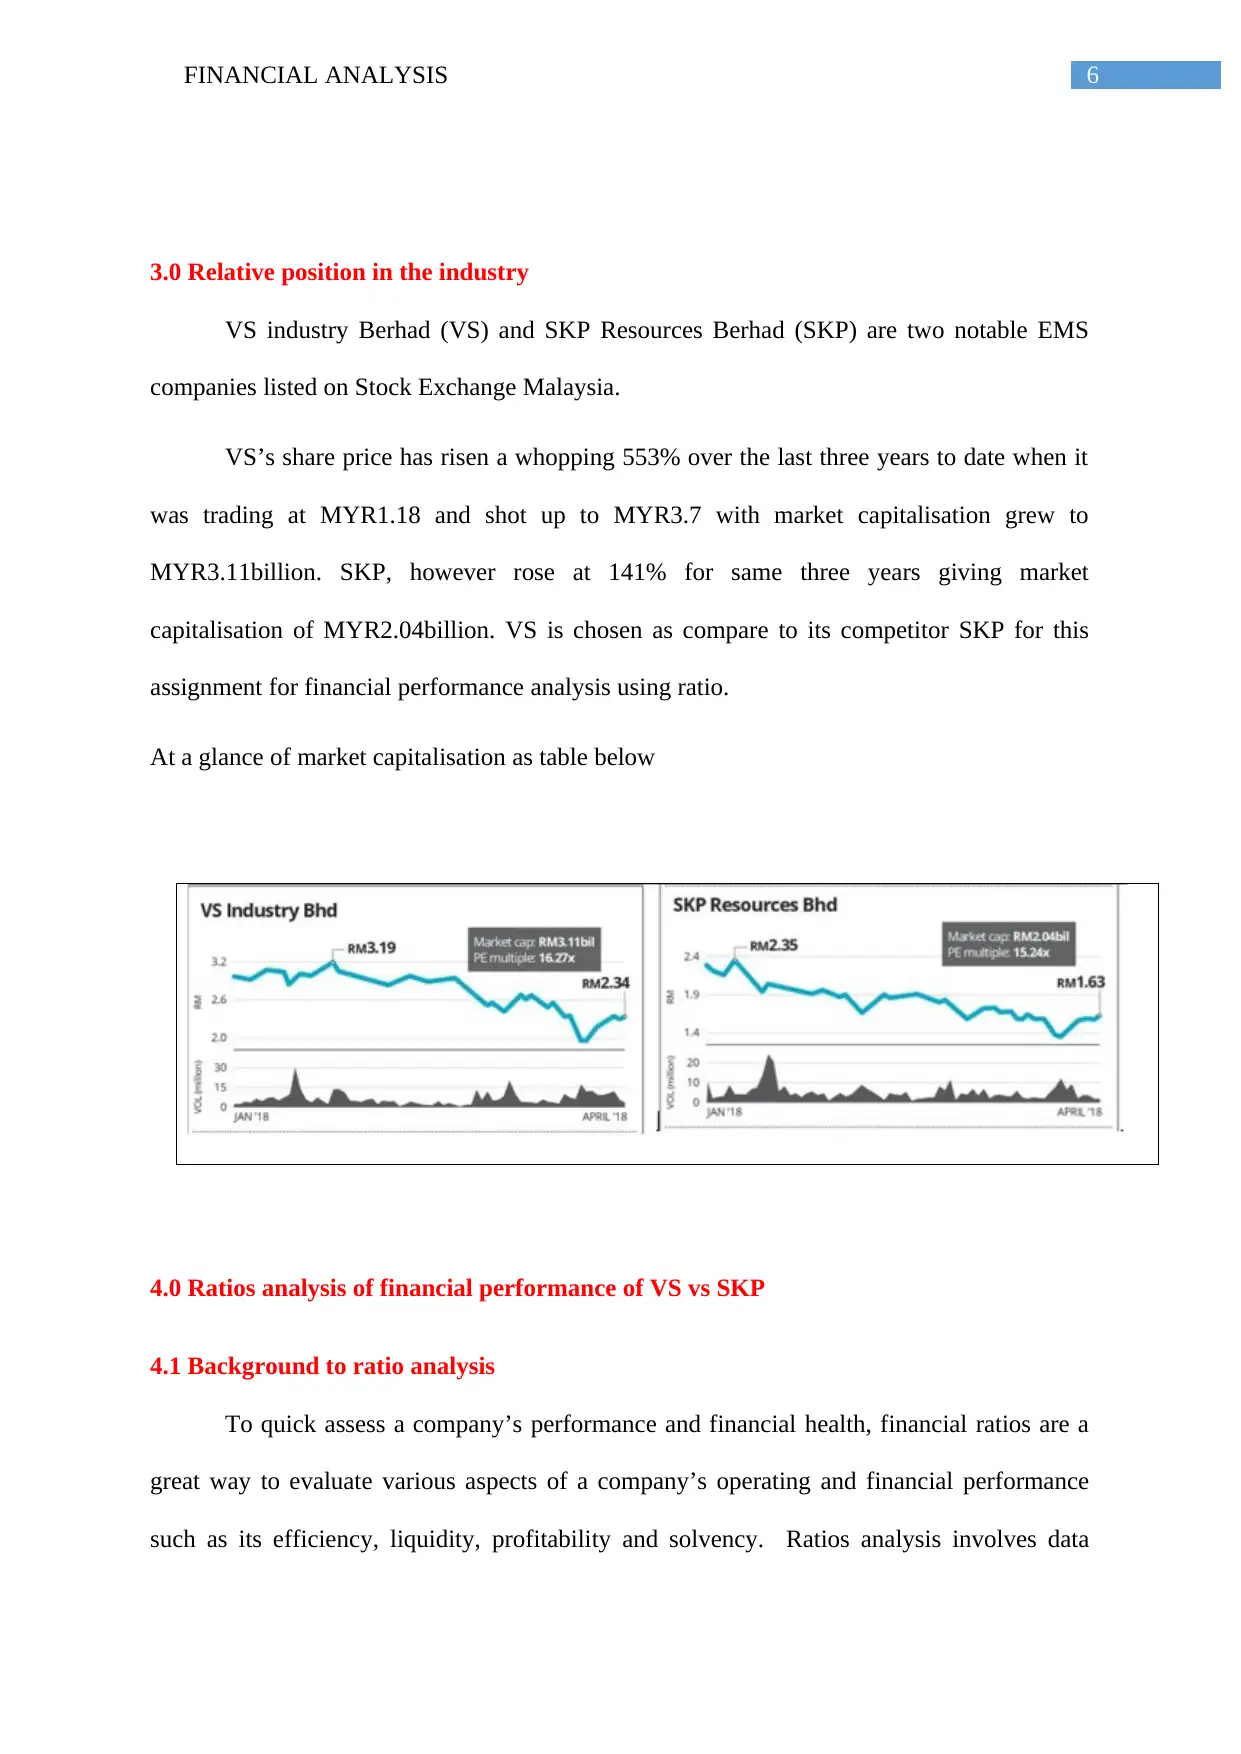
3.0 Relative position in the industry
VS industry Berhad (VS) and SKP Resources Berhad (SKP) are two notable EMS
companies listed on Stock Exchange Malaysia.
VS’s share price has risen a whopping 553% over the last three years to date when it
was trading at MYR1.18 and shot up to MYR3.7 with market capitalisation grew to
MYR3.11billion. SKP, however rose at 141% for same three years giving market
capitalisation of MYR2.04billion. VS is chosen as compare to its competitor SKP for this
assignment for financial performance analysis using ratio.
At a glance of market capitalisation as table below
4.0 Ratios analysis of financial performance of VS vs SKP
4.1 Background to ratio analysis
To quick assess a company’s performance and financial health, financial ratios are a
great way to evaluate various aspects of a company’s operating and financial performance
such as its efficiency, liquidity, profitability and solvency. Ratios analysis involves data
Paraphrase This Document
Need a fresh take? Get an instant paraphrase of this document with our AI Paraphraser
7FINANCIAL ANALYSIS
retrieved from current and historical financial statements to access whether the company is
improving or deteriorating; or can be used to judge a company’s performance against other at
similarly-situated companies.
4.2 Rationale for selecting VS and SKP for comparison
VS is one of the top 50 EMS corporation in the world, with in-house printed circuit
board (PCB) and battery-pack assembly capabilities to provide one-stop manufacturing
solution to its clients. SKP is one of the fastest-growing integrated contract manufacturers,
catering for the electrical and electronics, industrials, automotive and food & beverage
industries. It also has better manufacturing capabilities. SKP’s in-house assembly capability
is coming in place, rivalling that of VS. Both companies delivered strong financial
performance in the past 3-5 financial years. Simply put, they are friendly competitors.
4.3 Profitability Analysis
4.3.1 Background
All the entities are concerned regarding their profitability and the profitability of the
company are analysed through various profitability ratios like net profit margin, gross profit
margin, return on assets and return on equity. These ratios state the ability of the company to
transform its sales into profit at different measurement stages. Further the return ratios
indicate the ability of the company to measure its overall efficiencies with regard to
generation of returns for the shareholders (Vogel 2014).
8FINANCIAL ANALYSIS
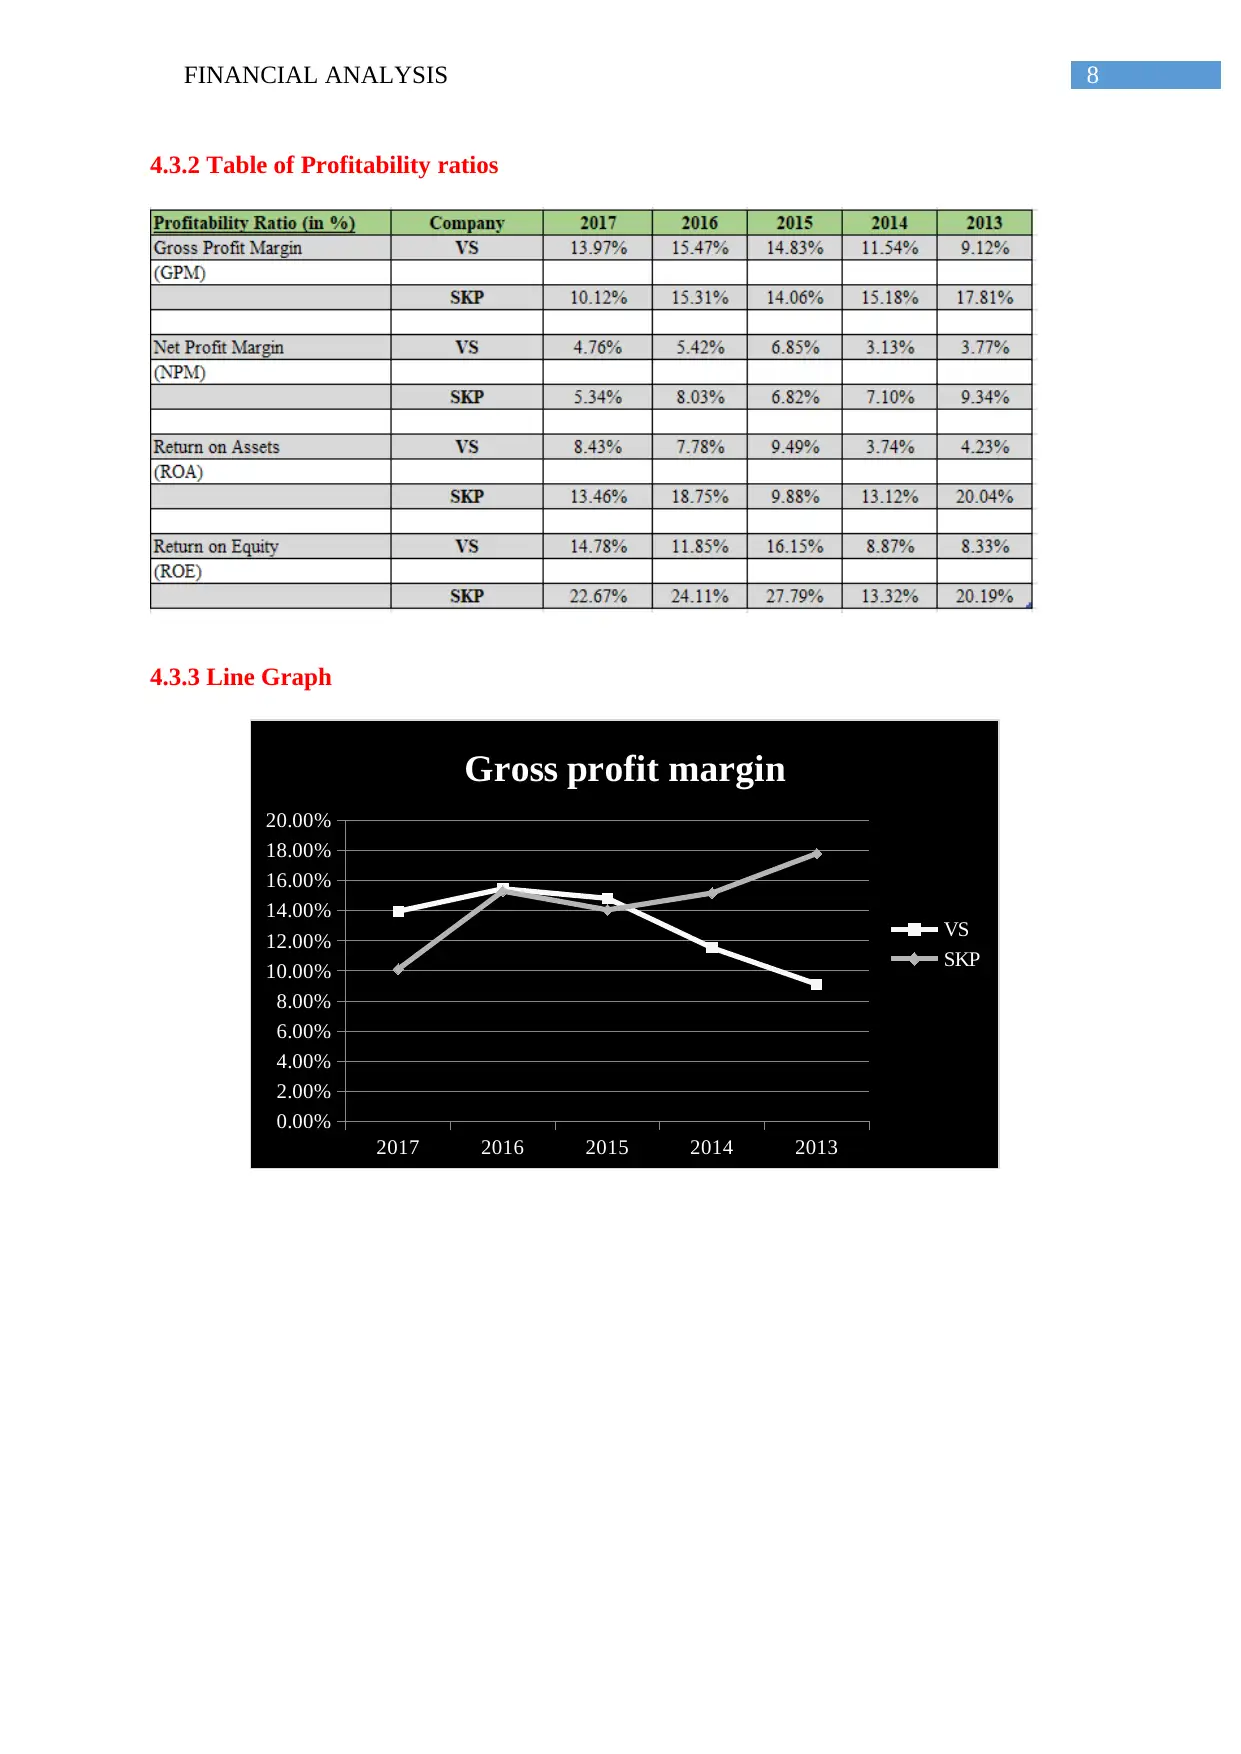
4.3.2 Table of Profitability ratios
4.3.3 Line Graph
2017 2016 2015 2014 2013
0.00%
2.00%
4.00%
6.00%
8.00%
10.00%
12.00%
14.00%
16.00%
18.00%
20.00%
Gross profit margin
VS
SKP
4.3.2 Table of Profitability ratios
4.3.3 Line Graph
2017 2016 2015 2014 2013
0.00%
2.00%
4.00%
6.00%
8.00%
10.00%
12.00%
14.00%
16.00%
18.00%
20.00%
Gross profit margin
VS
SKP
⊘ This is a preview!⊘
Do you want full access?
Subscribe today to unlock all pages.
Trusted by 1+ million students worldwide
9FINANCIAL ANALYSIS
2017 2016 2015 2014 2013
0.00%
1.00%
2.00%
3.00%
4.00%
5.00%
6.00%
7.00%
8.00%
9.00%
10.00%
Net profit margin
VS
SKP
2017 2016 2015 2014 2013
0.00%
5.00%
10.00%
15.00%
20.00%
25.00%
Return on Asset
VS
SKP
2017 2016 2015 2014 2013
0.00%
5.00%
10.00%
15.00%
20.00%
25.00%
30.00%
Return on equity
VS
SKP
2017 2016 2015 2014 2013
0.00%
1.00%
2.00%
3.00%
4.00%
5.00%
6.00%
7.00%
8.00%
9.00%
10.00%
Net profit margin
VS
SKP
2017 2016 2015 2014 2013
0.00%
5.00%
10.00%
15.00%
20.00%
25.00%
Return on Asset
VS
SKP
2017 2016 2015 2014 2013
0.00%
5.00%
10.00%
15.00%
20.00%
25.00%
30.00%
Return on equity
VS
SKP
Paraphrase This Document
Need a fresh take? Get an instant paraphrase of this document with our AI Paraphraser
10FINANCIAL ANALYSIS
4.3.4 Interpretation
Gross profit margin of the company is the profitability metrics that is used for
assessing the financial health of the company through measuring the percentage of revenue
left with the company after paying off the cost for goods sold. If the company does not
possess sufficient gross margin it will not be able to meet its operational expenses efficiently.
Looking into the gross profit margin of VS as well as SKP it can be identified that the till
2016 the ratio for VS is in increasing trend and in 2017 it reduced to 13.97% from 15.47%.
On the other hand, the gross margin of SKP till 2015 was in reducing trend. However, it 2016
it increased from 14.06% to 15.31% and again reduced to 10.12% in 2017 (Sarlin 2015).
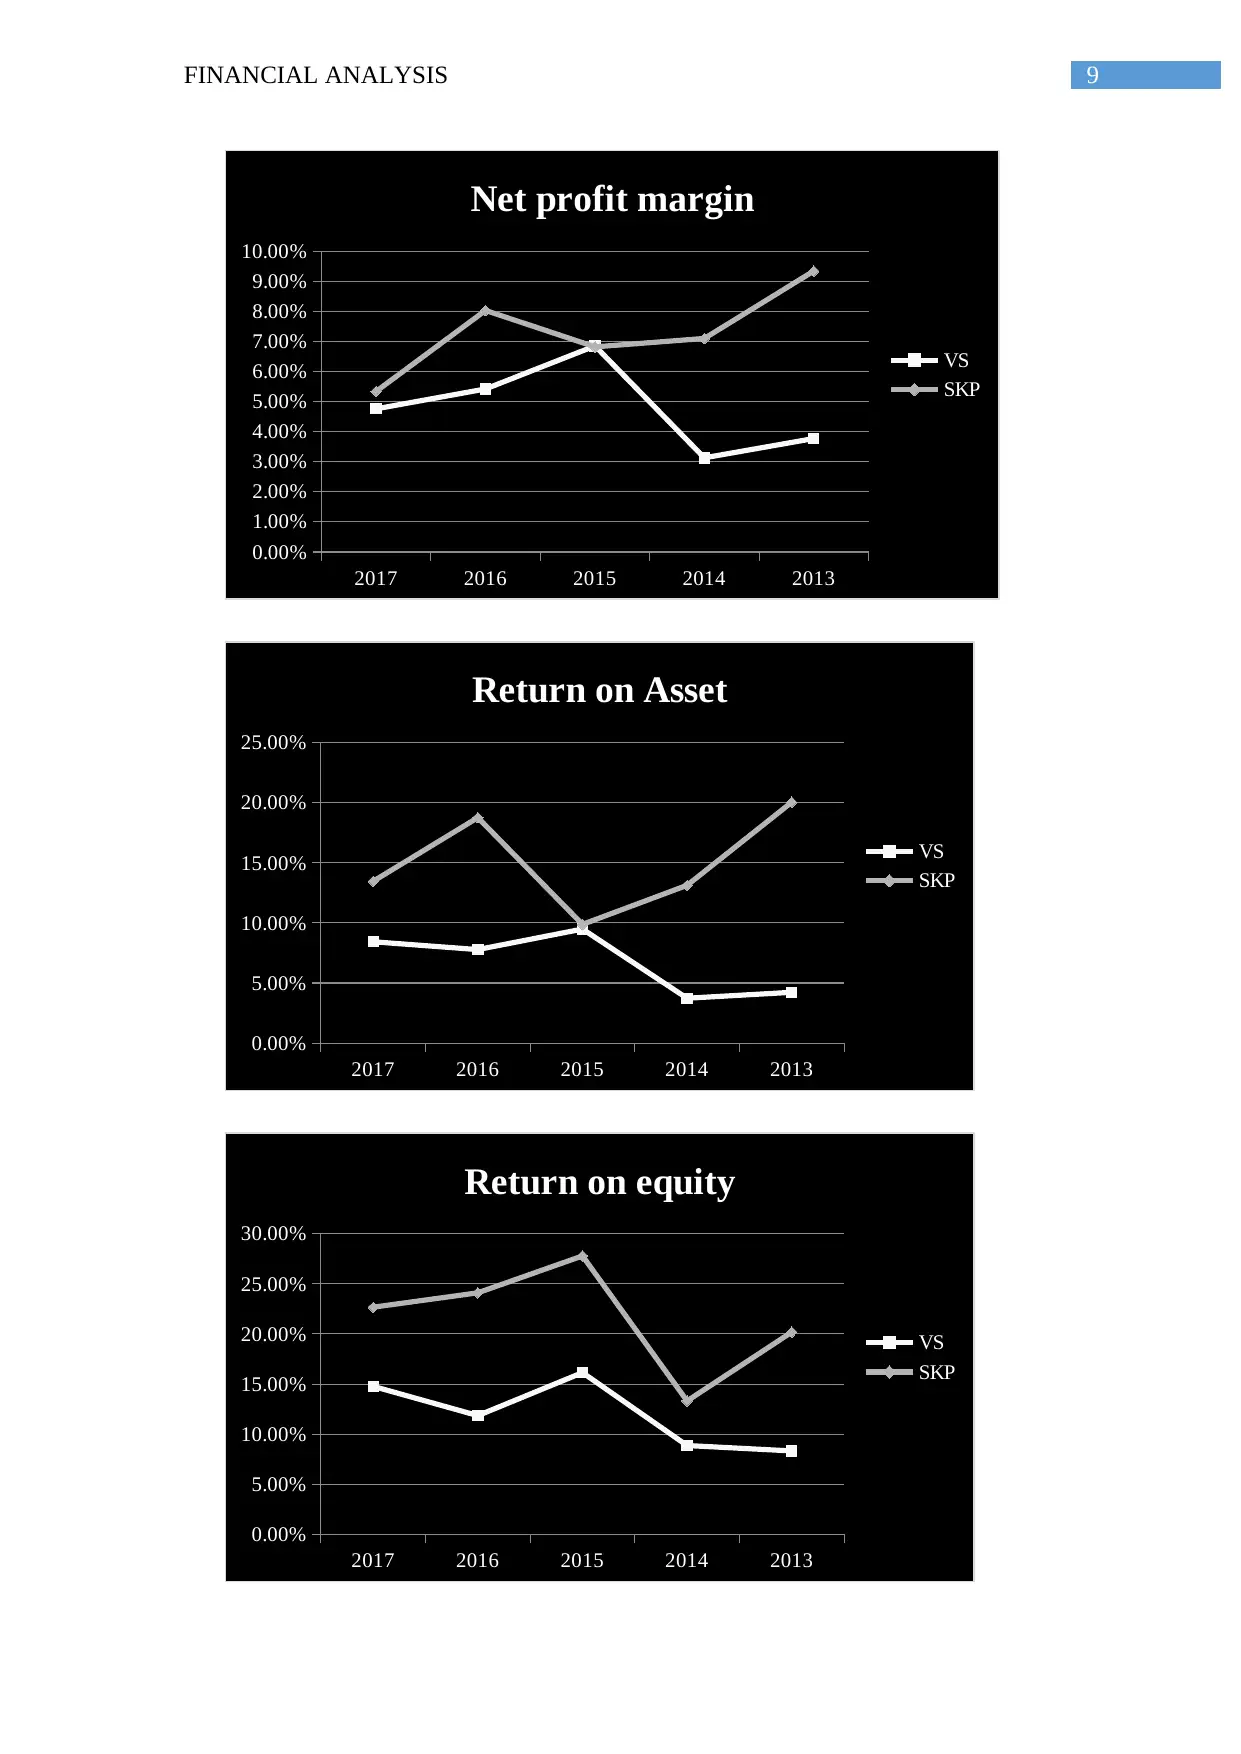
The net profit margin of the company is the profitability metrics that is used for
assessing the financial health of the company through measuring the percentage of revenue
left with the company after paying off all the operating expenses including the financial
expenses and tax expenses. Looking into the net profit margin of both the companies it can be
stated that the net profit of both the companies are fluctuating and have no particular trend.
Whereas the net profit of VS has increased from 3.77% to 4.76%, the net profit margin of
SKP has been reduced from 9.34% to 5.34% over the last 5 year period. However, the net
profitability position of SKP is better as compared to that of VS.
Return on assets indicates the profitability of the company as against its total assets. It
measures the ability of the company to generate income through deploying its assets. It can
be identified that the return on assets of VS is in increasing trend and it increased from 4.23%
to 8.43% over the last 5 years. On the other hand, the return on assets for SKP is in reducing
trend and it reduced to 13.46% from 20.04%. However, if both the companies are compared
4.3.4 Interpretation
Gross profit margin of the company is the profitability metrics that is used for
assessing the financial health of the company through measuring the percentage of revenue
left with the company after paying off the cost for goods sold. If the company does not
possess sufficient gross margin it will not be able to meet its operational expenses efficiently.
Looking into the gross profit margin of VS as well as SKP it can be identified that the till
2016 the ratio for VS is in increasing trend and in 2017 it reduced to 13.97% from 15.47%.
On the other hand, the gross margin of SKP till 2015 was in reducing trend. However, it 2016
it increased from 14.06% to 15.31% and again reduced to 10.12% in 2017 (Sarlin 2015).
The net profit margin of the company is the profitability metrics that is used for
assessing the financial health of the company through measuring the percentage of revenue
left with the company after paying off all the operating expenses including the financial
expenses and tax expenses. Looking into the net profit margin of both the companies it can be
stated that the net profit of both the companies are fluctuating and have no particular trend.
Whereas the net profit of VS has increased from 3.77% to 4.76%, the net profit margin of
SKP has been reduced from 9.34% to 5.34% over the last 5 year period. However, the net
profitability position of SKP is better as compared to that of VS.
Return on assets indicates the profitability of the company as against its total assets. It
measures the ability of the company to generate income through deploying its assets. It can
be identified that the return on assets of VS is in increasing trend and it increased from 4.23%
to 8.43% over the last 5 years. On the other hand, the return on assets for SKP is in reducing
trend and it reduced to 13.46% from 20.04%. However, if both the companies are compared
11FINANCIAL ANALYSIS
it can be stated that the performance of SKP is better as compared to VS (Heikal, Khaddafi
and Ummah 2014).
Return on equity measures the ability of the company to generate income through
deploying its shareholder’s equity. It can be recognized that both the company’s return on
equity are in increasing trend. Whereas the ROE of VS has increased from 8.33% to 14.78%,
the return on equity of SKP has been increased from 20.19% to 22.67% over the last 5 year
period. However, if both the companies are compared it can be stated that the performance of
SKP is better as compared to VS.
4.4 Liquidity Analysis
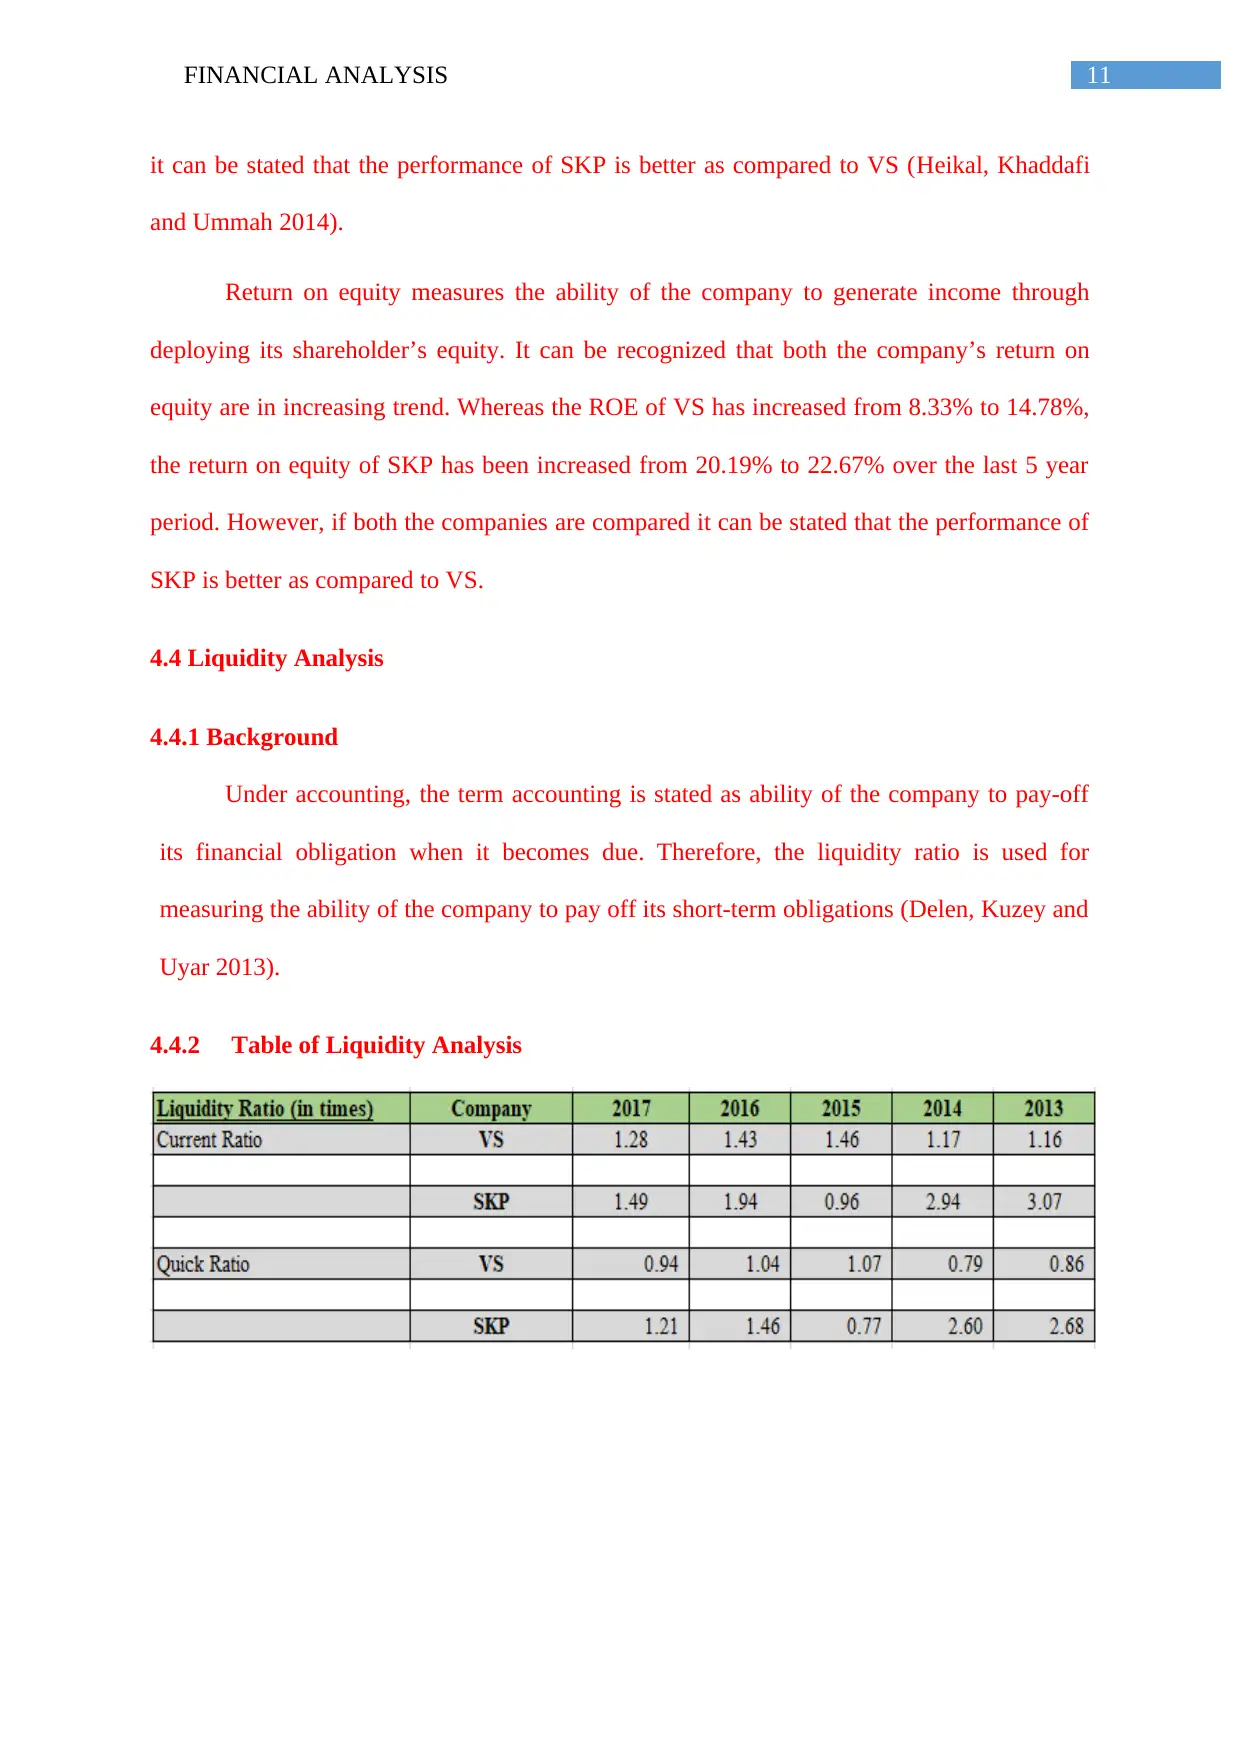
4.4.1 Background
Under accounting, the term accounting is stated as ability of the company to pay-off
its financial obligation when it becomes due. Therefore, the liquidity ratio is used for
measuring the ability of the company to pay off its short-term obligations (Delen, Kuzey and
Uyar 2013).
4.4.2 Table of Liquidity Analysis
it can be stated that the performance of SKP is better as compared to VS (Heikal, Khaddafi
and Ummah 2014).
Return on equity measures the ability of the company to generate income through
deploying its shareholder’s equity. It can be recognized that both the company’s return on
equity are in increasing trend. Whereas the ROE of VS has increased from 8.33% to 14.78%,
the return on equity of SKP has been increased from 20.19% to 22.67% over the last 5 year
period. However, if both the companies are compared it can be stated that the performance of
SKP is better as compared to VS.
4.4 Liquidity Analysis
4.4.1 Background
Under accounting, the term accounting is stated as ability of the company to pay-off
its financial obligation when it becomes due. Therefore, the liquidity ratio is used for
measuring the ability of the company to pay off its short-term obligations (Delen, Kuzey and
Uyar 2013).
4.4.2 Table of Liquidity Analysis
⊘ This is a preview!⊘
Do you want full access?
Subscribe today to unlock all pages.
Trusted by 1+ million students worldwide
1 out of 26
Related Documents


Your All-in-One AI-Powered Toolkit for Academic Success.
+13062052269
info@desklib.com
Available 24*7 on WhatsApp / Email
![[object Object]](/_next/static/media/star-bottom.7253800d.svg)
Unlock your academic potential
Copyright © 2020–2026 A2Z Services. All Rights Reserved. Developed and managed by ZUCOL.