VU Business School BAO2203: Retail Food Group (RFG) Financial Report

Verified

Added on  2022/11/18

|7
|1624
|211
Report
AI Summary
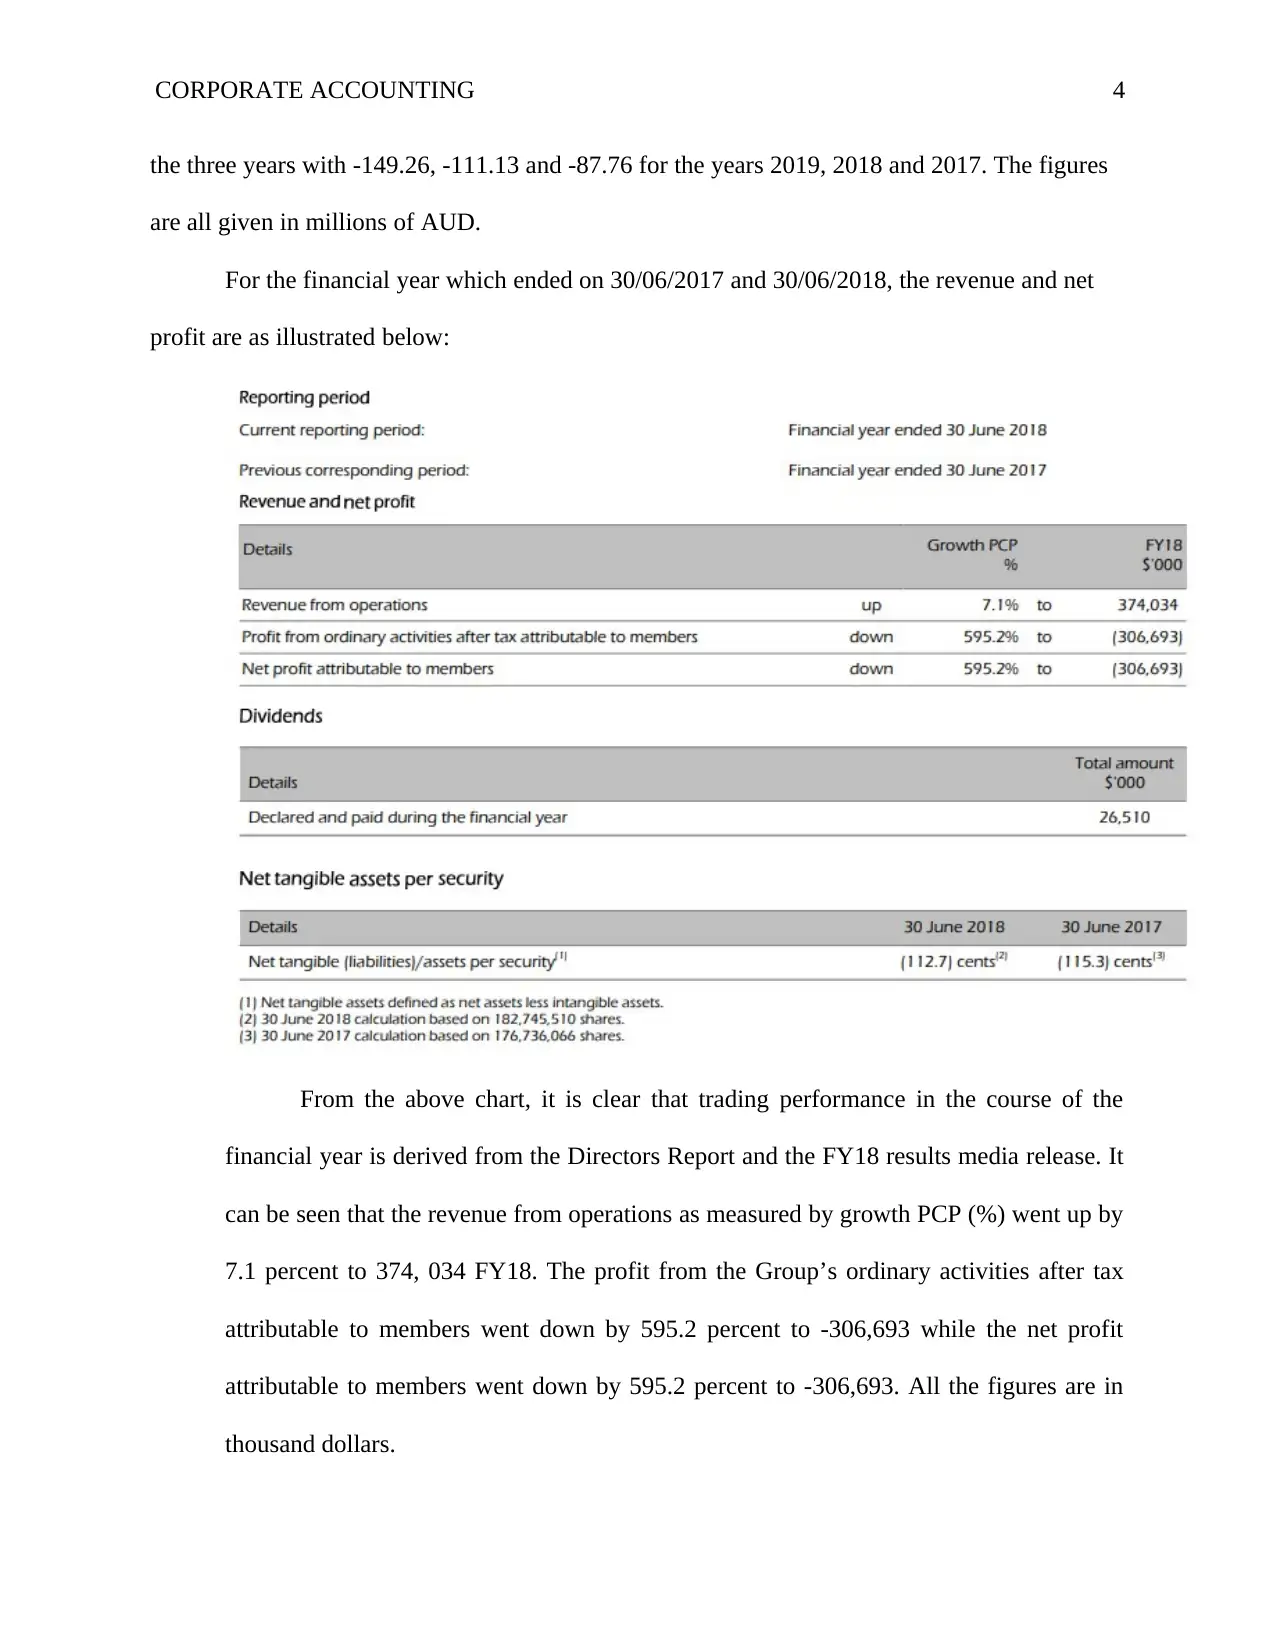
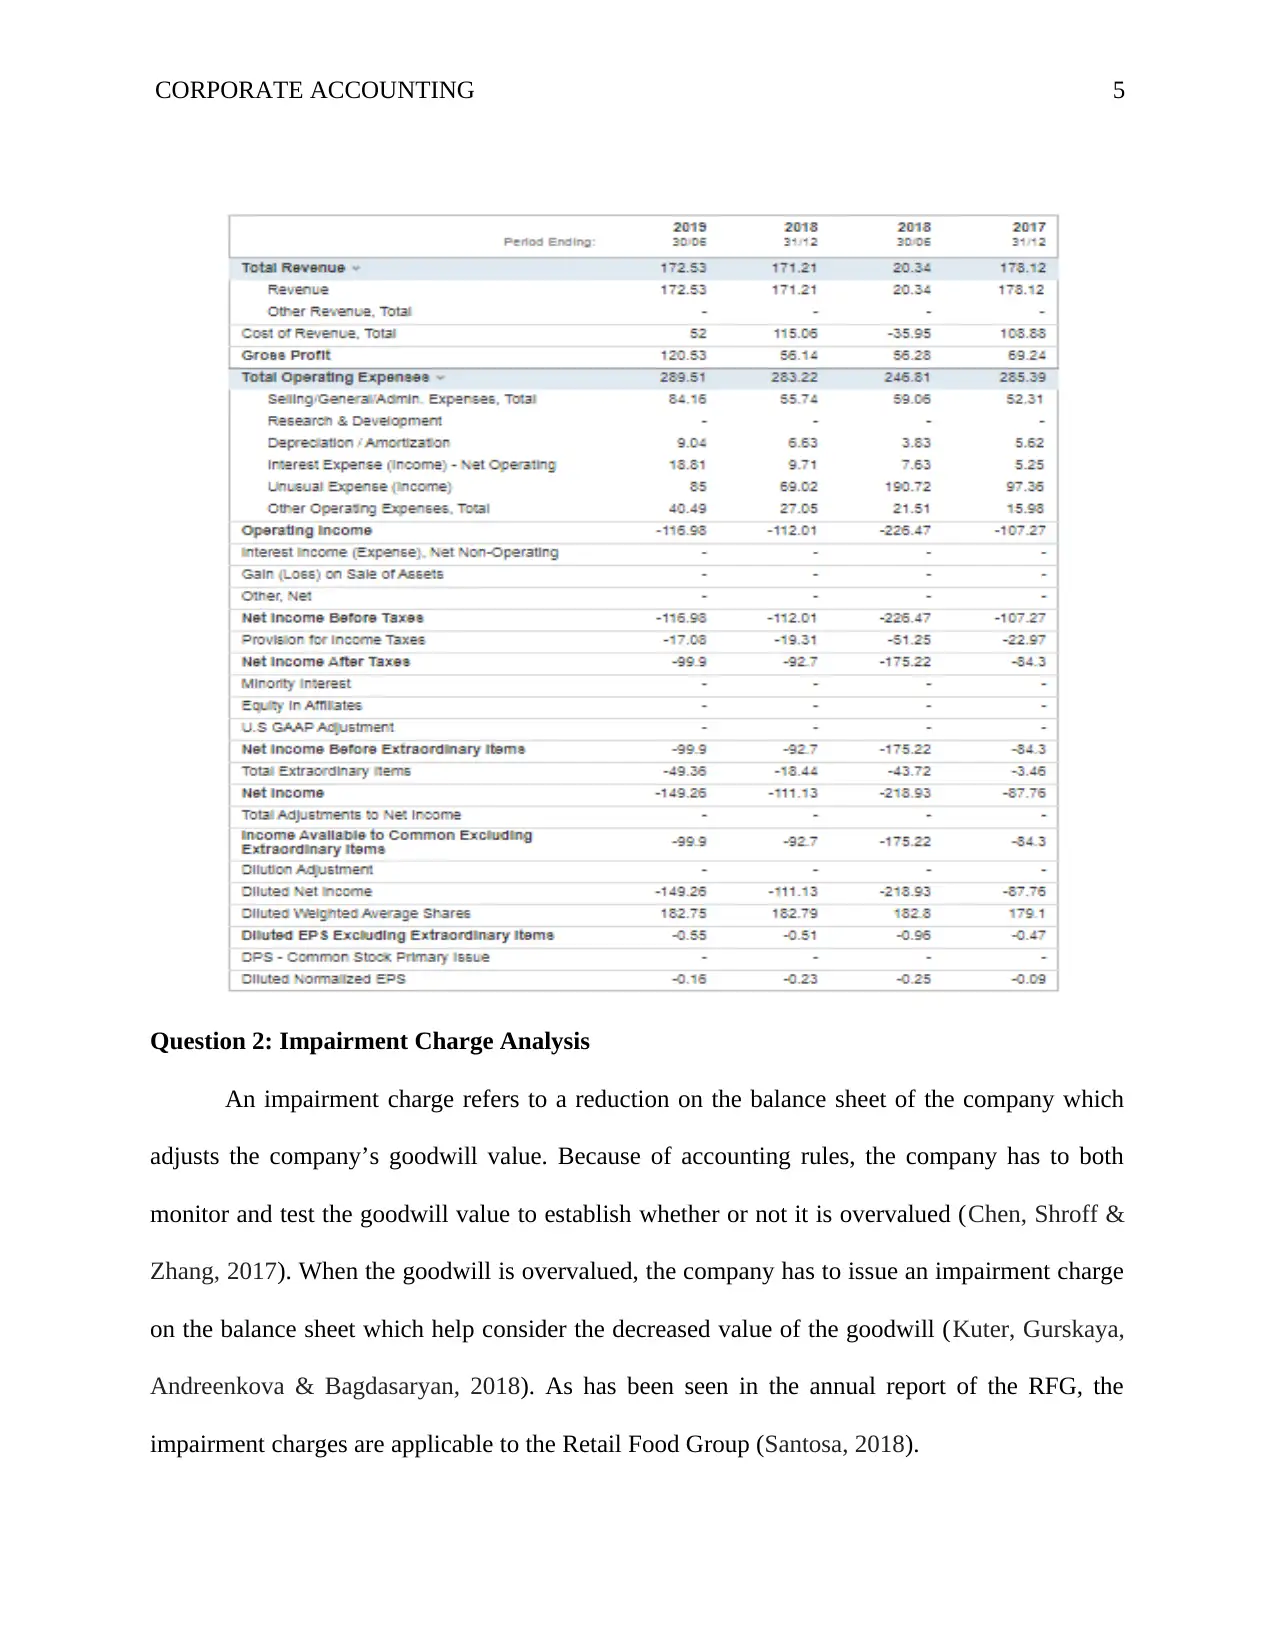
This report provides a financial analysis of Retail Food Group (RFG) from 2017 to 2019, focusing on share price fluctuations, profit/loss trends, and impairment charges. The analysis of share prices covers significant drops in 2017, unexpected increases in 2018, and subsequent movements influenced by company announcements and management changes. The profit/loss analysis reveals fluctuating gross profits and consistent net losses during the period. Furthermore, the report examines impairment charges, particularly the significant charges in FY18 related to business restructuring, franchise store closures, and intangible assets. The report references the company's annual reports and relevant articles to support its findings. This assignment provides a detailed overview of RFG's financial challenges and strategic responses during the specified period. Desklib is a platform where you can find similar solved assignments and study resources.
Document Page
Running head: CORPORATE ACCOUNTING 1
Corporate Accounting
Name
Institutional Affiliation
tabler-icon-diamond-filled.svg

Secure Best Marks with AI Grader

Need help grading? Try our AI Grader for instant feedback on your assignments.
Document Page
CORPORATE ACCOUNTING 2
CORPORATE ACCOUNTING
Question 1:
A. Share Prices Analysis (2017-2019)
The year 2017 was never good for the shareholders of Retail Food Group Limited (ASX:
RFG). This is because the value of their shares plunged by over eighty-eight percent over that
year. However, in year 2018, the share price increased which might have seen as many people
scratching their heads as rejoicing. The RFG share price traded at nearly 40 cents in 2018
(August 15th) but rose up to almost 67 cents by August 22 (same year). This represented a gain of
over 50 percent.
The increase in the share price was hard to explain without any news from the Company.
This is because in June 2018, RFG announced it anticipated to record a net loss of 87.7 million
dollars for FY 2018. The share price of the Company at the time, already hit by news of the
problems of debt and continued sinking following such a news. Since June 2018, the RFG
seemed to be pursuing the measures to assist its ailing business to effectively recover (Yee &
Thaker, 2018). Apart from being able to get bankers ease off such a trigger, the Group had
reportedly involved consultants to assist in rescuing the firm. This was a move which might
ultimately see the Group selling off its assets that then (August 2018) included Donut King,
Michael’s Patisserie, Brumby’s Bakeries as well as Crust Gourmet Pizza Bar (Camilleri, Grima
& Grima, 2019).
The Group’s plunging share price in 2017 coincided with healthy gains which was
notched up by the rivals including Domino’s Pizza Enterprises (ASX: DMP as well as Costa
Group Holdings Ltd (ASX: CGC). This demonstrated that there was money to be effectively
made in the industry. Thus, it was feasible that investors had targeted the RFG’ price to plunge
Document Page
CORPORATE ACCOUNTING 3
as an opportunity as well as remained confident the Group’s management could get the Company
fully recovered. Moreover, the 2018 reshuffle of the Group’s key players that saw Andre Nell
leaving his position as the MD and Richard Hinson stepping up to the position of the CEO a few
months to August 2018, had added such a sense of confidence. Indeed, more needed to been
known at any rate when the Group released its results.
As at July 8, 2019, the Group’s share price had risen thirty percent. Specifically, the share
price increased 29.40 percent on 8/07/2019, apparently following the news.com.au interview
with the CEO of the Group, Peter George which highlighted Mr. George’s future plans for the
Group. The ASX further issued a “please explain” to the Group following its shares jumping
from fourteen cent level it was the trading at opening on Friday to the high of twenty-two cents
hit on 8/07/2019, with exchange operator further noting a “substantial rise in the RFG’s
securities volume traded on that Friday of 5/07/2019. The Group reacted on 09/07/2019
afternoon by charging that it was not aware of the trigger or rationale behind the move and
pointed to the interview which got published on Friday as the potential trigger of the movements
in shares price. The Group’s share price have dropped nearly 98 percent since it record high of
7.56 dollars (hit in Feb 2015), following a sequence of revelations about franchise
mismanagement came to be known.
B. Retail Food Group (RFG Profit (Loss) Analysis (2017-2019)
According the income statements for the RFG, the company has had its ups and downs in
terms of profit and loss. For the period 2017, 2018 and 2019, the Company made a gross profit
of 69.24, 56.28 and 120.53. This shows that there was a decrease in gross profit between 2017
and 2018 and an increase between 2018 and 2019. However, the Company made net loss for all
Document Page
CORPORATE ACCOUNTING 4
the three years with -149.26, -111.13 and -87.76 for the years 2019, 2018 and 2017. The figures
are all given in millions of AUD.
For the financial year which ended on 30/06/2017 and 30/06/2018, the revenue and net
profit are as illustrated below:
From the above chart, it is clear that trading performance in the course of the
financial year is derived from the Directors Report and the FY18 results media release. It
can be seen that the revenue from operations as measured by growth PCP (%) went up by
7.1 percent to 374, 034 FY18. The profit from the Group’s ordinary activities after tax
attributable to members went down by 595.2 percent to -306,693 while the net profit
attributable to members went down by 595.2 percent to -306,693. All the figures are in
thousand dollars.
tabler-icon-diamond-filled.svg

Secure Best Marks with AI Grader

Need help grading? Try our AI Grader for instant feedback on your assignments.
Document Page
CORPORATE ACCOUNTING 5
Question 2: Impairment Charge Analysis
An impairment charge refers to a reduction on the balance sheet of the company which
adjusts the company’s goodwill value. Because of accounting rules, the company has to both
monitor and test the goodwill value to establish whether or not it is overvalued (Chen, Shroff &
Zhang, 2017). When the goodwill is overvalued, the company has to issue an impairment charge
on the balance sheet which help consider the decreased value of the goodwill (Kuter, Gurskaya,
Andreenkova & Bagdasaryan, 2018). As has been seen in the annual report of the RFG, the
impairment charges are applicable to the Retail Food Group (Santosa, 2018).
Document Page
CORPORATE ACCOUNTING 6
The Company, in year 2016 charged an impairment loss on loans carried at amortized
costs which includes restructuring cost amounting to 1285000 dollars and impairment loss on
trade receivables amounting to 1023000 dollars in the year 2017 and 707000 dollars in year
2016. For the FY 18 and FY17, the Company charged impairments and provisions for the
business turnaround as well as restructuring costs which included integration and acquisition
costs amounting to 402.9 million dollars and 5.2 million dollars. FY18 saw the Group assessing
its final position as at 30/06/2018 and specifically, the Group’s Brand Systems carrying value.
The directors took a conservative approach and based this assessment and consequent
impairment position to manifest both the expected FY19 sustainable earning as well as the risk
profile which was inherent in the 2018 challenges (Cheng, Peterson & Sherrill, 2017). This
resulted to the impairment charge of 402.9 million dollars for year 2018. Therefore, it reduced
the funds of shareholder to 158.0 million dollars and denoted an implied value of 0.86 dollars per
share (Majanga, 2015).
Further, during the FY18, which ended on 30/06/2018, the Group incurred a loss
following the income tax of 306.70 million dollars and this included restructuring cost and
business turnaround as well as impairment losses of 427.30 million dollars due to the
provisioning for circa 250 franchise stores closure as well as the impairment impacts coming
from the revised profitability focus linked to reset franchise networks going-forward. There was
also a non-deductible impairment of goodwill for FY18 amounting to 38928000 dollars and
impairment loss on intangible assets amounting to 306, 152,000 dollars. Also, there was an
impairment loss of on trade receivables amounting to 29,089,000 dollars and impairment loss on
loans carried at the amortized costs amounting to 8,003,000 dollars.
Document Page
CORPORATE ACCOUNTING 7
References
Camilleri, S. J., Grima, L., & Grima, S. (2019). The effect of dividend policy on share price
volatility: an analysis of Mediterranean banks’ stocks. Managerial Finance, 45(2), 348-
364.
Chen, W., Shroff, P. K., & Zhang, I. (2017). Fair value accounting: consequences of booking
market-driven goodwill impairment. Available at SSRN 2420528.
Cheng, Y., Peterson, D., & Sherrill, K. (2017). Admitting mistakes pays: the long term impact of
goodwill impairment write-offs on stock prices. Journal of Economics and
Finance, 41(2), 311-329.
Kuter, M., Gurskaya, M., Andreenkova, A., & Bagdasaryan, R. (2018). Asset impairment and
depreciation before the 15th century. Accounting Historians Journal, 45(1), 29-44.
Majanga, B. (2015). The dividend effect on stock price-An empirical analysis of Malawi listed
companies. Accounting and Finance Research, 4(3).
Santosa, A. (2018). Sugar Cane Agribusiness Marketing Analysis On Dry Land People In Ngawi
District, East Java, Indonesia (Special review of farmers' share price, the price
transmission elasticity, and market integrated, and so the structure of the people sugar
market). UNEJ e-Proceeding, 322-335.
Yee, E. C. P., & Thaker, H. M. T. (2018). Determinants Of Share Price Fluctuation: Evidence
From The Manufacturing Industry In Malaysia. Skyline Business Journal, 14(1), 58-71.
chevron_up_icon
1 out of 7
circle_padding
hide_on_mobile
zoom_out_icon
[object Object]