Analyzing Student Motivation & Attitudes - Marketing Research BHO2285
VerifiedAdded on 2023/06/15
|23
|2994
|322
Report
AI Summary
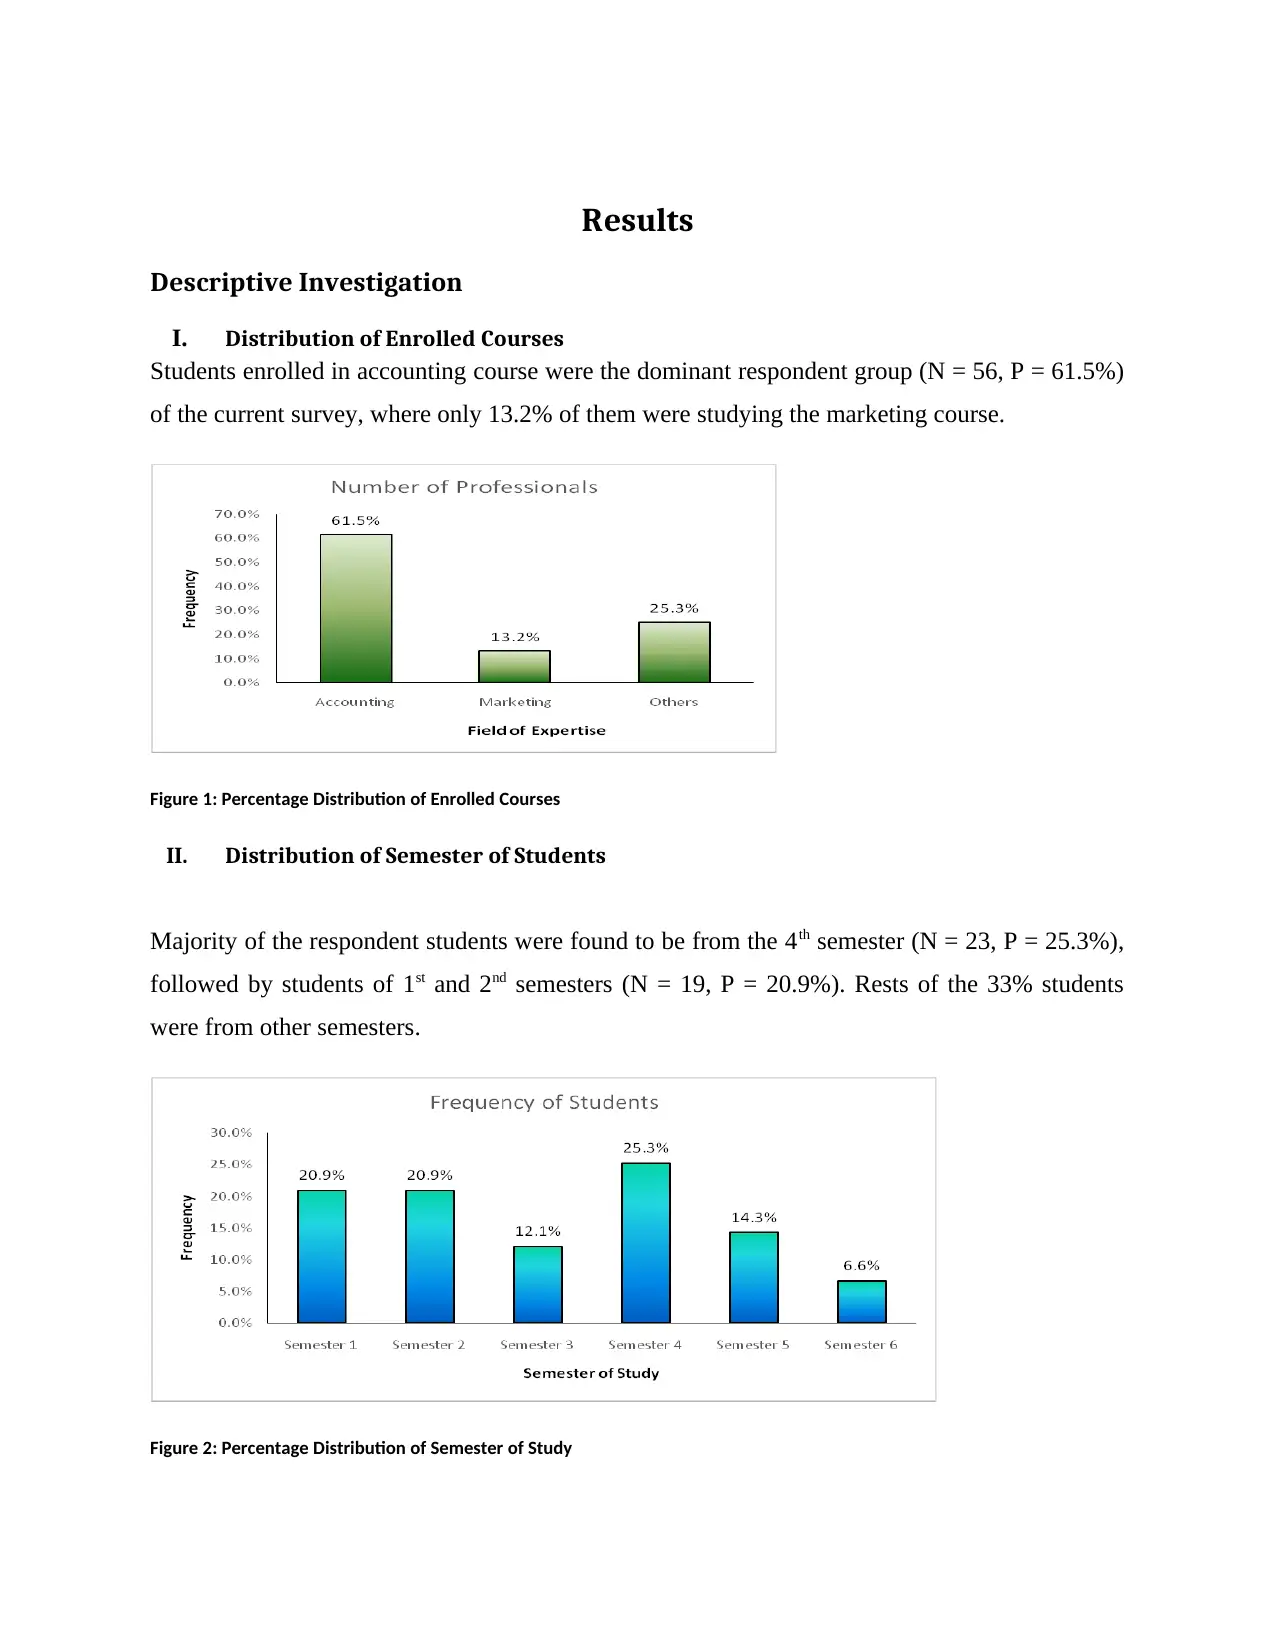
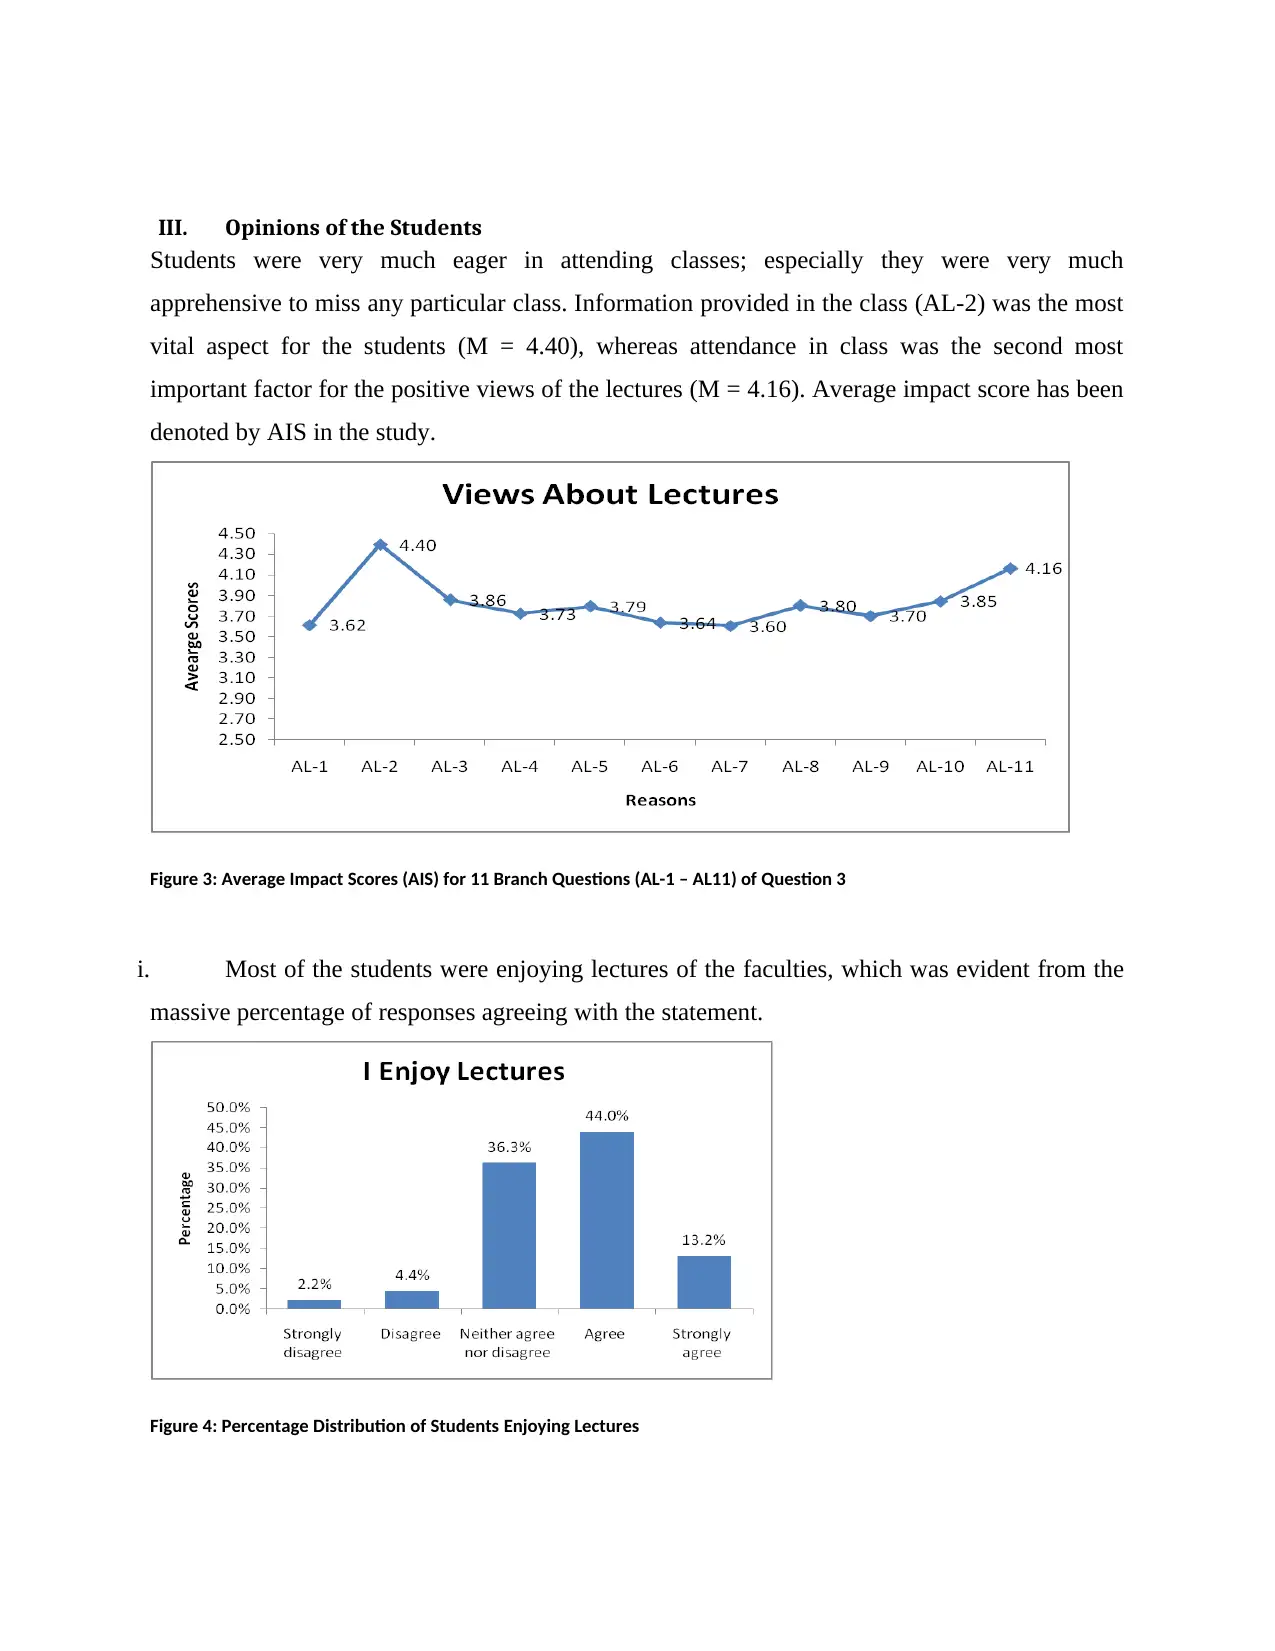
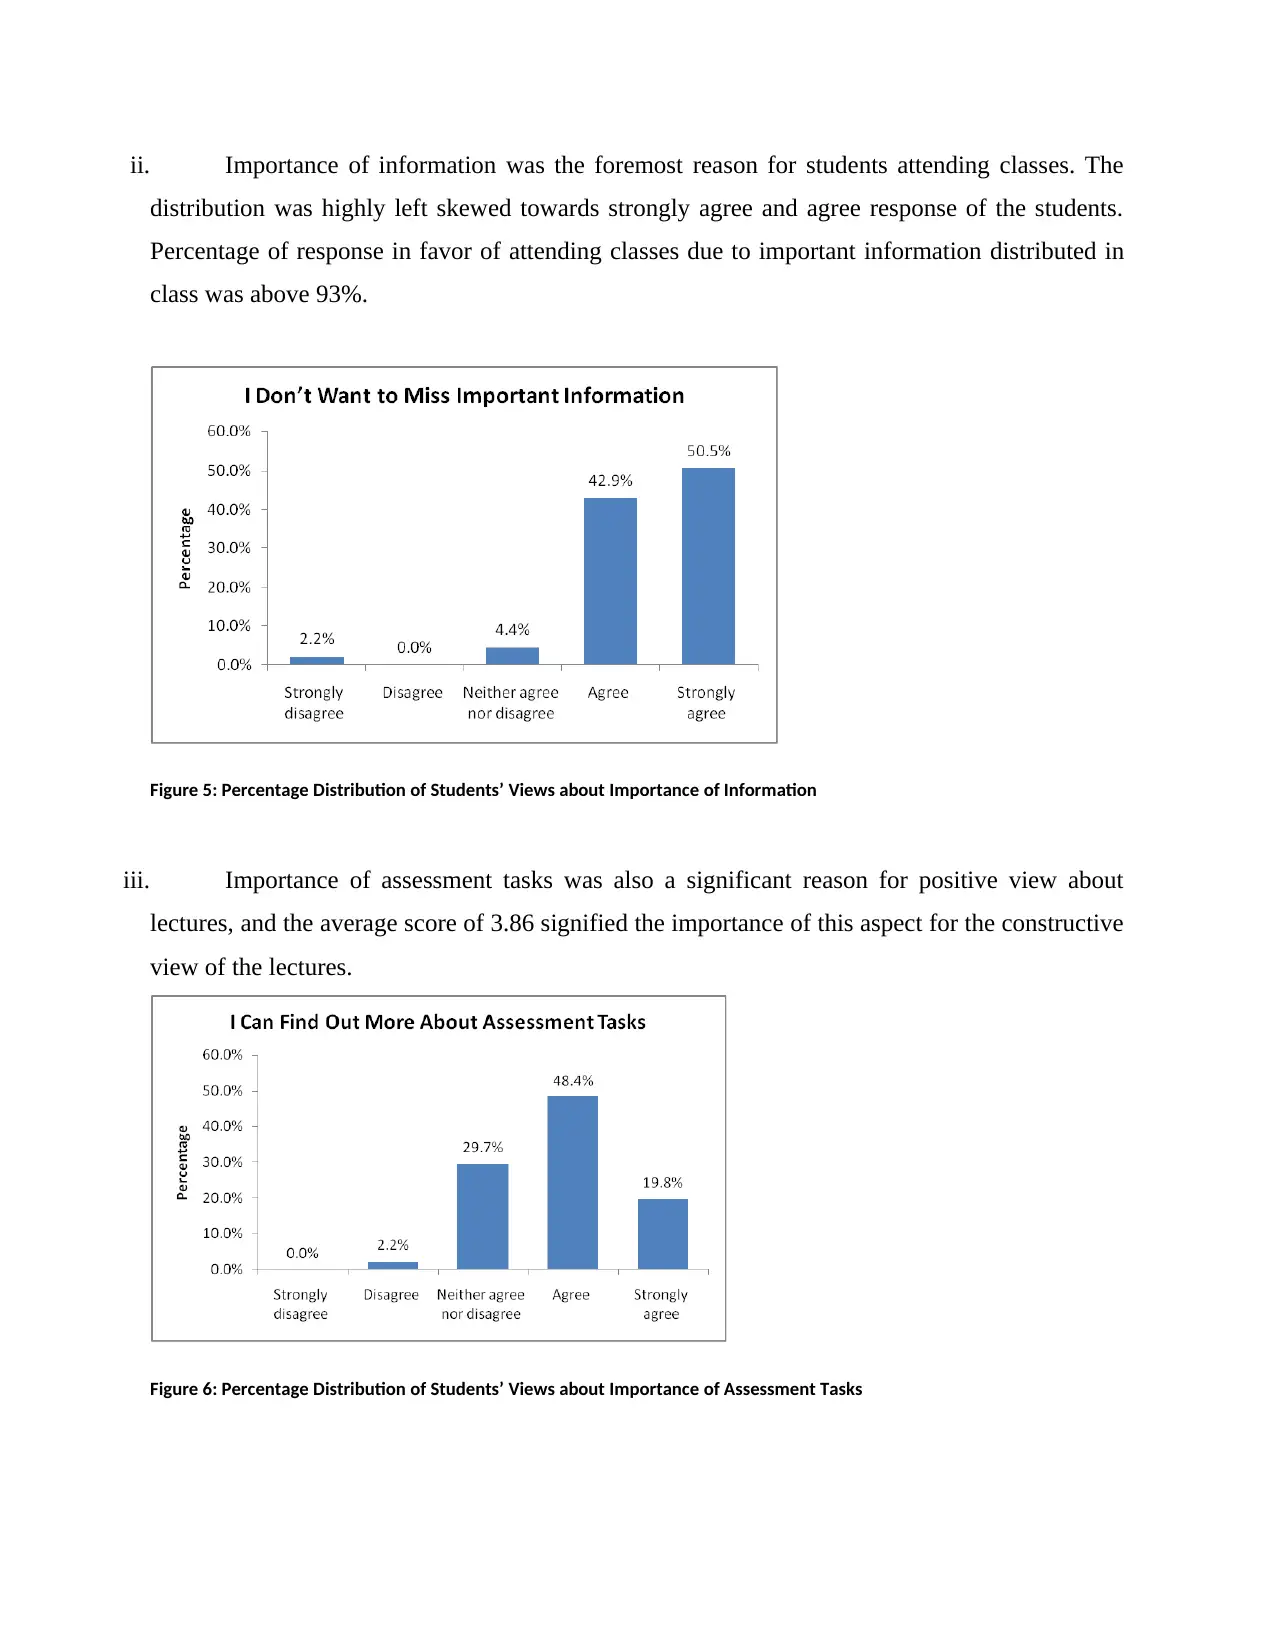
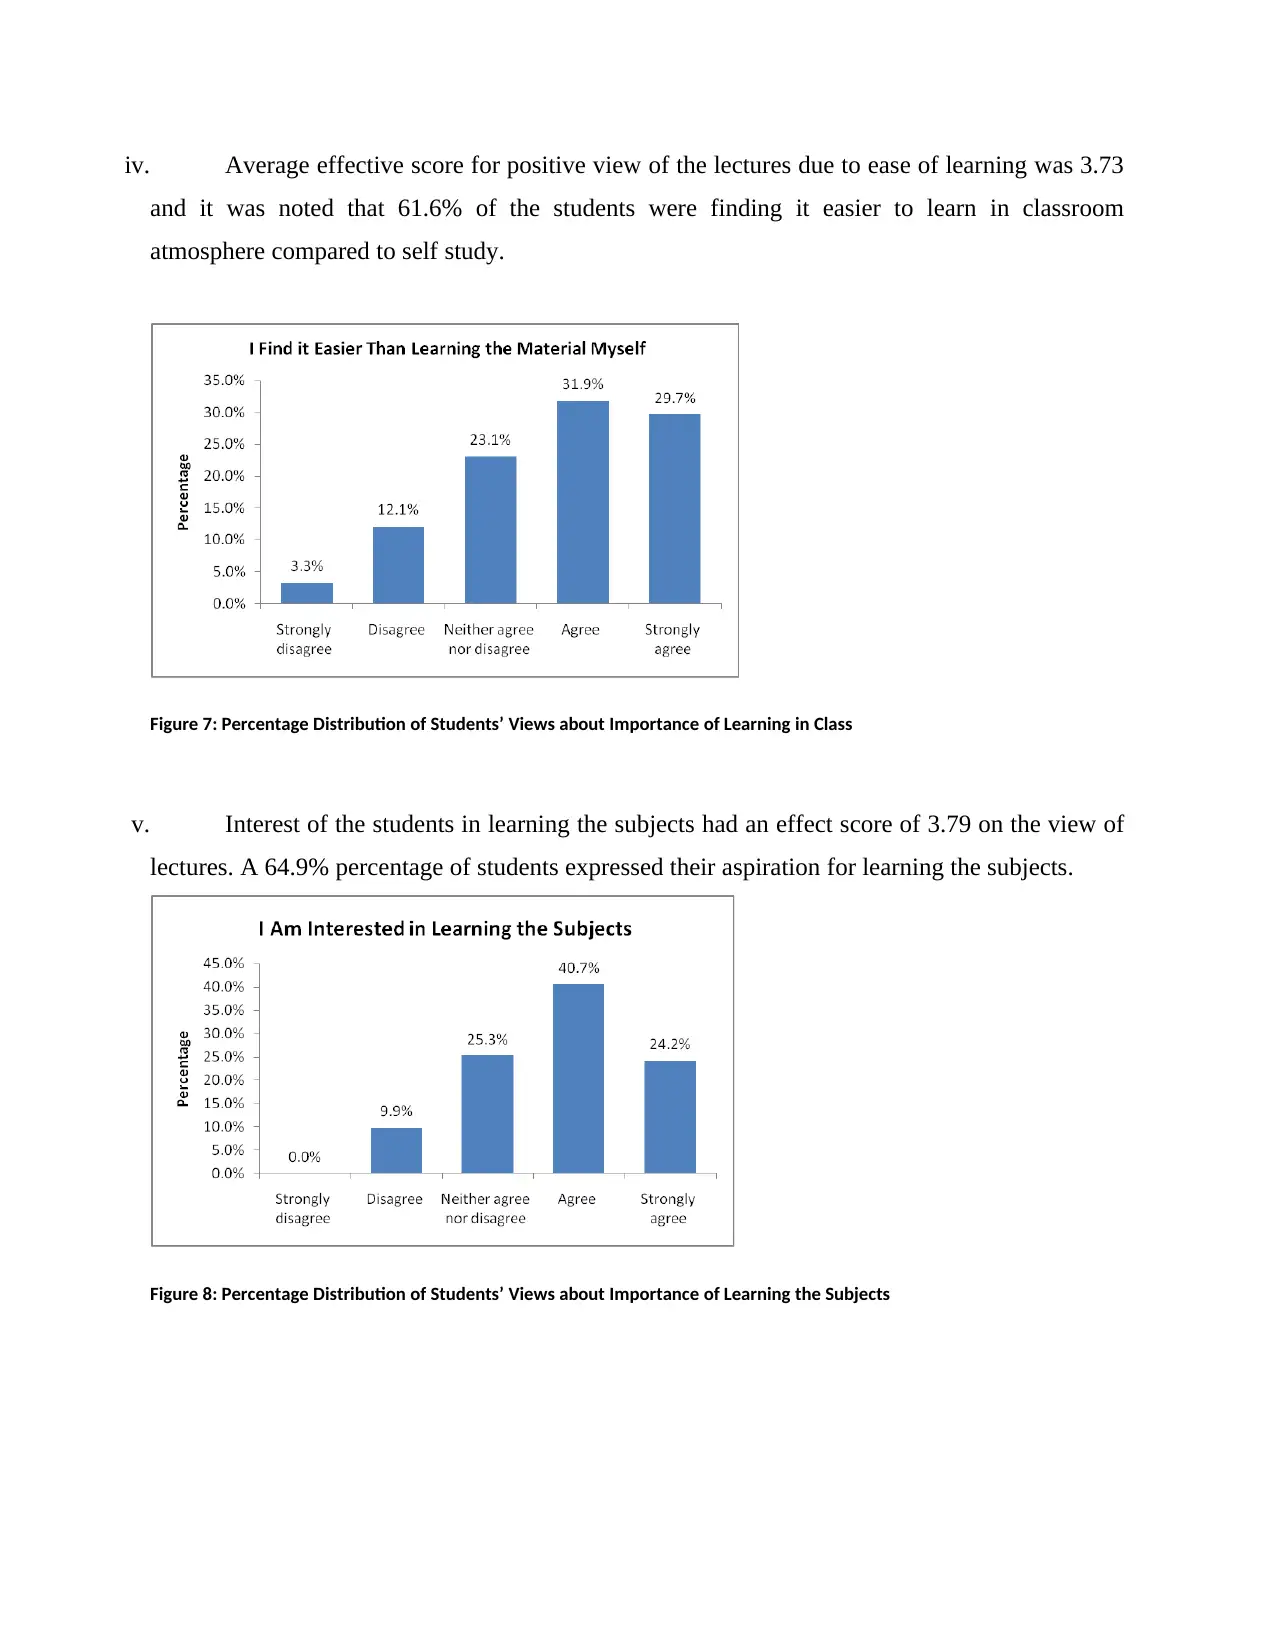
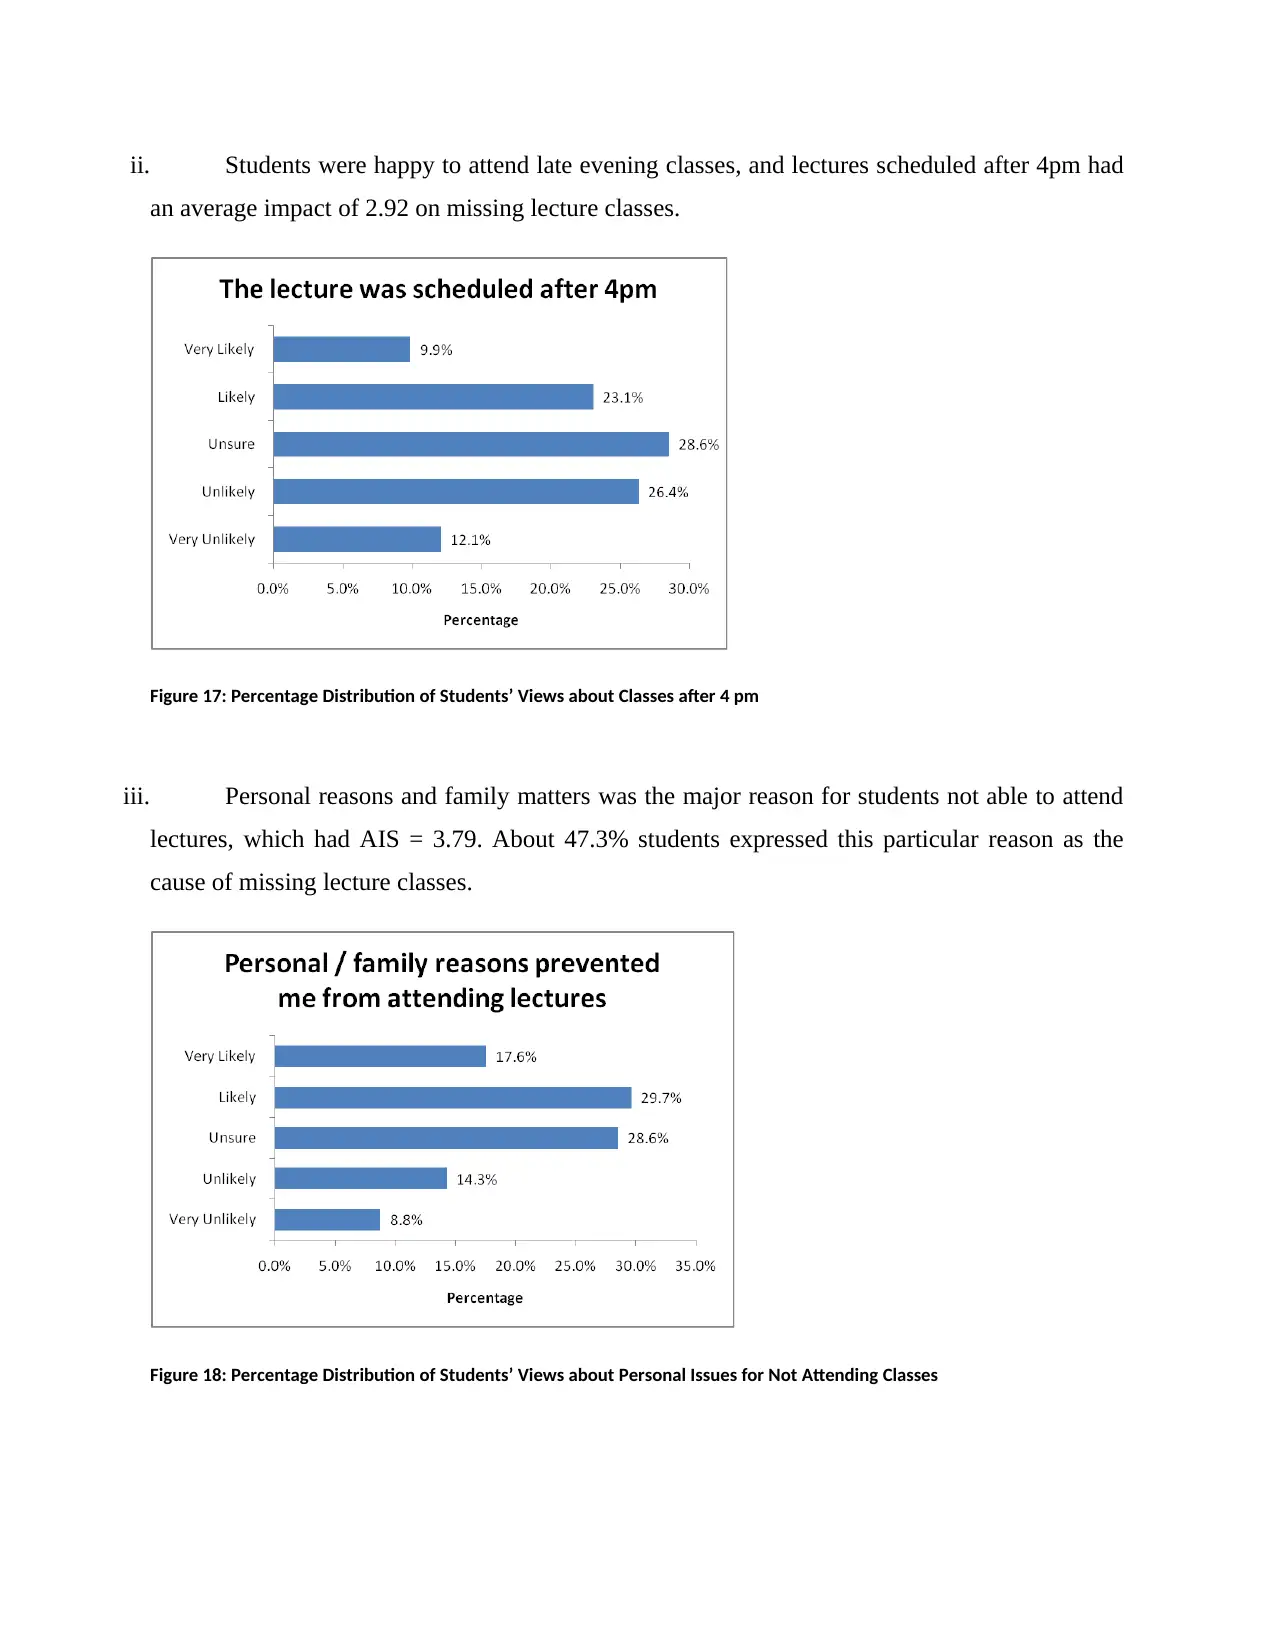
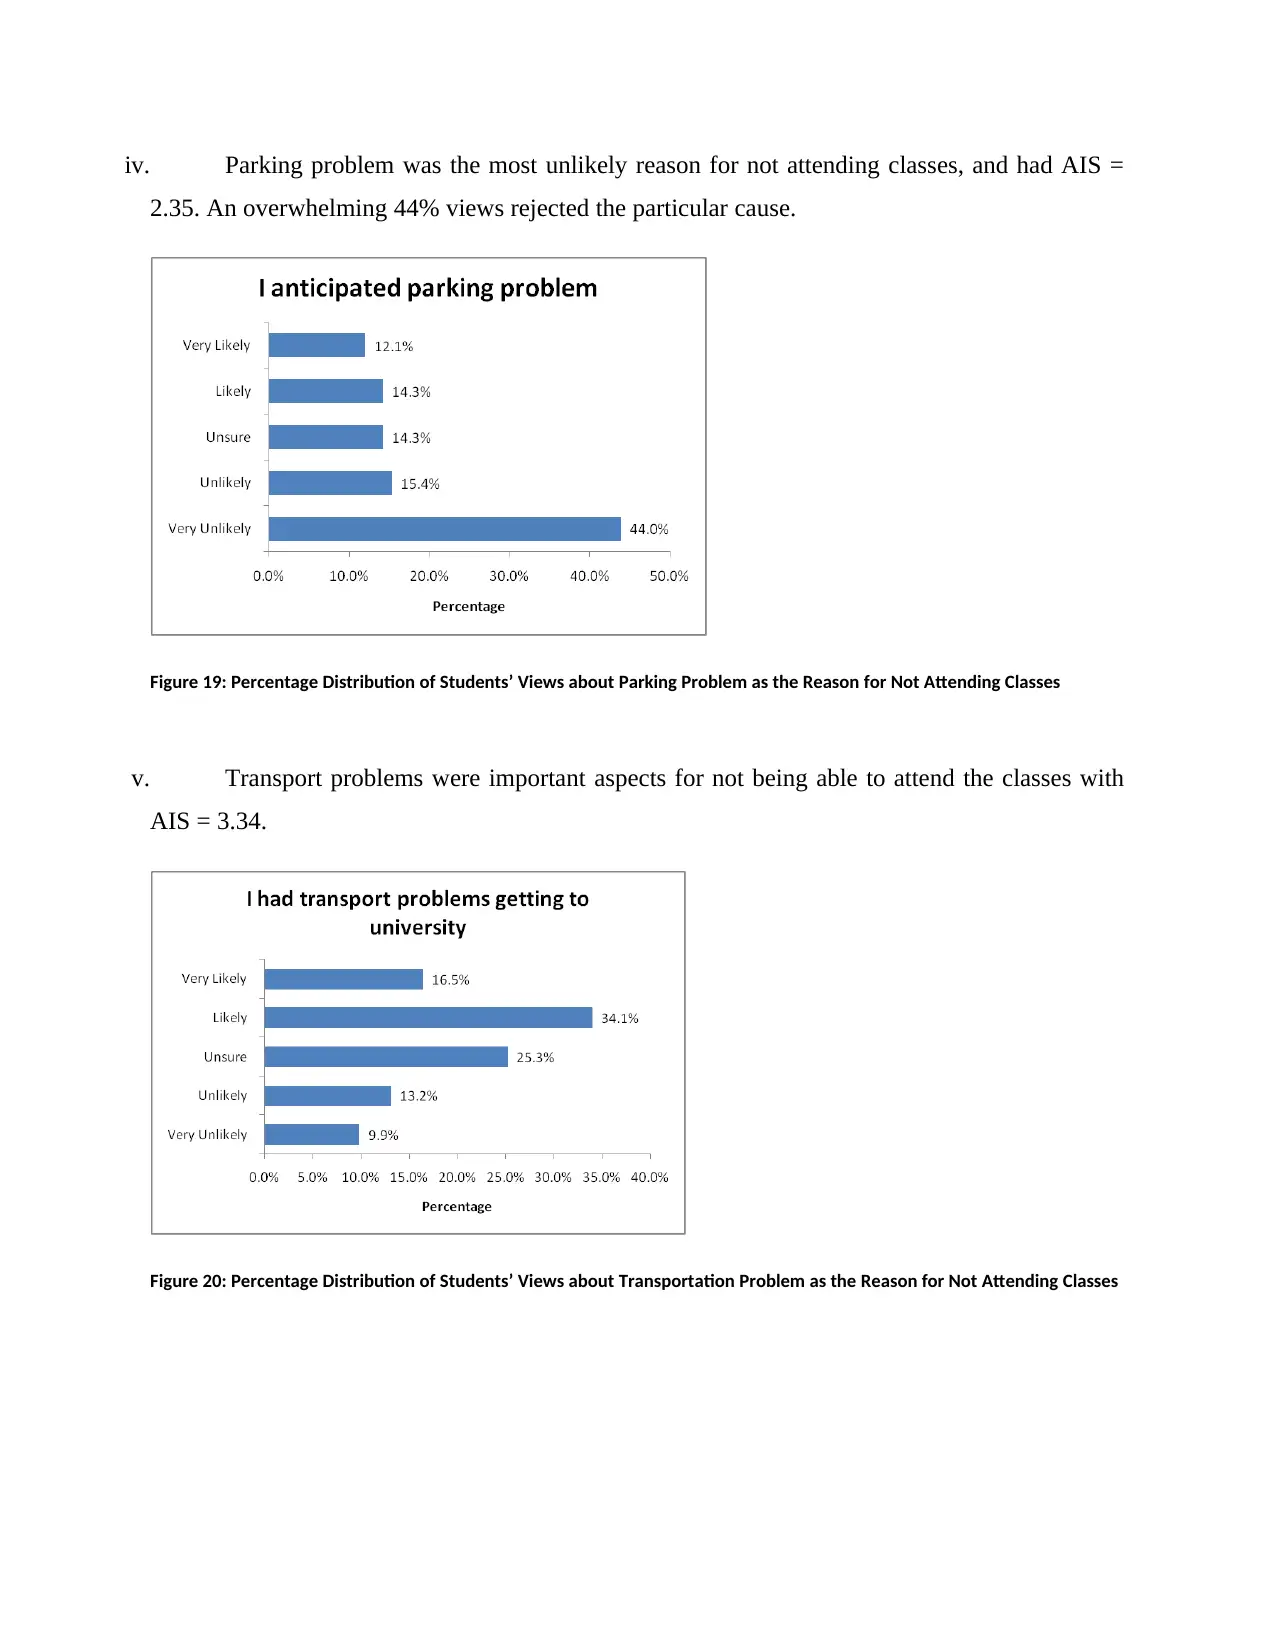
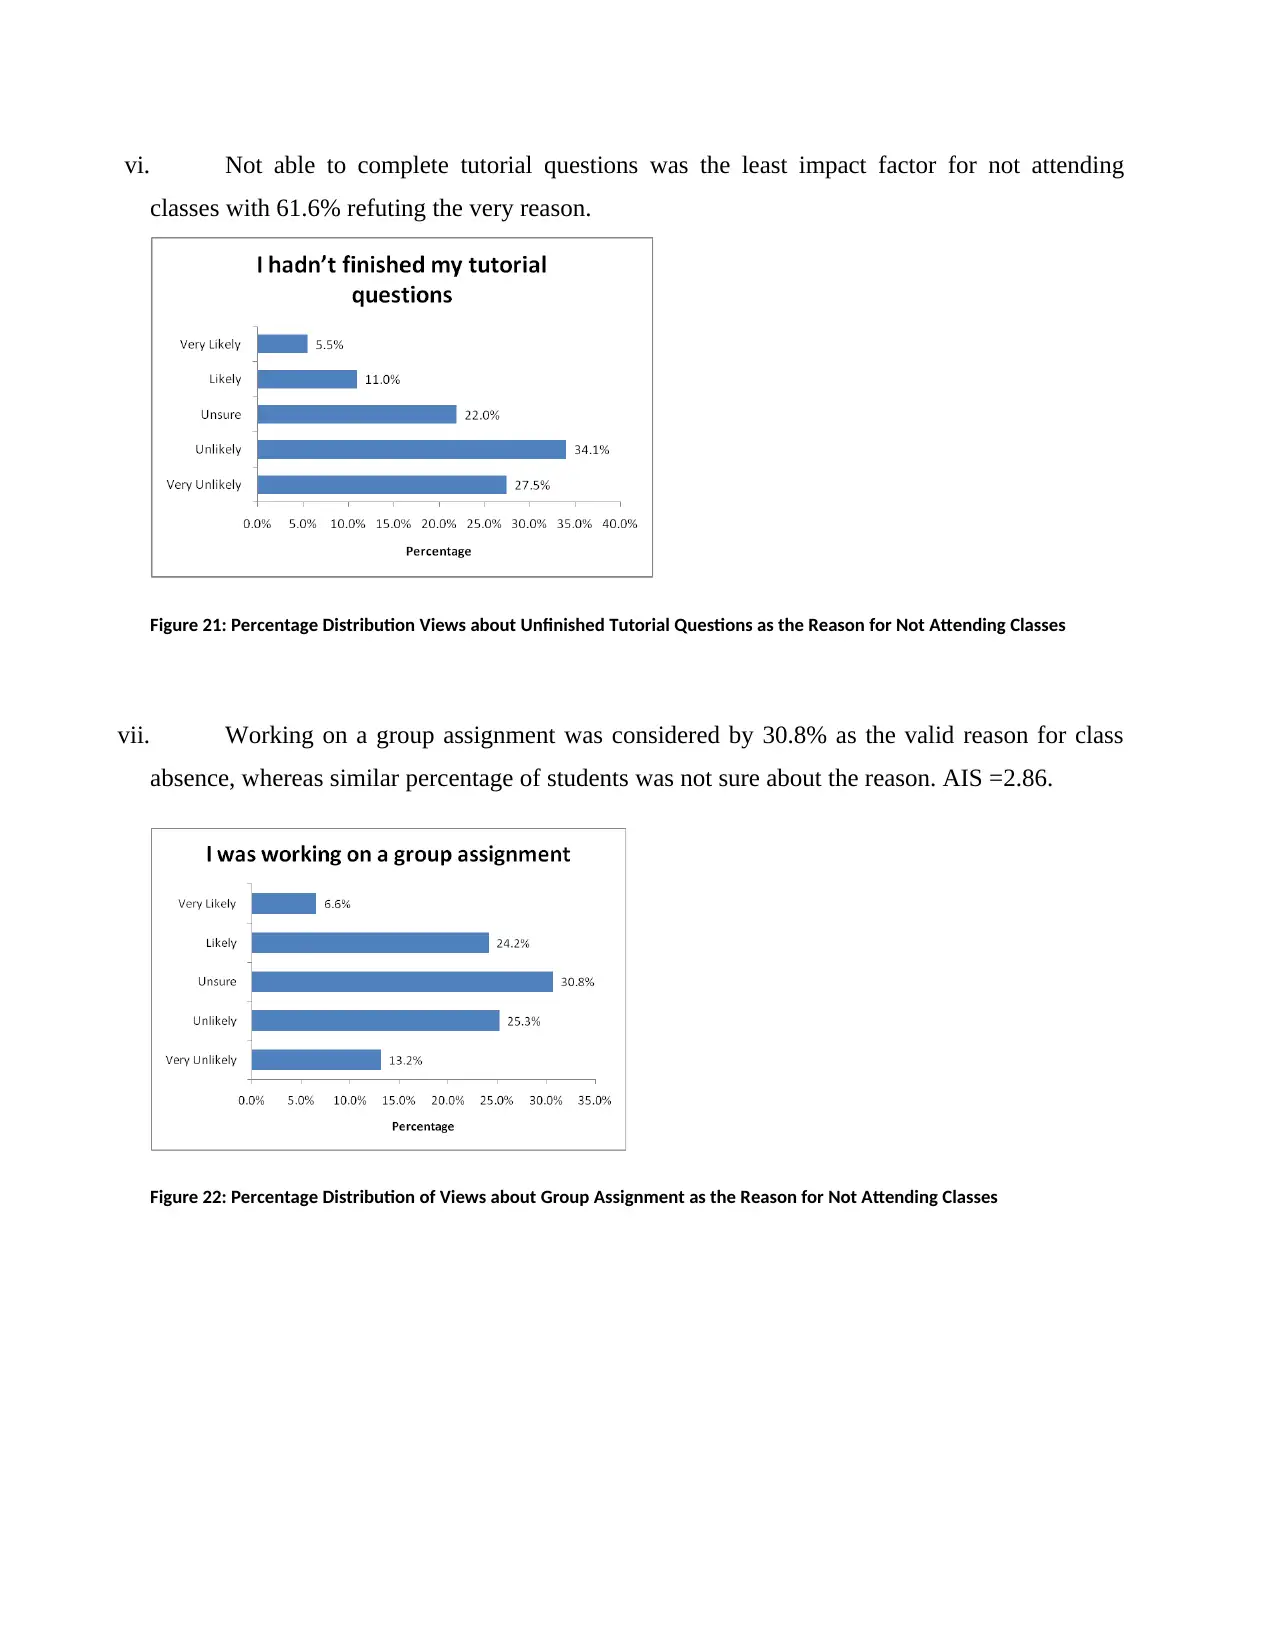
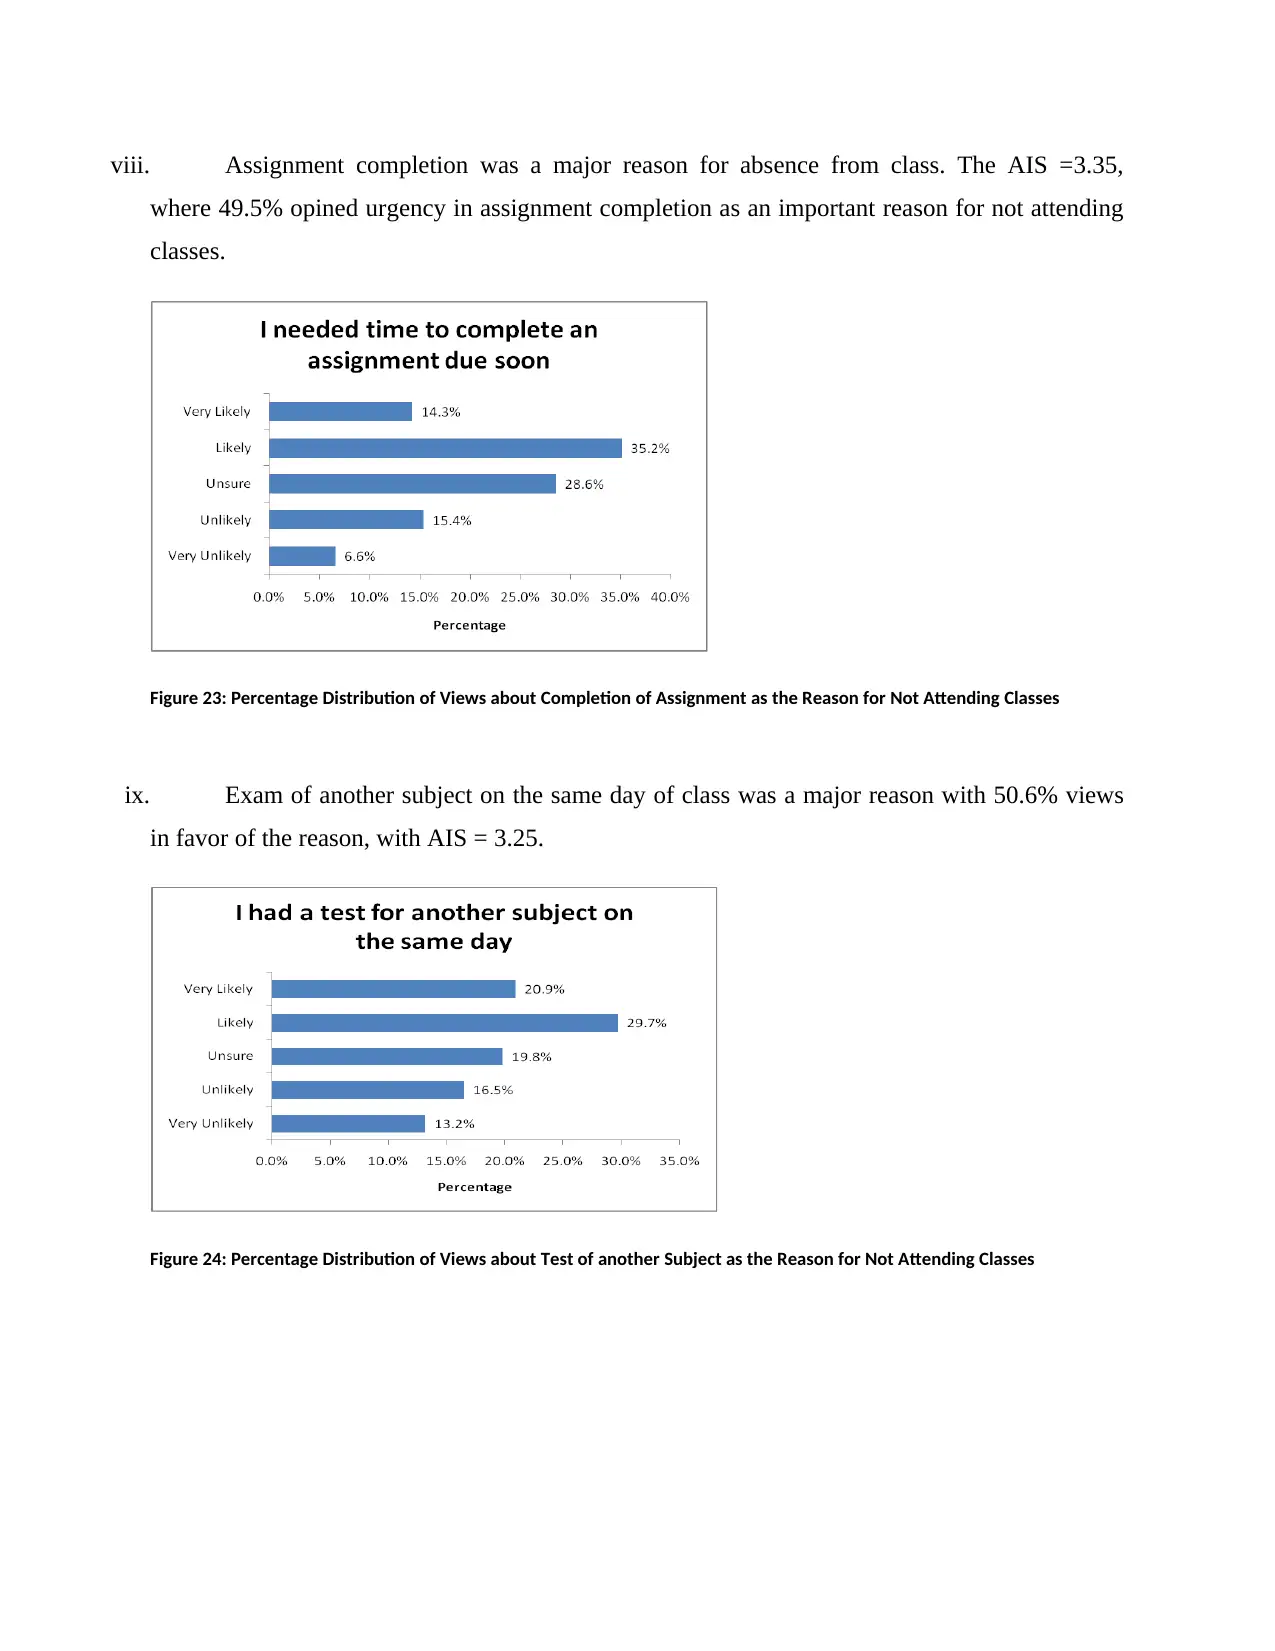
This report investigates students' motivation and attitudes towards attending lectures at Victoria University, Sunway College, as part of a Marketing Research assignment (BHO2285). The analysis covers enrolled courses, student semesters, and opinions on factors influencing lecture attendance, such as information provided in class, assessment tasks, ease of learning, and lecturer effectiveness. It also examines reasons for missing lectures, including early morning classes, personal reasons, and transport issues. The study uses frequency histograms, correlation analysis, and t-tests to explain the relationship between lecture attendance and academic performance. The findings indicate that students value attending classes for the information and exam preparation, while personal reasons and scheduling conflicts are primary reasons for absence. The report concludes that general views and reasons for absence are independent of opinions on the importance of lecture classes for scoring good marks, and there is no significant gender difference in general views about lectures.

Results
Descriptive Investigation
I. Distribution of Enrolled Courses
Students enrolled in accounting course were the dominant respondent group (N = 56, P = 61.5%)
of the current survey, where only 13.2% of them were studying the marketing course.
Figure 1: Percentage Distribution of Enrolled Courses
II. Distribution of Semester of Students
Majority of the respondent students were found to be from the 4th semester (N = 23, P = 25.3%),
followed by students of 1st and 2nd semesters (N = 19, P = 20.9%). Rests of the 33% students
were from other semesters.
Figure 2: Percentage Distribution of Semester of Study
Paraphrase This Document
Need a fresh take? Get an instant paraphrase of this document with our AI Paraphraser

III. Opinions of the Students
Students were very much eager in attending classes; especially they were very much
apprehensive to miss any particular class. Information provided in the class (AL-2) was the most
vital aspect for the students (M = 4.40), whereas attendance in class was the second most
important factor for the positive views of the lectures (M = 4.16). Average impact score has been
denoted by AIS in the study.
Figure 3: Average Impact Scores (AIS) for 11 Branch Questions (AL-1 – AL11) of Question 3
i. Most of the students were enjoying lectures of the faculties, which was evident from the
massive percentage of responses agreeing with the statement.
Figure 4: Percentage Distribution of Students Enjoying Lectures

ii. Importance of information was the foremost reason for students attending classes. The
distribution was highly left skewed towards strongly agree and agree response of the students.
Percentage of response in favor of attending classes due to important information distributed in
class was above 93%.
Figure 5: Percentage Distribution of Students’ Views about Importance of Information
iii. Importance of assessment tasks was also a significant reason for positive view about
lectures, and the average score of 3.86 signified the importance of this aspect for the constructive
view of the lectures.
Figure 6: Percentage Distribution of Students’ Views about Importance of Assessment Tasks
⊘ This is a preview!⊘
Do you want full access?
Subscribe today to unlock all pages.

Trusted by 1+ million students worldwide

iv. Average effective score for positive view of the lectures due to ease of learning was 3.73
and it was noted that 61.6% of the students were finding it easier to learn in classroom
atmosphere compared to self study.
Figure 7: Percentage Distribution of Students’ Views about Importance of Learning in Class
v. Interest of the students in learning the subjects had an effect score of 3.79 on the view of
lectures. A 64.9% percentage of students expressed their aspiration for learning the subjects.
Figure 8: Percentage Distribution of Students’ Views about Importance of Learning the Subjects
Paraphrase This Document
Need a fresh take? Get an instant paraphrase of this document with our AI Paraphraser

vi. Though students agreed about the fact that lecturers provided an excellent synopsis in the
classroom, but, 28.6% of the views reflected that they were not very sure about this particular
aspect. The effective impact score was 3.64 for the view of the lectures.
Figure 9: Percentage Distribution of Students’ Views about Synopsis Provided in the Class
vii. Lecturers’ provided examples were appreciated strongly by 15.4% students, but there
were 30.8% students who were not very confident or convinced about the impact of examples.
The impact score on views of lectures was 3.6.
Figure 10: Percentage Distribution of Students’ Views about Importance of Examples in the Classroom

viii. Examination important questions from the lectures of the faculty were an important
aspect for positive views of the lectures. The impact with average score of 3.8 was significant,
where 50.5% students agreed with the importance of emphasis provided on the examination
during the lectures.
Figure 11: Percentage Distribution of Students’ Views about Importance of Examination Emphasis
ix. The impact on positive views about the lectures with an average of 3.7, importance of
lectures for the students was also a significant factor. Majority of the students (P = 63.85) opined
that they were not confident about passing the examination without attending the classes.
Figure 12: Percentage Distribution of Students’ Views about Importance of Attending the Classes
⊘ This is a preview!⊘
Do you want full access?
Subscribe today to unlock all pages.

Trusted by 1+ million students worldwide

x. Clarifying doubts by asking questions in class had an impact on views of lectures with
average score of 3.85. Responses yielded reflected that 70.4% students were positively affected
by the interactive session the classrooms.
Figure 13: Percentage Distribution of Students’ Views about Importance of Questions Asked During Lectures
xi. The second most impact on positive views of lectures was due to importance of
attendance in class. The AIS = 4.16, where an overwhelming percentage (P = 82.5%) of
affirmative responses was noted.
Figure 14: Percentage Distribution of Students’ Views about Importance of Class Attendance
Paraphrase This Document
Need a fresh take? Get an instant paraphrase of this document with our AI Paraphraser

IV. Failure to attend lectures
Failure to attend lectures due to early morning classes (SL-1) and personal reasons (SL-3) were
two prime reasons. The least likely cause for not attending classes was identified as the facility
of downloading materials from student dashboard and studying themselves.
Figure 15: Average Impact Scores for 21 Branch Questions (SL-1 – SL21) of Question 4
i. An early morning lecture class was the second impact factor for not attending class with
AIS = 3.42. Almost 52% students opined in favor of this reason for not able to attend classes.
Figure 16: Percentage Distribution of Students’ Views about Early Morning Classes

ii. Students were happy to attend late evening classes, and lectures scheduled after 4pm had
an average impact of 2.92 on missing lecture classes.
Figure 17: Percentage Distribution of Students’ Views about Classes after 4 pm
iii. Personal reasons and family matters was the major reason for students not able to attend
lectures, which had AIS = 3.79. About 47.3% students expressed this particular reason as the
cause of missing lecture classes.
Figure 18: Percentage Distribution of Students’ Views about Personal Issues for Not Attending Classes
⊘ This is a preview!⊘
Do you want full access?
Subscribe today to unlock all pages.

Trusted by 1+ million students worldwide

iv. Parking problem was the most unlikely reason for not attending classes, and had AIS =
2.35. An overwhelming 44% views rejected the particular cause.
Figure 19: Percentage Distribution of Students’ Views about Parking Problem as the Reason for Not Attending Classes
v. Transport problems were important aspects for not being able to attend the classes with
AIS = 3.34.
Figure 20: Percentage Distribution of Students’ Views about Transportation Problem as the Reason for Not Attending Classes
Paraphrase This Document
Need a fresh take? Get an instant paraphrase of this document with our AI Paraphraser

vi. Not able to complete tutorial questions was the least impact factor for not attending
classes with 61.6% refuting the very reason.
Figure 21: Percentage Distribution Views about Unfinished Tutorial Questions as the Reason for Not Attending Classes
vii. Working on a group assignment was considered by 30.8% as the valid reason for class
absence, whereas similar percentage of students was not sure about the reason. AIS =2.86.
Figure 22: Percentage Distribution of Views about Group Assignment as the Reason for Not Attending Classes

viii. Assignment completion was a major reason for absence from class. The AIS =3.35,
where 49.5% opined urgency in assignment completion as an important reason for not attending
classes.
Figure 23: Percentage Distribution of Views about Completion of Assignment as the Reason for Not Attending Classes
ix. Exam of another subject on the same day of class was a major reason with 50.6% views
in favor of the reason, with AIS = 3.25.
Figure 24: Percentage Distribution of Views about Test of another Subject as the Reason for Not Attending Classes
⊘ This is a preview!⊘
Do you want full access?
Subscribe today to unlock all pages.

Trusted by 1+ million students worldwide
1 out of 23

Your All-in-One AI-Powered Toolkit for Academic Success.
+13062052269
info@desklib.com
Available 24*7 on WhatsApp / Email
Unlock your academic potential
Copyright © 2020–2025 A2Z Services. All Rights Reserved. Developed and managed by ZUCOL.